This is a repository copy of
The effect of particle shape on predicted segregation in binary
powder mixtures
.
White Rose Research Online URL for this paper:
http://eprints.whiterose.ac.uk/118401/
Version: Accepted Version
Article:
Alizadeh, M, Hassanpour, A orcid.org/0000-0002-7756-1506, Pasha, M et al. (2 more
authors) (2017) The effect of particle shape on predicted segregation in binary powder
mixtures. Powder Technology, 319. pp. 313-322. ISSN 0032-5910
https://doi.org/10.1016/j.powtec.2017.06.059
(c) 2017 Published by Elsevier B.V. This manuscript version is made available under the
CC BY-NC-ND 4.0 license http://creativecommons.org/licenses/by-nc-nd/4.0/
[email protected] https://eprints.whiterose.ac.uk/ Reuse
Items deposited in White Rose Research Online are protected by copyright, with all rights reserved unless indicated otherwise. They may be downloaded and/or printed for private study, or other acts as permitted by national copyright laws. The publisher or other rights holders may allow further reproduction and re-use of the full text version. This is indicated by the licence information on the White Rose Research Online record for the item.
Takedown
If you consider content in White Rose Research Online to be in breach of UK law, please notify us by
The effect of particle shape on predicted segregation in
binary powder mixtures
Mohammadreza Alizadeh, Ali Hassanpour , Mehrdad Pasha, Mojtaba
Ghadiri, Andrew Bayly.
School of Chemical and Process Engineering, University of Leeds, Leeds,
UK.
Corresponding author:
Tel: +44(0)113 343 2405
[email protected]
Abstract
NEWParticle shape driven segregation in particulate mixtures has received limited attention in
the literature either experimentally or via simulation. This study investigates the shape driven
segregation which occurs during the process of heap formation and evaluates the ability of
different Discrete Element Method (DEM) simulation approaches to predict the effect. It shows
experimentally that the difference in particle shape can drive segregation in a binary mixture and
that this segregation can be predicted by DEM models which resolve the particle shape. In this
case shape is resolved via a clumped sphere approach. Importantly, the work also
demonstrates that simpler models using spherical particles, with rolling friction calibrated to
reproduce the experimental angle of repose, tend to underestimate the segregation tendency.
The system studied was a binary mixture of irregular shaped particles, a typical spray dried
detergent powder and a granulated detergent additive; particle shapes were obtained using
X-ray microtomography.
Key words: Granular segregation, DEM, Discrete Element Method, clumped spheres,
2
Introduction
Segregation is a serious problem in the handling and manufacturing of particulate solid
mixtures. It causes a variety of difficulties and has significant cost implications. For example,
segregation may impose extra costs, where loss of homogeneity of the formulated mixtures can
lead to customer dissatisfaction and/or batch failure due to quality assurance examination [1, 2].
There are many contributing factors leading to segregation; these can be divided into two main
categories: 1) differences in particle properties (internal causes) and 2) process dynamics
(external causes). From the internal causes, differences in size, density, shape, and surface
properties are some of the main factors contributing to segregation [3-6]. For the external
causes, vibration [7], shear strain [8], fluid drag [9], and equipment geometry [10], are examples
causing segregation by percolation, sifting, projection, and elutriation mechanisms [3, 4, 11-17].
The effect of various parameters on segregation in bounded heap formation is reviewed
by Fan et al. [18]. The authors concluded that there is still lack of a profound understanding of
the effect of particle shape on segregation, particularly during the particle discharge and heap
formation. Rounded particles have a higher flowability, leading to smaller repose angles and
more prone to segregation. In contrast irregular shapes are subject to entanglement and
interlocking among the particles, preventing them from free flowing and percolations [3, 4,
18-21]. Shape can also be a complementary cause to other segregation-inducing factors such as
density and surface condition. For example, shape has a direct impact on packing density of the
particles which potentially is a source for segregation [19]. Particle shape can also change the
surface to volume ratio of the particles which ultimately affects the influence of the surface
condition on particles movement. On this basis, ignoring the shape in numerical simulations may
cause misleading results [22]. Numerical simulations are helpful in understanding of segregation
3
have been studied extensively [4, 12, 23-29]; however studies including the shape effect are
limited to those which use a rolling friction term as a surrogate for shape and studies which use
realistic particle shapes are not widely reported [1, 30].
A common approach to consider the effect of shape has been the use of an artificial rolling
friction in the modelling [4, 31-34], which can be calibrated against experimental data.
Alternatively a more rigorous approach is to simulate particles shape by clumping spheres
together, as proposed by Favier et al. [35], and optimise conformity with the real shape.
Nevertheless the use of spheres with calibrated rolling friction in DEM simulations is more
prevalent simply because this method is less computationally expensive. Recently, Pasha et al.
[36] have shown that the rolling friction can be tuned to simulate the experimental trends, but the
shortcoming of this approach is that the optimum value of rolling friction coefficient is not
available a priori, and hence the approach is not predictive. Instead, approximating the particle
shape by clumped spheres has shown a good agreement with the experimental data [36]. The
main objective of this study is to assess the significance of particle shape in numerical
simulations of segregation of binary granular mixtures.
A step-by-step methodology for predicting the granular segregation tendency is proposed
which has accommodated the particle shape complexity into the simulations. The process of
heap formation of a binary powder mixture of spray dried detergent powders (referred to as
Blown Powder or BP) and tetraacetylethylenediamine (TAED) particles is simulated using DEM.
The approaches of clumped spheres and spheres with calibrated rolling friction are utilised in
the simulations and the particle segregation tendency is analysed. The results are then
4
Methodology
2.1 Geometry and materials
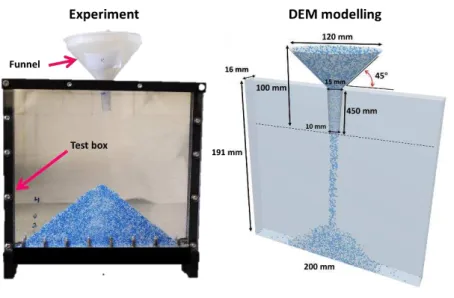
The geometry used in the simulations and experiments is shown in Fig. 1. It consists of a
transparent box (0.200 m in height, 0.191 m in width, and 0.016 m in depth) made from Perspex
and a plastic funnel on top. The particles are discharged from the funnel and make a heap in the
box from which the repose angle is measured. The same process and geometry is used in DEM
simulations in which the angle of repose is used as a benchmark for calibration of the DEM input
parameters. All the simulation tests are carried out with a 50:50 balk volume ratio of BP and
TAED.
Fig. 1. Geometry utilised in DEM simulations based on the geometry of the experimental set up.
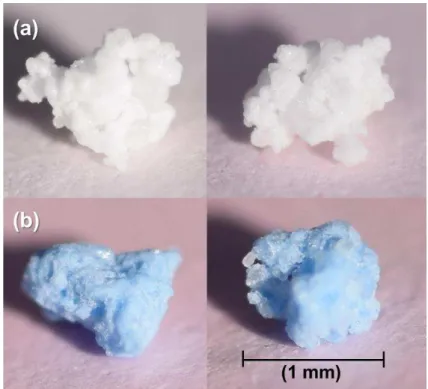
Particles selected and tested here are shown in Fig. 2. BP particles are more irregular,
because of the spray drying process, compared to the TAED particles with smaller asperities
made by granulation. To ensure that the effect of particle shape on segregation extent is not
dominated by the particle size effect, narrow size cuts, 850-1000 µm, of BP and TAED particles
5
Fig. 2. Typical shapes of (a) BP (white) and (b) TAED (blue) particles sieved between 850 and 1000
m.
2.2 Computational methodology
EDEM 2.7.0 software provided by DEM Solutions, Edinburgh, UK is used for the
simulations. The particles used in this study are dry and free flowing and their sizes are
relatively large; therefore the contact adhesive interactions are not dominant and hence
negligible compared to the gravitational force (high Bond and low Cohesion numbers) [33, 37].
On this basis, only the Hertz-Mindlin (no slip) [38-40] contact model is applied, where the normal
contact force is calculated from the Hertz theory [39] and the tangential component from Mindlin
model [40]. The details of these models are available elsewhere [41-43].
Particle shape can be accounted by different approaches, namely clumped spheres and
rolling friction. For the clumped spheres approach, the shape is generated by clumping spheres
together in a way that the relative positions of the spheres are maintained constant throughout
6
diameters, but the total envelope volume as well as the position of the centre of gravity of the
clumped spheres are the same as those of the original particle shape. For the rolling friction
approach, particles are all spheres having a resisting torque against their relative free rolling
[31]. The rolling friction coefficient defines how much the particles are prevented from free
rolling.
2.3 Mechanical and physical properties characterisation
One important part of DEM modelling is to set appropriate physical and mechanical
properties for the simulation. In this work efforts have been made to characterise the physical
and mechanical parameters as much as possible, as described below.
2.3.1 Restitution coefficient
The coefficient of restitution, CoR, is an important input parameter used in DEM to account
for damping of energy of oscillations. In case of collision of objects CoR is the ratio of the
rebound relative velocity to the impact velocity. Its value depends upon many factors, such as
particle size, material type, internal structure, surface adhesion, speed of collisions, etc. In this
study, the CoR of each type of particles against a wall made of Perspex is measured by using a
high speed camera and image analysis. A particle is selected randomly and then released from
a certain height. The incident and rebound velocities are then determined by image analysis
from which the CoR is calculated. This procedure is repeated 12 times and the average of the
CoR is selected as the final value. The results are presented in Table 1 together with other
properties. Determining CoR of particle-particle collisions is more difficult, as efforts are required
to align the particles for collisions and due to particle roughness, a wide spread in the measured
values are expected. Considering that for the particles used in this system the values of CoR for
7
2.3.2 Sliding friction
For non-spherical particles with asperities/surface roughness, the characterisation of the
coefficient of sliding inter-particle friction, CoF, is difficult and subject to large variations. We
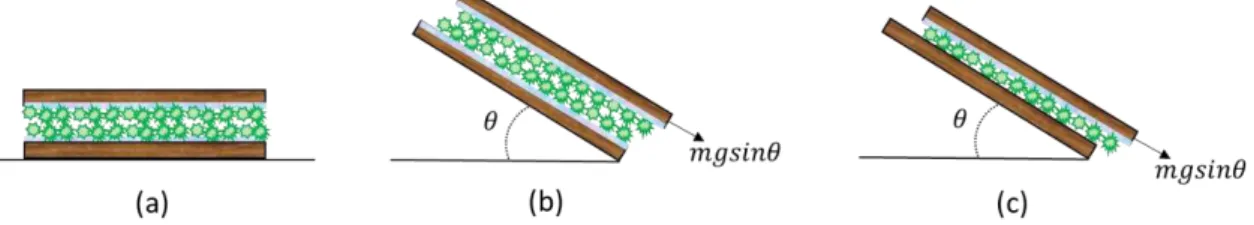
follow an approach in which a simple sliding process of two layers of particles adhered to a
plane is simulated by DEM and compared against the experiment. To find the particle-particle
CoF, two flat plates are covered by monolayers of particles and are placed on each other as
shown in Fig. 3 (a). Then they are tilted together until the upper surface slides and the angle at
which the sliding occurs is measured (Fig. 3 (b)). The same process is simulated in DEM using
surfaces covered by monolayers of clumped spheres. The surfaces are placed on top of each
other and then tilted together. The sliding angle is then compared with the experiment and the
CoF is tuned to predict and match the observed sliding angle of the plates.
To measure the CoF of the particles against the wall, a monolayer of the particles is glued
to a flat plate and placed over a plain surface made from Perspex. When the surfaces are tilted,
at a certain angle (Fig. 3 (c)), the upper surface, with the particles glued on, starts to slide. The
tangent of this angle is taken as the coefficient of sliding friction between particles and wall.
Fig. 3. Schematic diagram for measuring the coefficient of sliding friction. Graph (a) shows the
surfaces at rest, graph (b) shows the particle-particle sliding friction experiment, and graph (c)
depicts the particle-wall sliding experiment.
8
Material TAED BP wall
Sieve-cut size ( m) 850-1000 850-1000 - Density (kg/m3) 1000 1000 1190
Shear modulus (MPa) 10 10 100
Poisson’s ratio 0.25 0.25 0.25
CoR (BP-Particle/wall) 0.30 0.20 0.28 CoR (TAED-Particle/wall) 0.32 0.30 0.32
CoF (BP-particle/wall) 0.69 0.62 0.42 CoF (TAED-particle/wall) 0.76 0.69 0.36
CRF 0.01 0.01 0.01
2.4 Characterisation and modelling of particle shape
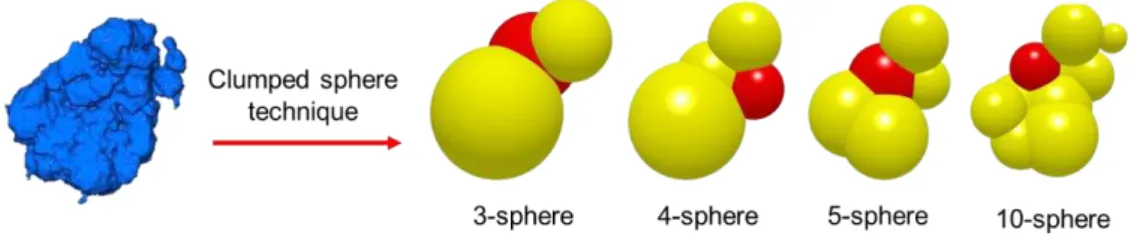
Due to irregularity of BP and TAED particle shape, the X-ray Tomography (XRT) technique
is used to capture the 3D images of particles. Particles from each material are randomly
selected and scanned using the Phoenix Nanotom XMT machine at the University of Leeds. The
3D images are then post-processed using the Avizo 3D software, where the 2D X-ray images
from different layers of the particle are composed to construct the 3D geometry as shown in Fig.
4. This geometry is then imported into the Automatic Sphere-clump Generator (ASG) software
[44], where the clumped spheres are generated based on the obtained particle shape. The
generated particle shape can include different numbers of spheres clumped together as shown
in Fig. 4. To have a better representation of the real shape a large number of small spheres are
needed; however using them in the simulation leads to more computational effort, due to the
increase in the number of elements and shorter computational time steps required for smaller
particles. Therefore some optimisation of the size and number of clumped spheres is necessary
9
arrangement of clumped spheres, as shown in Fig. 4, has been evaluated considering the same
volume and centre of mass as of the real particle.
Fig. 4. The non-spherical TAED particle shape representation by increasing the number of spheres
(TAED particles’ size range: 850-1000 m).
Clumped sphere approach
To assess the sensitivity of simulation results to the number of spheres used in each
clump, the angle of repose of the representative particles is simulated and benchmarked against
the experiments. In this study, one particle shape is selected for each species representing the
typical shapes of the particles. Also, the effect of rolling friction is minimised by keeping the
values of the coefficient of rolling friction constant at 0.01 for all the simulations.
As an example, the repose angle of TAED particles with 5-sphere clumps is depicted in
Fig. 5. The optimum sphere number for shape modelling of each type of powder is then
determined from the aforementioned sensitivity analysis (Fig. 6). Using 5-clumped sphere
particles in the modelling, the angle of repose obtained from the simulation is 36.2°±0.5°, which
is very close to the 36.0°±1° from the experimental result of TAED particles. Hence the
5-clumped sphere shape is selected for shape representation since it has enough accuracy with
lower computational cost compared to the 10-sphere system. The same analysis has been
carried out for BP particles, where the minimum number of spheres required to match the
experimental angle of repose is also 5 (Fig. 6). Nevertheless, the 8-sphere clump was used for
the BP particles in this study due to the presence of a very small sphere in 5-sphere clump,
10
Fig. 5. DEM simulation of a TAED particle heap using 5-sphere clump model. (Particle size range:
850-1000 m).
Fig. 6. The effect of number of spheres in the clumped-spheres model on the heap repose angle
The general details and specifications of the modelling and particle shapes used in the
simulations are listed in Table 2.
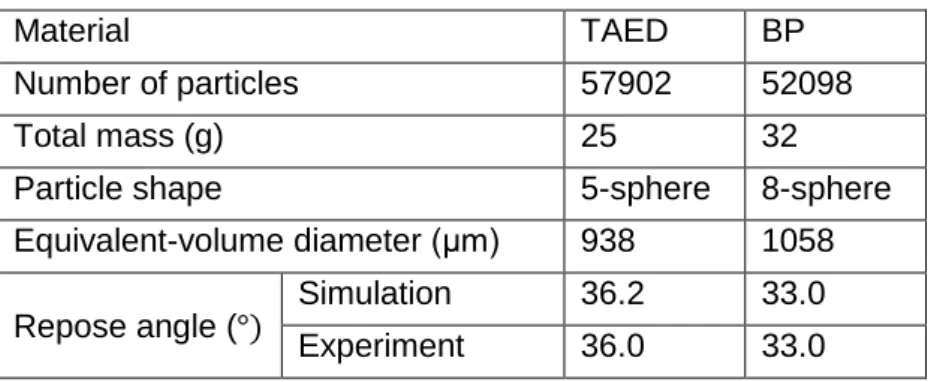
Table 2: Specifications of the modelling and particle shape.
Material TAED BP
Number of particles 57902 52098
Total mass (g) 25 32
Particle shape 5-sphere 8-sphere Equivalent-volume diameter ( m) 938 1058
Repose angle (°)
11
Rolling friction approach
The use of rolling friction coefficient to account for the effect of particle shape has been
reported previously [31, 45]; however, its applicability for modelling the segregation has not
been addressed so far. A series of simulations are carried out by investigating the role of rolling
friction on the angle of repose, comparing and matching with the experimental data. The
volume-equivalent diameter of the particles, , is used for these simulations as given in Table
2. The process of heap formation of particles is simulated for low (0.01), medium (0.05), and
high (0.10) values of coefficient of rolling friction as shown in Fig. 7. The calibrated value of
rolling friction coefficient is determined using the trend line obtained from the graph. This helps
to estimate the value for the coefficient of rolling friction after which another simulation is carried
out to ensure that this rolling friction coefficient does give the desired angle of repose. The
values for calibrated coefficient of rolling friction are given in Table 3.
Fig. 7. The procedure of calibrating the spheres rolling friction against the angle of repose.
Table 3: Calibrated coefficient of rolling friction for the spherical particles.
Material TAED BP Wall (Perspex) BP 0.073 0.064 0.064
12
2.5 Segregation analysis
For quantification of the extent of segregation image analysis is used in this work. When
the particles are distinguishable by their colours, as is the case here, image analysis is a fast
technique as it is easy to apply and less expensive compared to the other techniques [1].
Another advantage of image analysis is that it can be used for both experiment and numerical
simulation, allowing a consistent comparison between the results.
Indices to quantify segregation are the same as those used to quantify the degree of
mixing within a mixture. There are various segregation indices available most of which are
based on variance [46-52]. In the current study, both the segregation pattern (particles
concentration distribution) as well as the segregation intensity are significant. The first one is
obtained by calculating the concentration of each species in different positions and the latter
from the normalised variation of the particles concentration known as the coefficient of variation
(CoV). This is also known as the Relative Standard Deviation (RSD) and is one of the mixing
indices used extensively to describe the extent of segregation [52-54]. Also the lowest possible
CoV for this system in randomly mixed mode is calculated to compare with the segregated
system.
2.5.1 Quantifying segregation using image analysis
Heap formation of a binary mixture of BP and TAED particles is simulated using the
physical and mechanical properties given in Tables 1-3, and the clumped spheres and rolling
friction approaches are compared. The particles are generated in the funnel and then released
into the test box to make the heap (Fig. 1). As shown in Fig. 2, BP and TAED particles are in
different colours, which allow for detecting their positions in the binary mixture by image
13
To find the segregation extent, an image is taken from the front view of the heap which is
then divided into several square bins as shown in Fig. 8. The image analysis method developed
by Pasha et al. [55] is used here. The number of pixels of each constituent in each bin is
calculated by which their pixels number concentrations are determined. The CoV of these pixel
concentrations is then calculated for the whole heap. The effect of bin size on CoV of the
constituents is also assessed by using different numbers of bins in the analysis. As expected,
larger bins give smaller CoV; however based on the case under study and its application, bin
size should be neither too large nor too small. In this study, the bins are squares with 10 mm
sides, selected to be roughly 10 times wider than the size of one particle. CoV values normally
range from zero to one, meaning no segregation (an ideal and totally mixed case) for values
close to zero and highly segregated system for one and greater (Equation 1). This approach is
applied to both experimental as well as simulated heaps.
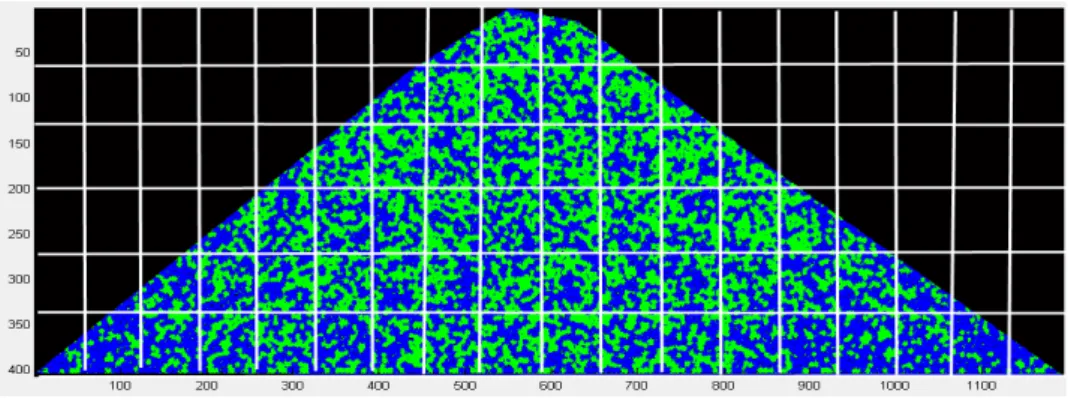
Fig. 8. A heap image, processed in MATLAB and divided into square bins, ready for image
analysis. After indexing, BP and TAED particles are shown by blue and green colours,
respectively.
The pixel number fraction for each constituent per bin, , is given by Equation 1:
14
where is the number of pixels of the constituent i in the bin number k, with m being the
total number of bins. The mean value, standard deviation, and coefficient of variation are given
by Equations 2-4.
(2)
(3)
(4)
2.5.2 Quantifying segregation based on particles number
Another method for quantifying the segregation, which is only applicable to simulation, is
to count the particles number in each bin of the mixture. In this method the heap is discretised
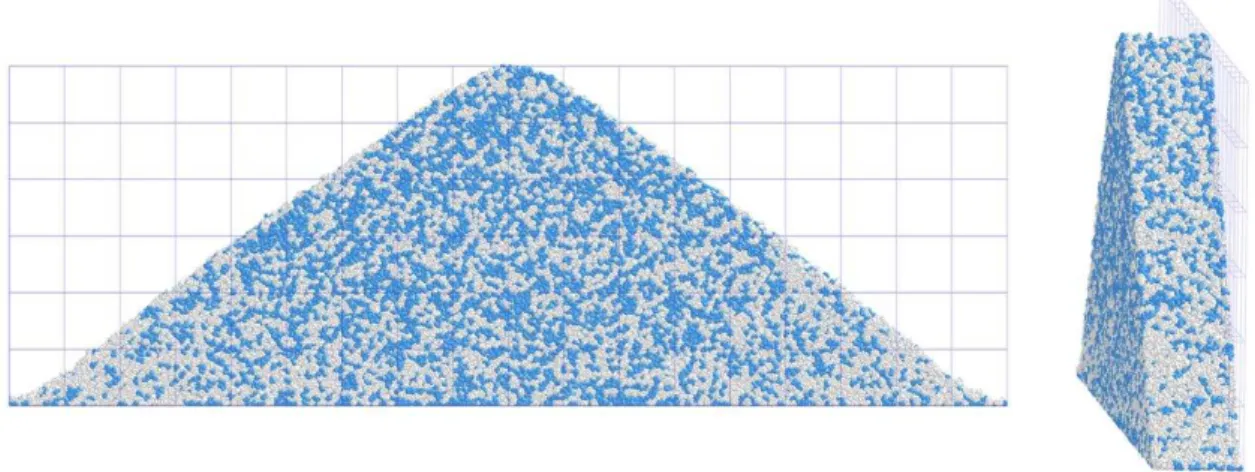
three-dimensionally into a number of bins (Fig. 9) in which the particle number fractions for
species are calculated and their CoV for the entire heap is then obtained. A major advantage of
this method is the ability to observe the segregation across the depth of the heap, i.e. the whole
heap can be analysed three-dimensionally by DEM; while by image analysis only the
15
Fig. 9. The discretisation of the heap into bins in three dimensions to be used for measuring the
coefficient of variation.
Calculating the CoV of the mixture components in randomly mixed system provides a
suitable reference for comparison. To do so a random generator number is used in the Excel
software to obtain random particle number fractions for each bin with regards to the mean value
of 0.5 and the lower limit of standard deviation (randomly mixed) using Equation 5 [52, 56].
P P (5)
P is the probability of species and N is the total number of particles in the bin. The standard
deviation of each bin is calculated separately as the number of the particles in the bins (e.g.
corners and edges) are different, which affects the variability of the randomised mixture. After
the random particle number fractions are generated for all the bins, the CoV of these fractions is
calculated 100 times (with new random fractions) and the average is obtained.
Results
16
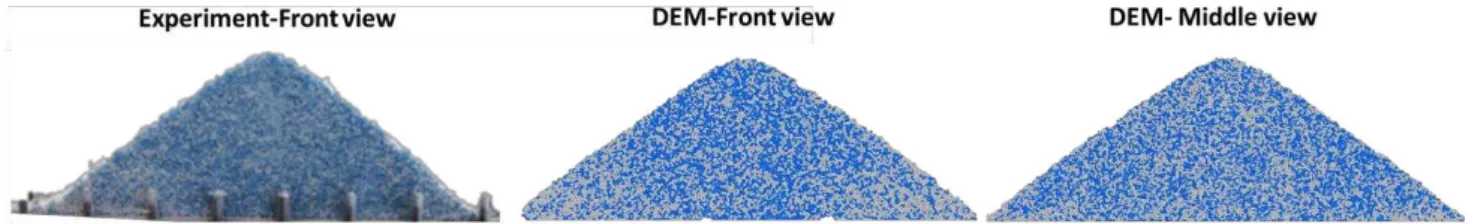
The process of heap formation of a binary mixture of BP and TAED is simulated using
clumped sphere approach as shown earlier. A visual comparison between the results from the
front view of the heap in experiment and the front and mid-plane views in DEM modelling is
given in Fig. 10. Although the particle sizes of both species are in the same range, BP particles
still show segregation near the corners of the heap at the front wall which might be due to the
difference in shape or surface properties of the particles.
Fig. 10. Heap formation of binary mixture of the BP (beige/weight colour) and TAED (blue colour),
for experiment and DEM modelling. (The photo of the experimental case shows a number of pins
holding the front wall and are not within the bed.)
For analysing the experimental data, only the image analysis technique is used, while for
the simulation results, both methods of image analysis (CLUMPED-Front view) and counting
particle number (CLUMPED-Front layer), as described previously, are employed. For the latter,
thin layers, having 2 mm width (2 times wider than the particles), from the front side and middle
of the heap are selected, as shown in Fig. 11, and the particles are counted in each bin in these
domains. Then the particles number fraction of the species at each bin ( ) for the front and
middle layers of the heap are calculated and the values are depicted in format of contours to
17
Fig. 11. A thin layer from the front side of the heap is selected and discretised.
As depicted in Fig. 12, the BP particles distribution at the front layer of the heap is clearly
different from that of the middle layer. For the front layer, segregation of the BP particles is
clearly visible in the corners of the heap, whereas for the middle layer, the particles are well
mixed throughout the whole heap. The concentration map of the TAED particles has also the
same visual pattern as of the BP; the only difference is that for the front layer, the corners have
lower concentration values as the summation of in each bin must be one. The central region,
18
Fig. 12. Particles number concentration map of the PB particles for the front and middle layers of
the heap (DEM simulation-clumped spheres approach).
19
Fig. 13. A reasonable agreement between the experimental and numerical results is
observable for both BP and TAED particles. The CoV of the BP particles is less than that of the
TAED for both the experimental case and when the front view is analysed (i.e. CLUMPED-Front
view). In contrast, the CoV obtained from the method of counting the particle number (i.e.
CLUMPED-Front layer) is close for both species. The slight difference between the CoVs of the
BP and TAED particles, observed in the image analysis method, is likely due to considering the
projected area of the particles rather than the particles number. When 2D imaging is used to
analyse the segregation, particles presentation on the screen is dependent on their packing
style on the wall influenced by the particles aspect ratio, asperity, and surface roughness. This
will lead to differences in the mean values of the colour pixels concentration on the wall and
finally the value of the CoV for each species will be different. It is also likely that the use of a thin
layer in the segregation analysis dilutes what is shown for the segregation tendency on the front
0
0.05
0.1
0.15
0.2
0.25
0.3
0.35
0.4
0.45
Experiment-Front view
CLUMPED-Front view
CLUMPED-Front layer
CLUMPED-Middle layer
C
o
V
BP
TAED
Image analysis method Counting the particle
20
surface. This fact is observed in both experiment and DEM simulation, which shows that the
simulation has been able to capture this effect.
It is also observed that the CoV of the middle layer of the heap is much lower than the
CoV of the front layer (nearly half). As observed in Fig. 12 as well, particles have a very
well-distribution in the middle of the heap in contrast to the front. In so far as the segregation in the
heap front is concerned simulation with clumped sphere can reliably predict the extent of
segregation.
Fig. 13. CoV of BP and TAED particles obtained from experiments and clumped sphere approach
using image analysis of the front view of the heap (CLUMPED-Front view) and counting particle
number for the front layer (CLUMPED-Front layer) and the middle layer (CLUMPED-Middle layer).
3.2 Simulation of segregation using rolling friction approach
0
0.05
0.1
0.15
0.2
0.25
0.3
0.35
0.4
0.45
Experiment-Front view
CLUMPED-Front view
CLUMPED-Front layer
CLUMPED-Middle layer
C
o
V
BP
TAED
Image analysis method Counting the particle
21
The rolling friction approach is used here to simulate the process of heap formation.
Similar to the case of clumped-spheres the CoV of the particles obtained from the simulations
using the rolling friction approach is analysed by image analysis and particle number methods.
The results are shown in Fig. 14 and compared with the experimental data. Clearly the rolling
friction approach underestimates the segregation tendency. ROLLING-Front view and
ROLLING-Front layer results show the front of the heap analysed by the image analysis and
counting particle number methods, respectively. ROLLING-Middle layer results show the
condition in the middle of the heap based on counting the number of particles.
Fig. 14. CoV of BP and TAED particles obtained from experiments and rolling friction approach
using image analysis at the front view of the heap (ROLLING-Front view), counting particle
number for the front layer (ROLLING-Front layer) and the middle layer (ROLLING-Middle layer).
0
0.05
0.1
0.15
0.2
0.25
0.3
0.35
0.4
0.45
Experiment-Front view
ROLLING-Front view
ROLLING-Front layer
ROLLING-Middle layer
C
o
V
BP
TAED
Image analysis method Counting the particle
22
The segregation index for the mid-layer of the heap is much lower than that of the front
layer. This is also clear from the particle number concentration map of the heap, shown in Fig.
15, where an extent of variation in concentration of BP particles is observable in the front layer
of the heap. In contrast, the particles distribution in the middle of the heap is quite uniform. This
difference between the particles distribution in the middle and front layers of the heap is likely
due to the effect of particles shape at the wall. In fact wall and free surfaces facilitate the
segregation by reducing the level of constraints imposed on the particles and hence the particles
easily can rotate and segregate. This is not the case when the particles are subject to an
interconnected mesh of particles restricting their movement, similar to what happens in the
middle of the heap.
Fig. 15. BP particles (white) number concentration map for the front and middle layers of the heap
(rolling friction approach).
Comparing Fig. 15 with the results obtained from the clumped sphere approach (Fig. 12),
23
The average values of the CoV for a randomly mixed system is calculated to be 0.14,
0.15, and 0.19 for the CLUMPED-front layer, ROLLING-front layer, and CLUMPED-front view
cases. These numbers are between the CoV values of the front and middle layers showing that
the middle layer is well mixed while the front layer has segregation. Also, the CoV values
obtained by the rolling friction approach are some 35% lower than those of the experiments. The
fact that the clumped sphere approach is predictive, while the rolling friction approach is not,
most likely stems from the effect of particle-particle mechanical interlocking as well as the
particles different aspect ratios and moment of inertia, which only happens in the real system
and the clumped sphere approach. This can be observed clearly from a close-up images of the
particles at the front view of the heap as shown in Fig. 16. Different shapes give different
behaviours during the packing and an extra effect of the bed dilation during the particles rotation
[57]. The difference observed between the arrangements of particles in these two approaches
shows that the effect of particle shape is not limited to the rolling mechanism of the particles,
rather it affects the particles contacts in a more complex network.
Fig. 16. Arrangements of the BP (white) and TAED (blue) particles at the heap front, simulated by
24
Conclusions
The segregation of a binary powder mixture during the heap formation is modelled
numerically using the DEM method. Two main ingredients of washing powders, namely BP and
TAED are used as model test materials. Clumped spheres and rolling friction approaches are
utilised for modelling the particles segregation and the results are compared with the
experiment. It is observed that particles repose angle is highly dependent on the particle shape
and there is a minimum number of spheres which gives adequate comparison, after which not
much improvement is obtained. The results obtained from DEM simulations show that the
clumped sphere approach is a predictive tool for simulating the segregation during the heap
formation. In contrast, the rolling friction approach underestimates the segregation tendency
even when it is tuned to predict the repose angle. It is also observed that the middle and front
layers of the heap give two different predictions of the segregation tendency. Thus the particles
distribution pattern at the front view of the heap is not well representative of the condition of the
whole mixture.
Calibrated rolling friction as a substitute for particle shape is not an accurate
approximation of irregular particles for the simulation of segregation behaviour, even for a
system which is not much prone to segregation. This situation becomes exacerbated when
segregation due to size difference becomes more extensive, as will be reported in future works.
Acknowledgments:
This work is part of Chariot, funded by the UK government’s Advanced Manufacturing
Supply Chain Initiative (AMSCI) [grant number 31587, 233189]. The authors are also grateful to
25
References
[1] A.-N. Huang, H.-P. Kuo, Developments in the tools for the investigation of mixing in particulate systems – A review, Adv Powder Technol, 25 (2014) 163-173.
[2] J. Ottino, D. Khakhar, Mixing and segregation of granular materials, Annu Rev Fluid Mech, 32 (2000) 55-91.
[3] A. Shimoska, I. Nousou, Y. Shirakawa, J. Hidaka, Effect of Particle Shape on Size Segregation of Particles, Chem Engineer Trans, 32 (2013) 2143-2148.
[4] A. Shimosaka, Y. Shirakawa, J. Hidaka, Effects of Particle Shape and Size Distribution on Size Segregation of Particles, J Chem Eng Jpn, 46 (2013) 187-195.
[5] J.M. Ottino, D.V. Khakhar, Mixing and segregation of granular materials, Annu Rev Fluid Mech, 32 (2000) 55-91.
[6] A. Dziugys, R. Navakas, The role of friction in mixing and segregation of granular material, Granul Matter, 11 (2009) 403-416.
[7] A. Hassanpour, M. Eggert, M. Ghadiri, Analysis of segregation of binary mixtures of particulate solids due to size, density and cohesion, The 6th International Conference on Micro-mechanics of Granular Media, Powders and Grains 2009Golden Colorado, USA, 2009, pp. 687-690.
[8] K.A. Gillemot, E. Somfai, T. Borzsonyi, Shear-driven segregation of dry granular materials with different friction coefficients, Soft Matter, 13 (2017) 415-420.
[9] S. Yu, Y. Guo, C.Y. Wu, DEM/CFD modelling of the deposition of dilute granular systems in a vertical container, Chinese Sci Bull, 54 (2009) 4318-4326.
[10] S.K. Hajra, D. Shi, J.J. McCarthy, Granular mixing and segregation in zigzag chute flow, Phys Rev E, 86 (2012) 061318.
[11] D. Brone, F.J. Muzzio, Size segregation in vibrated granular systems: A reversible process, Phys Rev E, 56 (1997) 1059-1063.
[12] C.M. Dury, R. Knecht, G.H. Ristow, Size segregation of granular materials in a 3D rotating drum, High-Performance Computing and Networking, 1401 (1998) 860-862.
[13] A. Dziugys, R. Navakas, The role of friction on size segregation of granular material, Mechanika, (2007) 59-68.
[14] L.B.H. May, L.A. Golick, K.C. Phillips, M. Shearer, K.E. Daniels, Shear-driven size segregation of granular materials: Modeling and experiment, Phys Rev E, 81 (2010). [15] Y. Guo, C.Y. Wu, C. Thornton, The effects of air and particle density difference on segregation of powder mixtures during die filling, Chem Eng Sci, 66 (2011) 661-673.
[16] E.W.C. Lim, Density Segregation of Binary Granular Mixtures in Bumpy Vibrated Beds, Cbee 2009: Proceedings of the 2009 International Conference on Chemical, Biological and Environmental Engineering, (2010) 8-12.
[17] E.W.C. Lim, Density Segregation in Vibrated Granular Beds with Bumpy Surfaces, Aiche J, 56 (2010) 2588-2597.
[18] Y. Fan, K.V. Jacob, B. Freireich, R.M. Lueptow, Segregation of granular materials in bounded heap flow: A review, Powder Technol, 312 (2017) 67-88.
26
[20] P. Tang, V.M. Puri, Segregation quantification of two-component particulate mixtures: Effect of particle size, density, shape, and surface texture, Particul Sci Technol, 25 (2007) 571-588.
[21] R. Moreno-Atanasio, R.A. Williams, X. Jia, Combining X-ray microtomography with computer simulation for analysis of granular and porous materials, Particuology, 8 (2010) 81-99.
[22] R. Escudié, N. Epstein, J.R. Grace, H.T. Bi, Effect of particle shape on liquid-fluidized beds of binary (and ternary) solids mixtures: segregation vs. mixing, Chemical Engineering Science, 61 (2006) 1528-1539.
[23] Y. Fan, C.P. Schlick, P.B. Umbanhowar, J.M. Ottino, R.M. Lueptow, Modelling size segregation of granular materials: the roles of segregation, advection and diffusion, J Fluid Mech, 741 (2014) 252-279.
[24] J.M.N.T. Gray, C. Ancey, Multi-component particle-size segregation in shallow granular avalanches, J Fluid Mech, 678 (2011) 535-588.
[25] M.B. Hu, Q.S. Wu, R. Jiang, Size segregation in a vibrated tilted compartmentalized granular chamber, Chinese Phys Lett, 20 (2003) 1091-1093.
[26] D. Mateo-Ortiz, F.J. Muzzio, R. Mendez, Particle size segregation promoted by powder flow in confined space: The die filling process case, Powder Technol, 262 (2014) 215-222. [27] A. Rosato, K.J. Strandburg, F. Prinz, R.H. Swendsen, Why the Brazil nuts are on top: Size segregation of particulate matter by shaking, Phys Rev Lett, 58 (1987) 1038-1040.
[28] A. Thornton, T. Weinhart, S. Luding, O. Bokhove, Modeling of Particle Size Segregation: Calibration Using the Discrete Particle Method, Int J Mod Phys C, 23 (2012).
[29] S.L. Wu, M.Y. Kou, J. Xu, X.Y. Guo, K.P. Du, W. Shen, J. Sun, DEM simulation of particle size segregation behavior during charging into and discharging from a Paul-Wurth type hopper, Chem Eng Sci, 99 (2013) 314-323.
[30] G. Lu, J.R. Third, C.R. Müller, Discrete element models for non-spherical particle systems: From theoretical developments to applications, Chem Eng Sci, 127 (2015) 425-465.
[31] C.M. Wensrich, A. Katterfeld, Rolling friction as a technique for modelling particle shape in DEM, Powder Technol, 217 (2012) 409-417.
[32] C. Goniva, C. Kloss, N.G. Deen, J.A.M. Kuipers, S. Pirker, Influence of rolling friction on single spout fluidized bed simulation, Particuology, 10 (2012) 582-591.
[33] M.A. Behjani, N. Rahmanian, N. Fardina bt Abdul Ghani, A. Hassanpour, An investigation on process of seeded granulation in a continuous drum granulator using DEM, Adv Powder Technol.
[34] M. Combarros, H.J. Feise, H. Zetzener, A. Kwade, Segregation of particulate solids: Experiments and DEM simulations, Particuology, 12 (2014) 25-32.
[35] J.F. Favier, M.H. Abbaspour-Fard, M. Kremmer, A.O. Raji, Shape representation of axi-symmetrical, non-spherical particles in discrete element simulation using multi-element model particles, Engineering Computations (Swansea, Wales), 16 (1999) 467-480.
[36] M. Pasha, C. Hare, M. Ghadiri, A. Gunadi, P.M. Piccione, Effect of particle shape on flow in discrete element method simulation of a rotary batch seed coater, Powder Technol, 296 (2016) 29-36.
[37] W.H. Hager, Wilfrid Noel Bond and the Bond number, J Hydraul Res, 50 (2012) 3-9. [38] K.L. Johnson, K. Kendall, A.D. Roberts, Surface Energy and the Contact of Elastic Solids, Proceedings of the Royal Society of London A: Mathematical, Physical and Engineering Sciences, 324 (1971) 301-313.
27
[40] H. Deresiewicz, R.D. Mindlin, U. Columbia, E. Department of Civil, Elastic spheres in contact under varying oblique forces, 1952.
[41] A. Di Renzo, F.P. Di Maio, Comparison of contact-force models for the simulation of collisions in DEM-based granular flow codes, Chemical Engineering Science, 59 (2004) 525-541.
[42] M.M. Martín, Introduction to software for chemical engineers, CRC Press2014.
[43] C. Thornton, Granular Dynamics, Contact Mechanics and Particle System Simulations, Springer2015.
[44] M. Price, V. Murariu, G. Morrison, Sphere clump generation and trajectory comparison for real particles, Proceedings of Discrete Element Modelling 2007, (2007).
[45] J. Ai, J.-F. Chen, J.M. Rotter, J.Y. Ooi, Assessment of rolling resistance models in discrete element simulations, Powder Technol, 206 (2011) 269-282.
[46] L.T. Fan, R.H. Wang, On mixing indices, Powder Technol, 11 (1975) 27-32.
[47] D.K. Rollins, D.L. Faust, D.L. Jabas, A superior approach to indices in determining mixture segregation, Powder Technol, 84 (1995) 277-282.
[48] R. Hogg, Characterization of relative homogeneity in particulate mixtures, Int J Miner Process, 72 (2003) 477-487.
[49] S.-H. Chou, Y.-L. Song, S.-S. Hsiau, A Study of the Mixing Index in Solid Particles, Kona Powder Part J, (2016) 2017018.
[50] B.N. Asmar, P.A. Langston, A.J. Matchett, A generalised mixing index in distinct element method simulation of vibrated particulate beds, Granul Matter, 4 (2002) 129-138.
[51] G.R. Chandratilleke, A.B. Yu, J. Bridgwater, K. Shinohara, A particle-scale index in the quantification of mixing of particles, Aiche J, 58 (2012) 1099-1118.
[52] P.M.C. Lacey, The mixing of solid particles, Chemical Engineering Research and Design, 75 (1997) S49-S55.
[53] A. Kukukova, J. Aubin, S.M. Kresta, A new definition of mixing and segregation: Three dimensions of a key process variable, Chemical Engineering Research and Design, 87 (2009) 633-647.
[54] A. Kukuková, B. Noël, S.M. Kresta, J. Aubin, Impact of sampling method and scale on the measurement of mixing and the coefficient of variance, Aiche J, 54 (2008) 3068-3083.
[55] M. Pasha, Segregation image analysis by MATLAB code Personal communication, 2016. [56] M.J. Rhodes, Introduction to particle technology, John Wiley & Sons2008.
[57] L.B. May, L.A. Golick, K.C. Phillips, M. Shearer, K.E. Daniels, Shear-driven size
28
Table captions
Table 1: Physical properties of BP and TAED particles used in DEM simulations.
Table 2: Specifications of the modelling and particle shape.
Table 3: Calibrated coefficient of rolling friction for the spherical particles.
Figure captions
Fig. 1. Geometry utilised in DEM simulations based on the geometry of the experimental
set up.
Fig. 2. Typical shapes of (a) BP (white) and (b) TAED (blue) particles sieved between 850
and 1000 m.
Fig. 3. Schematic diagram for measuring the coefficient of sliding friction. Graph (a) shows
the surfaces at rest, graph (b) shows the particle-particle sliding friction experiment, and graph
(c) depicts the particle-wall sliding experiment.
Fig. 4. The non-spherical TAED particle shape representation by increasing the number of
spheres (TAED particles’ size range: 850-1000 m).
Fig. 5. DEM simulation of a TAED particle heap using 5-sphere clump model. (Particle size
range: 850-1000 m).
Fig. 6. The effect of number of spheres in the clumped-spheres model on the heap repose
angle
29
Fig. 8. A heap image, processed in MATLAB and divided into square bins, ready for image
analysis. After indexing, BP and TAED particles are shown by blue and green colours,
respectively.
Fig. 9. The discretisation of the heap into bins in three dimensions to be used for
measuring the coefficient of variation.
Fig. 10. Heap formation of binary mixture of the BP (beige/weight colour) and TAED (blue
colour), for experiment and DEM modelling. (The photo of the experimental case shows a
number of pins holding the front wall and are not within the bed.)
Fig. 11. A thin layer from the front side of the heap is selected and discretised.
Fig. 12. Particles number concentration map of the PB particles for the front and middle
layers of the heap (DEM simulation-clumped spheres approach).
Fig. 13. CoV of BP and TAED particles obtained from experiments and clumped sphere
approach using image analysis at the front view of the heap (CLUMPED-Front view), counting
particle number for the front layer Front layer) and the middle layer
(CLUMPED-Middle layer).
Fig. 14. CoV of BP and TAED particles obtained from experiments and rolling friction
approach using image analysis at the front view of the heap (ROLLING-Front view), counting
particle number for the front layer Front layer) and the middle layer
(ROLLING-Middle layer).
Fig. 15. BP particles (white) number concentration map for the front and middle layers of
the heap (rolling friction approach).
Fig. 16. Arrangements of the BP (white) and TAED (blue) particles at the heap front,