This is a repository copy of Short bursts of cyclic mechanical compression modulate tissue
formation in a 3D hybrid scaffold.
White Rose Research Online URL for this paper:
http://eprints.whiterose.ac.uk/114887/
Version: Accepted Version
Article:
Brunelli, M., Perrault, C.M. and Lacroix, D. (2017) Short bursts of cyclic mechanical
compression modulate tissue formation in a 3D hybrid scaffold. Journal of the Mechanical
Behavior of Biomedical Materials, 71. pp. 165-174. ISSN 1751-6161
https://doi.org/10.1016/j.jmbbm.2017.03.008
Article available under the terms of the CC-BY-NC-ND licence
(https://creativecommons.org/licenses/by-nc-nd/4.0/)
[email protected] https://eprints.whiterose.ac.uk/
Reuse
This article is distributed under the terms of the Creative Commons Attribution-NonCommercial-NoDerivs (CC BY-NC-ND) licence. This licence only allows you to download this work and share it with others as long as you credit the authors, but you can’t change the article in any way or use it commercially. More
information and the full terms of the licence here: https://creativecommons.org/licenses/
Takedown
If you consider content in White Rose Research Online to be in breach of UK law, please notify us by
Author’s Accepted Manuscript
Short bursts of cyclic mechanical compression
modulate tissue formation in a 3D hybrid scaffold
M. Brunelli, C.M. Perrault, D. Lacroix
PII:
S1751-6161(17)30113-3
DOI:
http://dx.doi.org/10.1016/j.jmbbm.2017.03.008
Reference:
JMBBM2261
To appear in:
Journal of the Mechanical Behavior of Biomedical Materials
Received date: 27 November 2016
Revised date:
7 March 2017
Accepted date: 8 March 2017
Cite this article as: M. Brunelli, C.M. Perrault and D. Lacroix, Short bursts of
cyclic mechanical compression modulate tissue formation in a 3D hybrid
scaffold,
Journal of the Mechanical Behavior of Biomedical Materials,
http://dx.doi.org/10.1016/j.jmbbm.2017.03.008
This is a PDF file of an unedited manuscript that has been accepted for
publication. As a service to our customers we are providing this early version of
the manuscript. The manuscript will undergo copyediting, typesetting, and
review of the resulting galley proof before it is published in its final citable form.
Please note that during the production process errors may be discovered which
could affect the content, and all legal disclaimers that apply to the journal pertain.
Short bursts of cyclic mechanical
compression modulate tissue formation
in a 3D hybrid scaffold
M. Brunelli1, C.M. Perrault2, D. Lacroix2*
1
EMPA, Swiss Federal Laboratories for Materials Science and Technology, Lerchenfeldstrasse 5, 9014 St. Gallen, Switzerland
2
INSIGNEO Institute for in silico medicine, Department of Mechanical Engineering, University of Sheffield, UK
*
Corresponding author. Damien Lacroix Department of Mechanical Engineering F32, Pam Liversidge Mappin Street Sheffield S1 3JD Tel.: +44(0)114 2220156;
ABSTRACT
approach using mechanical stimulation in the development of engineered in vitro tissue as replacement for large bone fractures.
1
Introduction
In early studies the effect of mechanical forces on cell response was mainly investigated on 2D substrates [1] [4], the geometry of which was not a good representation of the 3D architecture of biological tissues. The increasing demand for a structure that matched the architecture and chemistry of injured sites led to the development of 3D scaffolds [5]. Among those, hydrogels were shown to enhance cell survival and provide a tissue-like environment for cell growth and differentiation [6]. Moreover, they offered a compact matrix, often made of proteins, which guaranteed uniformity of stresses when mechanical forces were applied. However, the application of such scaffolds are limited by their soft matrix, preventing their use when they are required to bear high stresses [7], such as those acting on bone. As a consequence, the focus moved toward the use of 3D polymeric structures able to bear mechanical loading [8], [9]. Scaffolds made by polymerization of polylactic acid, polyglycolic acid or polycaprolactone (PCL) were widely investigated because they are easy to shape through high-temperature processes, allowing the fabrication of highly reproducible fibrous structures [10]. Despite their remarkable resistance to forces, 3D polymeric scaffolds are not a good reproduction of the mechanical environment found in tissue. Indeed, the stresses felt by cells following the compression of such structures are limited to the 2D surface of cellular adhesion. In order to increase the three dimensionality of the constructs and obtain a more realistic reproduction of the in vivo environment, we propose a new hybrid scaffold composed of stiff 3D PCL and a soft collagen matrix with the aim of providing a uniform distribution of stresses surrounding cultured cells.
2
Materials and methods
2.1
Mechanical relaxation of PCL
3D Insert PCL scaffolds (Biotek, USA) were initially mechanically relaxed at 37°C by applying a 8% strain compressive ramp calculated over the height of the sample. Any stress from the structure was removed by maintaining a constant displacement for 180 min [22].
2.2
Scaffold sterilization and hES-MPs seeding
The surface of the scaffolds was activated by applying air plasma treatment (Diener, Germany) for 5 minutes at 30 W and 1 mBar. Samples were then sterilized by alternating a washing process involving 70% ethanol and PBS three times. Eventually, samples were let to dry for 30 minutes under a biological hood and seeded with human embryonic stem cell-derived mesodermal progenitors (hES-MPs). Bovine collagen type 1 (Gibco, UK) was diluted to a concentration of 2 mg/ml with 0.1M NaOH, 1% PBS and -mem culture media (SLS, UK) supplemented with 10% FBS (Labtech, UK), 1% penicillin/streptomycin/L-glutamine (SLS, UK) [23]. hES-MPs (passage 5) were included in the solution to obtain a final concentration of 2*106 cells/ml. Samples (N=36) were then statically seeded by depositing a drop of 20 µl of collagen/cells solution on the top surface of scaffolds. Such a seeding density was chosen because previous studies showed a tendency toward osteogenic differentiation [26], [27]. hES-MPs were used as the cell source because of their reduced risk of tumour development due to the fact that their differentiation pathway is already partly defined and because they are expected to be more stable compared to other type of highly proliferative lineages such as embryonic stem cells enabling future therapeutic applications and advantages for bulk production of cells for therapy [24]. hES-MPs led to an higher production of tissue formation compared to adult mesenchymal stem cells when culture in column bioreactors showing great potential for the development of bone substitutes [25]. Scaffolds were kept in culture during the whole experiment using the same media formulation used for the dilution of the collagen.
2.3
Mechanical compression of seeded cPCL
3D Insert PCL scaffolds (Biotek, USA) were divided in groups depending on the mechanical protocol to be applied. A total of 48 samples were used in each experiment: 18 were kept in free-floating conditions, 18 were cyclically loaded and 12 were kept as controls with collagen but without cells in free floating conditions. After 5 days in culture to allow the adaptation of cells to the environment, samples were collected and placed into a previously autoclaved biodynamic chamber (Fig. 1) for compression. The chamber was then mounted onto a bioreactor (BOSE Electroforce, USA) and a preload of 0.1 N was applied to avoid shifting of the specimen. The chamber was then filled with media by pumping the fluid with a peristaltic pump and samples underwent cyclic compression (Fig. 2):
1) superimposing a 5% strain ramp at 1 ;
2) applying a 2% peak-to-peak (from 4 to 6% strain) sinusoidal waveform at 1 Hz for 15 min;
The chamber was then removed from the bioreactor, placed under a culture cabinet, and samples
were moved to 96 well plates with T
new culture media. Non-loaded samples (U) were kept in static culture and no compression was applied. The response of cells cultured in non-loaded samples was compared with samples loaded for 15 min per day (Table 1), from day 6 to day 10 (L1). Half L1 samples were then compressed again from day 16 to day 20 (L2).
2.4
Analysis of hES-MPs response
Time points were set at 1, 3, 7, 14, 21 and 28 days and the initial number of samples varied among conditions. At day 1 and day 3, no samples had undergone compression (Fig. 3), therefore testing three random samples over the entire batch provided a good representation of the behaviour of cells for all samples involved in the experiment. At day 7 and 14, samples were either non-loaded or loaded with a single series of cycles and therefore a total of six samples needed testing, three for each condition.
The last time points were preceded by a second series of compression cycles, therefore nine samples were tested at day 21 and 28. Thus, at day 0 (Table 1):
- 18 samples accounted for U as 3 samples were tested at each time point (3x6=18);
- 12 samples accounted for L1 as 3 samples were tested at day 7, 14, 21 and 28 (3x4=12);
- 6 samples accounted for L2 as 3 samples were tested at day 21 and 28 (3x2=6).
The entire experiment, from day 1 to day 28, was repeated three times to assess reproducibility and any variability due to slightly different external conditions and scaffolds architecture. The number of samples, involved in Presto Blue (Table 3) or other assays (Table 2), enabled statistical analysis. For each condition, a minimum of three samples were considered, averaging values from the three repeats of the experiment. Data were tested for normality and equality of variances by Shapiro and
L respectively, but due to the high variability between series, Games-Howell non-parametric test was also applied.
2.5
Viability assay
Presto Blue (Presto BlueTM Cell Viability Reagent, Gibco) was performed on samples fitted in a 96
PB“ B P B
was added to samples and left to react for 1 hour in an incubator. Viability was assessed by
reader at ex/em 540/590 nm.
2.6
hES-MPs response to compression
(Table 3). The number of samples tested by Presto Blue differed up to day 21, as U and L1 were tested for a higher number of time points (Fig. 3).
2.7
DNA and ostecalcin ELISA assay
Two samples were collected at each time point and DNA was quantified by Quant-IT DNA kit (Gibco, UK). Briefly, samples were cut into pieces and immersed in 200 µl of 0.5% trypsin for 5 minutes. Then, 200 µl of culture media was added and samples were vortexed for 5 s. 20 µl of suspension was diluted in DNA lysis buffer (distilled water, 1Mm magnesium chloride, 5 mM calcium chloride, 1% Triton X, 10% Tris-EDTA) and picogreen stain (200:1 v/v) was added. Fluorescence was read at 485/535 nm after 30 minutes. The remaining solution was stored at -80°C for osteocalcin (OCN) quantification by ELISA assay (CytoSet kit, Life Technologies, UK). At each time point, a control sample was collected for DNA assay and, then, was stored in the same conditions as samples for OCN ELISA.
2.8
Osmium staining and micro computed tomography
At each time point, a sample was fixed with 180 µl of 2.5% glutaraldehyde for 2 hours, and then 20 µl of osmium tetroxide was added and left to react overnight. Samples were washed 3 times with distilled water and then allowed to air dry. All samples were scanned with SkyScan 1172 (Bruker, Belgium) at 40KV, 255mA and 10W within 3 days of staining. Pixel size was set at 17.4 µm and images were reconstructed by the CTAn reconstruction software (Bruker, Belgium) accounting for ring artefacts and beam hardening correction of 10% and 15% respectively. A control sample underwent osmium staining and x-ray scanning to account for the initial injection of collagen gel.
2.9
Segmentation
2D Images were segmented by ScanIP (Simpleware Ltd., UK) and 3D structures were analysed to quantify mineral, and tissue formation. As the intensity of the signal from the x-ray is related to the density of the scanned material, signal in the low (3,500-7,500) grey values (GV) range was considered to be volumes of tissue occupied by cells and ECM (Fig. 4). Higher GV (13,000-60,000) were instead attributed to the mineral phase (Fig. 4). Values between 7,500 and 13,000 were associated to with the scaffolding structure. The amount of tissue and mineral was further divided, among material developing on the surface or in the internal volume of the scaffold, through selection of a region of interest (ROI) with cylindrical shape measuring 4 mm in diameter, 0.5 mm in height and concentric to the scaffold. All the values were calculated subtracting the volume of tissue or mineral of each condition to the volume of collagen detected in the controls at the same time point.
2.10
Fluorescent staining and cellular apoptosis
fluorescent microscopy and pictures were elaborated by the Metamorphosis software (Nikon, Japan). The time of exposure was set to:
- Blue light (scaffold autofluorescence): 40 ms;
- Red light (dead/apoptotic cells): 40 ms;
- Green light (alive/viable cells): 200 ms;
and reconstructed by ImageJ (NIH, USA).
3
Results
3.1
hES-MPs viability
At day 1 and 3 cells were shown to be viable and samples from different groups had similar fluorescent values, (Fig. 5). After one day of stimulation (day 7), the fluorescent signal of loaded samples was weaker compared with free-floating samples, although cell metabolic activity increased for both conditions. Between day 7 and day 21, the metabolic activity remained unvaried among time points as well as loaded and non-loaded samples. Due to the high standard deviation, no significant differences among conditions were identified by statistical analysis at any time point, except at day 28 when non-loaded samples underwent a further increase in cellular metabolism. Similar results were obtained by fluorescence images taken at each time point (Fig. 6). A lower green signal was characteristic of scaffolds undergoing compression at both day 7 and day 28. At the latter time point, cells were well elongated and spread in all cases, but clear signs of proliferation were mainly observed on non-loaded conditions where cells covered the entire surface of the scaffold. Cells appeared to align in the same direction, developing a highly interconnected cellular network in U and L1. On the contrary, cells embedded in samples undergoing twice the cyclic loading appeared less oriented, with thin protrusions spreading in different directions and conferring a more star-like shape (Fig. 6).
3.2
hES-MPs proliferation and ECM production
From day 21, tissue growth involved volumes either inside or outside the ROI for L1, followed by a quick drop in tissue content at day 28.
3.3
Mineralization
Further observation of µCT scans allowed the isolation of the signal from the mineral formed by the action of cells by selecting high intensity GV (Fig. 10). U samples mineralized at day 14 and the mineral content remained constant for the remainder of the experiment. On the surface mineral content was 2 mm3, but it was below 0.5 mm3 in the internal volume, close to the detectable threshold. By contrast, cells in loaded samples started to produce mineral inside the ROI as well as on the surface from day 7, suggesting an early mineralization process triggered by the cyclic load applied. Although the early mineralization response triggered in L1 samples was not observed in free-floating conditions, U samples showed a 6-fold higher volume of mineral compared with L1 from day 14 onwards, suggesting that cyclic load prevented mineralization when applied at the early culture stage. The load elicited a strong effect on mineralization also when applied at the advanced culture stage. Indeed, L1 samples did not show any further sign of mineralization after day 7, and the mineral phase at day 28 was only 25% of the amount detected in U. Conversely, a second series of compression cycles enhanced mineralization at day 21, and the mineral content became a significant 30% higher at day 28 compared with U (p<0.05). Moreover, the mineralization in ROI for L2 (Fig. 11) was 3-fold higher than the other tested conditions from day 21, suggesting late cyclic stimuli to induce mineralization on previously compressed samples. The pattern of mineralization observed by µCT was confirmed by quantification of OCN by sandwich ELISA (Fig. 12). Although not statistically significant, OCN was expressed on L1 samples at day 7, suggesting the possibility of an early cellular response triggered by the mechanical loading. Moreover, the effect of cyclic loading, applied at the later stage of culture on the mineralization potential of cells was further confirmed at day 28 by the significantly higher (*p<0.05) amount of OCN expression detected in L2 samples compared with U and L1. The total amount of osteocalcin for U, L1, and L2 at day 28 was 35.1, 28.3 and 35.9 pg respectively.
4
Discussion
4.1
Mechanical compression and proliferative response
As a consequence, if Presto Blue gave the same fluorescence signal for all samples, they were considered as belonging to the same group. Indeed, the L2 condition appears just after day 21 when some of the samples from L1 were taken and underwent further stimulation at day 21 and 28. A reliable proliferation profile was provided by quantification of DNA content.
In contrast to Presto Blue, DNA quantification required the destruction of the sample, enabling the complete extraction of cells and providing information on cells located in the internal volumes of samples. DNA assay is a highly sensitive test and provided precise measurements with standard deviations below the 30% of the average values except for loaded samples at day 28. The high standard deviation observed at the end of the experiment can be explained by differences among the repeats - in terms of initial concentration of collagen, scaffold geometry, and slightly different media formulations - which progressively affect the behaviour of cells over time and become more evident at later stage of culture. According to DNA quantification, cyclic compression applied over 5 days caused a delayed proliferation compared with the other tested conditions. On the contrary, L2 samples did not show any sign of proliferation after 5 days of rest, suggesting that 1) cyclic compression of scaffolds over a 5 day-length period induces proliferation only if the stimulus is applied once; 2) equally long resting periods are not enough to recover from the previous series of compression cycles and enhance proliferation; and 3) a second series of cyclic compression further delays or may block proliferation, although enhancing ECM and mineral production. Whether a second series of cyclic compression causes delay or blocks the proliferation of cells can be clarified by performing longer experiments, testing samples at day 31, at least, to equalize the time elapsed between loading series. However, comparison with the other loading conditions could be difficult due to the progressive apoptosis already observed at day 28 for U and L1 samples (Fig. 13).
Improved proliferation after cyclic load was also claimed in the literature, although different scaffolds, compression protocols, and cell type were employed. For example, murine embryonic stem cells seeded in collagen type 1 scaffolds and compressed 4 hours a day presented higher viability over time compared with non-loaded samples [28]. Enhanced variability associated with daily compression of 3D samples was also observed in other studies on hES-MPs seeded, bone-mineralized scaffolds [29].
4.2
ECM deposition and tissue development
At day 28 all conditions showed cellular apoptosis (Fig. 13), which is believed to be associated with a lack of nutrients in the interior regions of samples because of the development of the external layer. A decrease in tissue content was also observed on the surface of L1 samples, suggesting the occurrence of a programmed cell death phenomenon due to the high density achieved [30], [31] at day 21.
Differences in cell quantification among DNA and µCT may be related to the production of ECM, the signal for which is accounted for during µCT reconstruction while being excluded in the DNA quantification. Splitting the signal coming from cells and ECM into two separate components was impossible due to the type of contrast agent employed in the study, presenting the same absorbability to cells and ECM. Following this observation, the absence of a decrease in tissue volume in L2 between day 21 and day 28, can be reasonably associated with matrix production as well as variations in cell number. Increased production of ECM as a consequence of shorts bursts of compression was also claimed in another study [21] where hES-MPs seeded on polyurethane scaffolds underwent stimulation at 5% global strain for 2 hours. Similarly to our study, resting periods of 5 days were allowed between series of compression.
4.3
Tissue and mineral growth
deposition and bone volume was shown to be elicited on 3D scaffolds by using relatively shorts bursts of compression both in vitro [15], [33] as well as in vivo [34], [35].
4.4
Mechanical differentiation of hES-MPs in cPCL
The shape of cells at day 28 excluded differentiation toward the chondrogenic pathway, as in all cases cells were well elongated with extended protrusions rather than spherical. Loaded samples exhibited a less compact tissue-like organization on the surface compared with non-loaded samples probably due to the repetitive contact between the sample surface and the bioreactor shafts, causing slight damage to the most exposed tissue. Moreover, L2 cells appeared star-like, with multiple, randomly oriented, thin protrusions. These findings, together with the volume of mineral found by x-ray scanning and the expression of osteocalcin detected for L2 at day 28 may be sign of osteogenic differentiation. This contradicts previous reports, in which 2D substrates [1] [4] showed enhanced osteogenesis with applied tensile strains but chondrogenesis with applied compression [12], [17], [18], [36]. On the contrary, mineralization occurred in this study as a consequence of compression of scaffolds. This discrepancy in the literature is probably due to the different type of scaffolds considered. Indeed, 2D substrates transmit stresses to cultured cells only through the attachment surface while hydrogels provide a different distribution of stresses through space compared with that elicited by the cPCL structure due to their soft and compact matrix. Another key difference between 2D substrates and cPCL concerns the distribution of stresses. Indeed, diverse stresses act throughout the structure because of irregularities in the geometry of fibers and also the presence of collagen further increases the variability in the mechanical environment surrounding the cells. To date, local tensile stresses were shown developing from the compression of 3D PCL [37] while further clarification of the deformations affecting collagen is required to understand the link between the cellular response obtained in this study and the mechanical forces sensed by cells. According to other studies where load was applied to 3D scaffolds by four-point bending devices, compression of scaffolds could elicit a decrease in the chondrogenic potential of cells [38] and enhance osteogenic differentiation [29], [39]. However, the different type of cells and the different loading protocols applied in the experiments do not allow a direct comparison with those studies. The response to mechanical stimuli, as well as other environmental cues, are strongly linked to the cell lineage, and cells are highly sensitive to a number of factors in mechanical stimulation, such as the amplitude, frequency, the day stimulation begins, and the duration of the stimuli, leading to different responses. For example, polyurethane scaffolds showed enhanced chondrogenesis on hES-MPs for high strain above 10% [16], while more moderate strains below the 10% enhanced matrix production on hES-MPs [15] and mineral deposition on MLO-A5 [21].
5
Conclusions
without distinguishing among local stress variation, geometrical differences or imperfections As a consequence, the variability of the experiments is increased as differences in local geometry produce variation in the distribution of local stresses and to the stimuli applied to cells. As the same trend, with regards cellular response was observed regardless the differences among scaffolds, a stronger association is believed to exist between the applied compressive protocol and the overall cellular response obtained. Scaffolds undergoing short daily bursts of compression showed variations not only in terms of proliferation but also in the mineralization potential of cells. Particularly interesting was the dual effect of compression in enhancing proliferation and preventing mineralization if applied at an early stage of culture or, vice versa, suppressing proliferation and promoting mineral deposition if repeated after 5 days. This study introduces a new experimental approach for inducing mineralization of undifferentiated cells which could have great potential in the development of engineered constructs for bone fracture repair.
References
[1] E. M. Kearney, E. Farrell, P. J. Prendergast, and V. A. Campbe T
A B E 79, May 2010.
[2] Y F R P P Y L M N L “ C Y W L K M C M
increased BMP-2 expression which promoted osteogenic differentiation of tendon-derived stem
J O R 6, Mar. 2011.
[3] G. Friedl, H. Schmidt, I. Rehak, G. Kostner, K. Schauenstein, and R. Windhager,
U hMSCs) are highly sensitive to mechanical strain: transcriptionally controlled early osteo- O C
no. 11, pp. 1293 300, Nov. 2007.
[4] M. Jagodzinski E
E C M 41,
2004.
[5] X L P M P A B E
32, no. 3, pp. 477 86, 2004.
[6] H “ “ J A G M B B
vol. 24, no. 24, pp. 4353 64, Nov. 2003.
[7] K. S. Anseth, C. N. Bowman, and L. Brannon-P M hanical properties of hydrogels
B 57, 1996.
[8] J “ “ W D N K R E G M
PVA hydrogel in shear and unconfined com B 806, 2001.
[9] M C I P B G J R “
[10] G C T U T T “ D T E M Biosci., vol. 2, no. 2, pp. 67 77, 2002.
[11] “ “ J L J “ P D H N R B H
Tu M P V “ A B 337, 2016.
[12] V T D
“ C l. 25, pp. 2730 38, 2007.
[13] A J E “ “ H L “ D E D M E D “ C
L “ C 89, 2006.
[14] H. F. Hildebrand, N. Blanchemain, G. Mayer, F. Chai, M. Lefebv F B “
“ C T
vol. 200, no. 22 23, pp. 6318 6324, Jun. 2006.
[15] A. Sittichockechaiwut, A. M. Scutt, A. J. Ryan, L. F. Bonewald, and G. C R U mineralising osteoblasts and short periods of mechanical loading to accelerate matrix maturation in
D B 9, May 2009.
[16] ) L “ Y M A M J “ C an bone marrow mesenchymal stem cells in fibrin-polyurethane composites is modulated by frequency and
T E 84, 2010.
[17] S. H. Elder, S. A. Goldstein, J. H. Kimura, L. J. “ D M “ C
A B
Eng., vol. 29, no. 6, pp. 476 82, 2001.
[18] “ D T T N “ F C D J K M gradients in regulatory signals within mesenchymal stem cell seeded hydrogels: a novel strategy to engineer zonal articular
PL “ O 77, Jan. 2013.
[19] R. M. Delaine-“ G C R M onses to mechanical
M L T J 80, 2012.
[20] C T R K J M L “ D B F
E J B 3, no. SUPPL. 1, pp. 43 54, 1990.
[21] A “ J H E A M “ G C R “
loading are as effective as dexamethasone at inducing matrix production by human bone marrow
E Cells Mater., vol. 20, pp. 45 57, 2010.
[22] M B C M P D L M D I PCL
J M B B M 489, 2017.
[23] M. Brunelli, C. M. Perrault, and D. Lacroix, C
D PCL B
[25] G M P H E “ C -Derived Mesodermal Progenitors Display Substantially Increased Tissue Formation Compared to Human Mesenchymal Stem Cells Under Dynamic Culture C P B C B T E P A
no. 1 2, pp. 175 187, 2013.
[26] F G D M C B T E J M G W L C “ C C “ Cell Fate by Physical Interactions with the Extracel M C “ C 26, 2009.
[27] “ H M B M L K T M A
T E P A no.
9, pp. 1561 72, 2008.
[28] “ D J R M D E R N A D T E M
Stimulation on Mineralization in Differentiating Osteoblasts in Collagen-I “ T E P A, pp. 1 12, Jul. 2014.
[29] J. R M M “ P O D H
Bone Marrow Stromal Cells on 3-D P D B “ I V C T I vol. 74, no. 5, pp. 458 68, May 2004.
[30] M C R “ N 400, 1992.
[31] M G B H C C O C B
745 752, 1999.
[32] M. Hughes-Fulford and C.-F. L T FGF-2 and BMP-2 in regulation of gene
J O “ R
[33] E B J H K Y Y M A W A J E H I to
local mechanical strain in three- J B
739, 2010.
[34] A O D C M C I M C -Seeded Polymer
“ I V J B E 29, no. 4, p. 531, 2007.
[35] A. Roshan-G A T P E B D P P I
E C M
vol. 19, pp. 41 49, 2010.
[36] “ D T C T B T V F J O B V C D J K T response of bone marrow-derived mesenchymal stem cells to dynamic compression following
A B E 8, no. 9, pp. 2896 909, Sep. 2010.
[37] A C D L R PCL
[38] “ D T C T B T V F J O B V A C D J K D
B B R
Commun., vol. 377, no. 2, pp. 458 62, 2008.
[39] “ M T J L R L D H Y D B B C H T E
frequency vib J B 80, 2003.
Fig.1: Electroforce biodynamic chamber embedding shafts and filled with culture media (pink) for mechanical compression of samples.
Fig. 2: Cyclic compression of samples with superimposed initial ramp at 5% strain.
Fig.3: Schematic representation of the experiment. Samples were kept in culture for 28 days. Time points were set at day 1, 3, 7, 14, 21 and 28. At the time of the first two time points, samples were all non-loaded, so just three samples were tested for DNA and OCN expression, and µCT. The following two time points match the period of the first series of compression. So at day 7 and 14, six samples, three non-loaded and as many loaded, were tested. As the second series of stimuli was applied between day 16 and 20, three more samples were tested at the last two time points to account simultaneously for U, L1 and L2.
Fig. 4: 2D slides obtained from reconstruction of microCT images. (A) 3D PCL cultured with cells after 28 days in culture. (B) Tissue (green) and (C) mineral (red) were selected through the structure by the FloodFill feature provided by Simpleware considering grey values between 3500-7500 for tissue and 13000-60000 for mineral.
Fig. 5: Viability of cells (n = mean±S.D.) by Presto Blue measurement over 28 days considering non-loaded (U), non-loaded once (L1) and twice non-loaded (L2) samples as average of three experiments. Stars highlight significant differences with p<0.05 referring to * all the series or * just U samples.
Fig. 6: Fluorescent images of samples seeded with hES-MPs at 10X. Viable cells are green, while scaffold fibers are blue due to auto-fluorescent properties of PCL. At day 28 loaded samples show cells randomly oriented with a star-like shape.
Fig. 7: Cell number (n = mean±S.D.) over time for non-loaded (U), loaded once (L1) and twice loaded (L2) over 28 days. Samples from different groups were considered the same as at day 1 and day 3, as no statistical differences were found comparing metabolism of U, L1 and L2 by Presto Blue. Due to the ANOVA results on Presto blue assay, loaded (L1 and L2) samples at day 7 and day 14 were also considered as belonging to the same group. As a consequence, the amount of cells attributed to L1 for those two time points was simultaneously representative for the behaviour of L1 and L2. Significant differences are underlined: *p<0.05.
Fig. 8: Volume of tissue (n = mean±S.D.) accounting for cells and ECM content considering GV ranging between 3,500 and 7,500 (*p<0.05).
Fig. 10: Overall volume of mineral (n = mean±S.D.) detected by µCT for non-loaded (U), loaded once (L1) and twice loaded (L2) samples over 28 days, and referring to GV in a range between 13,000 and 60,000.
Fig. 11: internal (IN) and superficial (OUT) amount of mineral (n = mean±S.D.) quantified by µCT scanning of non-loaded (U), loaded once (L1) and twice loaded (L2) samples over 28 days (*p<0.05).
Fig. 12: OCN content (n = mean±S.D.) over time normalized over total cell number measured by DNA. The test was performed on six samples per time point, for non-loaded (U), loaded once (L1) and twice loaded (L2). Stars indicate significant differences among conditions at the same time point.
Fig. 13: Fluorescent imaging of scaffolds at day 21 for (A) unloaded (B)loaded once and (C) loaded twice scaffolds.
Fig. 14: Cellular (blue) and mineral (red) tissue growth over time for non-loaded (U) (left), loaded once (L1) (centre) and twice loaded (L2) (right).
.
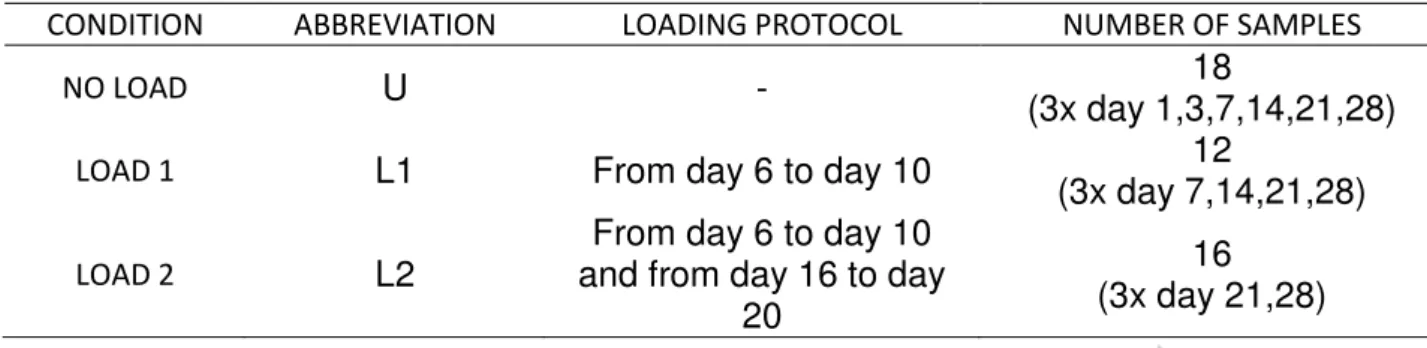
Table 1: loading conditions applied to samples and total number of samples involved per each stimulation protocol. It is important to notice that non-loaded (U), loaded once (L1) and twice loaded (L2) samples were monitored respectively since day 1, day 7 and day 21.
CONDITION ABBREVIATION LOADING PROTOCOL NUMBER OF SAMPLES
NO LOAD
U
-
18
(3x day 1,3,7,14,21,28)
LOAD 1
L1
From day 6 to day 10
12
(3x day 7,14,21,28)
LOAD 2
L2
From day 6 to day 10
and from day 16 to day
20
16
(3x day 21,28)
Table 2: Summary of the total number of samples used for DNA, OCN and µCT analysis at each time point. The number of samples refers the total number of samples. So, the number of tested samples 1) at day 1 and 3 were three because all samples were non-loaded, 2) at day 7 and 14 were six to consider any difference caused by L1, and 3) at day 21 and 28 were nine to account for non-loaded (U), loaded once (L1) and twice loaded (L2).
TIMEPOINT TEST
TIMEPOINT DAY 1 DAY 3 DAY 7 DAY 14 DAY 21 DAY 28
CONDITION
U
U AND L1
U, L1 and L2
DNA & OCN
NUMBER OF
SAMPLES
6
6
12
12
18
18
CTRL
3
3
3
3
3
3
MICROCT
NUMBER OF
SAMPLES
3
3
6
6
9
9
CTRL
3
3
3
3
3
3
Table 3: Summary of the number of samples teste for metabolic activity by Presto Blue assays per each condition at each time point. The number indicates the total of samples tested in 3 different experiments.
TIMEPOINT
CONDITION DAY 1 DAY 3 DAY 7 DAY 14 DAY 21 DAY 28
LOAD 1
36
36
36
27
18
9
LOAD 2
18
18
18
18
18
9
CTRL
36
30
24
18
12
6
Highlights
Compression applied at early stage of culture delayed proliferation
Compression applied at late stage of culture induced mineral deposition