Abstract: The predominant growth of Internet, Smart phones and online music service providers led to enormous amount of digital music. It becomes immensely important for service providers to search, map and provide users with the relevant chunk of music according to their preferences and taste. Recommendation systems (RS) are built to help users in finding relevant information. RS plays an important role in recommending items such as music, books, movies, restaurants etc. This paper presents a user-based collaborative filtering model for music recommendation. Various proximity measures are used in model building. User-based collaborative filtering model is implemented on standard dataset obtained from Last.fm and the results are compared with most popular, nearest neighbor and clustering methods.
Keywords: Recommendation system, Collaborative filtering, Proximity measures, nearest neighbor, clustering
I. INTRODUCTION
Due to the growth of Internet, the amount of digital music available to the users now is greater than ever. Music Recommendation Systems contains algorithms and methods to provide the most relevant and accurate music to the user by filtering large volume of data from digital libraries [1][5]. Recommendation engines identifies implicit data patterns present in the data by learning users’ choices and gives suggestions that co-relate to their needs and interests. Lot of research is happening in Music recommendation systems in the recent time. User and item features are used in Pandora and Spotify to provide commercial recommendations but they have failed to explore all the features of users and items. As music is very versatile and complicated, there are lot of components that influence users’ interest [1].
Recommendation systems are classified as Collaborative filtering (CF) and Content based methods. The fundamental idea of a CF based method is “users having similar taste in the paste will also have similar taste in future” [2][8]. Content based methods are built by taking content of the item into consideration. For example in case of book recommendation,
Revised Manuscript Received on April 06, 2019.
M. Sunitha, Dept. of CSE, Vasavi College of Engineering Ibrahimbagh, Hyderabad-31, TG, India.,sashu2006@gmail.com
Dr. T. Adilakshmi Dept. of CSE, Vasavi College of Engineering Ibrahimbagh, Hyderabad-31, TG, India, t_adilakshmi@rediffmail.com
the content of the book is considered while performing recommendation.
Collaborative filtering methods suffer with the problems such as Scalability, Sparsity and Cold-start [6]. Whereas Content based methods are domain specific i.e. difficult to propose a general framework.
This paper presents a User-based CF method. The proposed method considers different proximity measures to form a model. Model is built based on clustering algorithm. The results are compared with two other models named as most popular and nearest neighbor methods.
The rest of the paper is organized as follows. Section 2 explains related work. Section 3 discusses about the proposed algorithm. Section 4 showcases the results obtained for the proposed algorithm and Section 5 describes conclusion and future directions of research.
II. RELATEDWORK
The data structure required for Collaborative filtering, user-item rating matrix and is formed from the implicit feedback of the users as shown in the fig 2.1. CF centered on users’ behavior is known as based methods are broadly categorized as User-based CF and Item-based CF
U/I I1 I2 I3 I4
U1 0 4 0 1
U2 3 3 0 0
U3 0 0 1 2
U4 1 0 0 4
Fig.2.1. user-item rating matrix A. User-based CF method
In user-based CF the Centre point is users. For any test or new user nearest neighbors are found by using any standard proximity measure. The number of nearest neighbors considered forms the value of K which can be 1, 3, 5…. The working of KNN algorithm can be shown in the Fig.2.1.1. Star is the test sample and three nearest neighbors belong to the class circle so for the test sample the same class is predicted
Comparison of User-based Collaborative
Filtering model for Music Recommendation
System with various proximity measures
Fig.2.1.1. Working of KNN algorithm
B.Item-based CF method
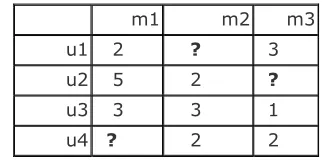
In item based collaborative filtering items play key role. Similarities between items are calculated from rating-matrix. Based upon these similarities, user’s preference for an item not rated by him/her is calculated as shown in Fig2.2.1.
m1 m2 m3
u1 2 ? 3
u2 5 2 ?
u3 3 3 1
[image:2.595.307.545.170.256.2]u4 ? 2 2
Fig.2.2.1. sample user-item rating matrix
Here rating of user u1 for item m3 is 3. Other user ratings for the same item are used to predict the missing ratings. For example rating for item m2 by user u1 is not available. According to the item based CF it can be predicted from other users rating for the same item.
III. PROPOSEDMETHOD
This paper presents an implementation of user-based CF with model building. The model is constructed by using clustering algorithms. Following are the important steps involved in the proposed method:
a)
Acquiring and pre-processing of datab)
Proximity measuresc)
Model buildingd)
Providing recommendationse)
Evaluation measuresA. Acquiring and pre-processing of data
Quality of data is very important in any data mining task. In case of recommendation system the quality of data that will be used to train recommendation algorithm is very important. To build a music recommendation system we obtained a bench mark dataset from Last.fm. The data considered in this paper is the listening history of 992 users for 3 years. The details of the dataset is given below
Total Lines: 19,150,868 Unique Users: 992 Artists with MBID: 107,528
Artists without MBDID: 69,420
All the users' activity is recorded in the Last.fm database as shown in Fig3.1, which in turn is used by the portal to make music recommendations .The dataset for this research work contains activities of 100 users whose listening history has been captured anonymously for the period of 3 years. For every song that a user listens to, its activity is recorded in the following format:
Mon Apr 10 14:59:34 GMT+05:3 0 2017
Teja swi Goll amu di
6674 Tu Hai Ki Nahi
2 1
Roy (2015)
Fig. 3.1: User Record tuple in the dataset
Each record contains the fields such as UserID, Timestamp, Album ID, Album Name, Track ID and Track Name. Last.fm provides an API by using which we can get the information about the tags, popular artists, most popular songs trending etc.
a. Splitting of the Last.fm Dataset into smaller files using EmEditor.
This dataset contains <user, timestamp, album, track/song> tuples collected from Last.fm API. Since the dataset is too large to be processed we are splitting the Last.fm dataset into 40 files with 5,00,000 records each. Here we take the 250 Mb .tsv into 40 separate .tsv files with 5 Lakhs records in each.
The Split Current Document to Several Files command in EmEditor allows us to split the current document into several files either every user-specified number of lines, or before every bookmarked line.
In this research work, we are considering 100 users out of 992 to form the User-Item matrix. For this we have split the 40 files containing 5 lakhs records each into separate files for each user i.e., 100 .csv files. Python is used to make this conversion and splitting.
We removed the records in which the users who has listened less than 250 songs and the songs which were listened by less than 10 users. We considered only those log records which have the users and songs which satisfy the above criteria. Thus, by removing these unwanted logs, we ignore those data when calculating the rating of items.
After data preprocessing, the
[image:2.595.69.230.286.366.2]total of 5,503 items and 100 users. The detailed statistical
information of training dataset is described below.
Number of distinct items : 5,503
Number of distinct users : 100
Fig.3.1.1.1. Part of user-item rating matrix after pre-processing
b. Normalization of user-item matrix
Normalization is one of the important technique used in statistics. One of the application to use normalization is to adjust rating values measured on different scales to a notionally common scale.
Three different normalization techniques are used in this research work can be used.
i) Min-max Normalization: This technique keeps relationship among original data and new data as given in equation 1. This provides an easy way to compare values that are measured using different scales (for example degrees Celsius and degrees Fahrenheit) or different units of measure (speed and distance).
(1) ii) Standard Scalar Normalization
Mean and deviation of a data distribution is to normalize the data as given in equation 2.
(2)
iii) Length Normalization: Length normalized vectors for each user is obtained by dividing the rating of each user for each item with the sum of his/her ratings for all items. The mathematical formula to find length normalized vectors is given in equation 3. The purpose of length normalization is to bring all users on to the same scale irrespective of the number of items rated.
(3)
c. K-Fold Cross Validation
Cross-validation is used in prediction problems. The objective of cross-validation is to build a model whose performance is not biased to the training dataset. In this every sample in the dataset will be used for training as well as testing.
Initially dataset is divided into K folds and one fold is used for
testing and remaining K-1 folds are used for training the model. This will be repeated for K times to make sure that each fold will be used for training and testing.
K fold cross validation is performed for selecting testing and training data (here k =10). Users are divided into 10 folds, where 7 folds will be used for training and 3 folds will be used for test data. As the iterations proceed, the 7:3 ratio will be altered to various values. We have considered the following cases to carry out this research work
Case 1: Used random training data set of 70% and test data set of 30%.
Case 2: Used random training data set of 80% and test data set of 20%.
Case 3: Used random training data set of 80% and test data set of 20%.
d. Proximity measures
Different proximity measures are used in building the model by using clustering algorithms. Similarity and dissimilarity measures considered in this research work are: distance measures (Euclidean, Manhattan, Supremum), similarity measures (Cosine, Pearson correlation).
Euclidean distance is the most commonly used distance measure. It is used to find how close the two users or items to each other. It is given by the sum of square of the difference of the individual elements of the vectors representing the users or items.
The distance from p to q is given by
Where d(p,q) refers to the Euclidean distance between two users or items p, q represented as n dimensional vectors where n is the number of items.
Manhattan distance between two data points X and Y of n dimensional vector is given by
Supremum distance between two data points X and Y of n dimensional vector is given by
for 1<= i<= n
angle between them. Users and items are represented as vectors and if they have same orientation then the cosine similarity will be high. If the vectors are far apart then cosine similarity will be low. The value of this measure is in {0,1}
Given two vectors A and B, the cosine similarity, cos (θ) is represented using a dot product and magnitude as
Pearson’s correlation, measures the linear correlation between two vectors of ratings.
Where Si,c is the rating of the item c by useri, Ai is the average rating of user i for all the co-rated items, and Iij is the items set both rating by useri and userj.
e. Model building
K-means clustering algorithm is used to find user clusters. To find the optimal k value, Elbow method is used. The KElbowVisualizer from scikit learn implements the “elbow” method to help data scientists select the optimal number of clusters by fitting the model with a range of values for K. To demonstrate, in the following example the KElbowVisualizer fits the KMeansmodel for a range of K values from 4 to 11 on a sample two dimensional dataset with 8 random clusters of points. When the model is fit with 8 clusters, we can see an “elbow” in the graph, which in this case we know to be the optimal number.
K
-means algorithm takes the input parameter, k, number of clusters and n the number of objects. We need to partition n objects into k clusters so that the resulting intra-cluster similarity is high but the inter-cluster similarity is low. Cluster similarity is measured in regard to the mean value of the objects in a cluster, which can be viewed as the cluster’s centroid or center of gravity.First, it randomly selects k of the objects, each of which initially represents a cluster mean or center. For each of the remaining objects, an object is assigned to the cluster to which it is the most similar, based on the distance between the object and the cluster mean. It then computes the new mean for each cluster. This process iterates until the criterion function converges. Typically, the square-error criterion is used and defined as in the equation 4.
(4)
Algorithm Kmeans()
Input: k- no.of clusters, n data points
Output: K clusters consisting of n points
Method: Begin
1. Arbitrarily choose k objects from D as the initial cluster centers;
2. Repeat
3. (Re) assign each object to the cluster, to which the object is the most similar, based on the mean value of the objects in the cluster;
4. Update the cluster means, i.e., calculate the mean value of the objects for each cluster; until no change
End
B.Providing recommendations
By using K-fold cross validation we withhold 30 users for testing. For each test user proximity is calculated from mean user cluster vector. Find the nearest user cluster and perform recommendations.
We computed the evaluation measures of the proposed model in case of all songs, top-50, top-60 and top-70 songs recommendation using the confusion matrix shown in Fig.3.4.1.
Algorithm Recommendation_userbasedCF ()
Input: User Clusters
Method:
Begin
1. Map each test user to the nearest user cluster
2. Consider the recommendations from user clusters
3. Let I1, I2, ….Ik are the items in user clusters then recommend all songs, top-50, top-60 and top-70 songs 4. Compute confusion matrix based on the recommendations
End
C.Evaluation measures
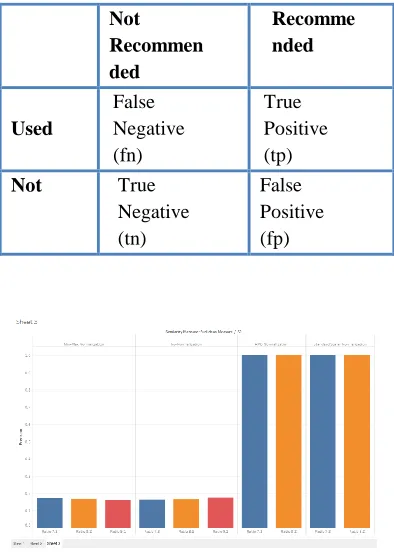
[image:5.595.46.243.343.621.2]For the analysis purpose, we withheld some of the data (users’ listening history of 30 users) to perform the evaluation of song recommendations and check if it matched the benchmarks. For every test user, depending upon the criteria, each song that is recommended can be categorized into one of four the groups of confusion matrix as shown in fig.3.4.1.
Fig.3.4.1 Confusion matrix
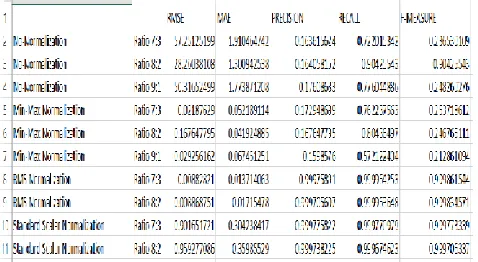
Fig.4.1. Precision values for various Normalization Techniques and Euclidean distance
The terms in the confusion matrix are defined as: True Negative (TN): A song which is uninteresting to the user is not recommended to them.
False Positive (FP): A song is recommended by the algorithm which a user is not interested in.
True Positive (TP): The algorithm recommends a song to the user which they are interested in.
False Negative (FN): The algorithm does not recommend
a song to the user which they are interested in.
To evaluate the performance of the recommendation system, recommendations are given to the users whose listening history is already known.,
Based on obtained positives and negatives Precision, Recall and F-measure are calculated in order to evaluate efficiency of the system. We can define them as follows: Precision: It is defined as the ratio of relevant items selected to number of items selected, shown in Equation 5. Precision represents the probability that a selected item is relevant.
(5)
Recall: It is defined as the ratio of relevant items selected to total number of relevant items available. Recall represents the probability that a relevant item will be selected.
(6)
Precision and recall depend on the separation of relevant
and non-relevant items.
Fig.4.2.Precision with Min-max Normalization and No-normalization
F-measure: It is defined as a measure that combines both precision and recall in the harmonic mean of precision and recall. It is also called as balanced f-score or f-measure.
(7)
Fig. 4.3. Comparison of Precision for proposed method with KNN and most popular
IV. RESULTS
Results of the proposed system are compared with different normalization techniques
and various proximity measures.
Not Recommen ded
Recomme nded
Used
False Negative (fn)
True Positive (tp)
Not True
Negative (tn)
[image:5.595.304.533.443.626.2]
Fig.4.4. Recall values of various similarity Measures for different number of recommendation songs
Fig.4.5. F-Measure values of various similarity Measures for different number of recommendation songs
Fig.4.6. Recall values of various Normalization Techniques
V. CONCLUSION&FUTURESCOPE
This paper proposes a model based solution for music recommendation system. Model is built by using k-means algorithm. Optimal value for K to be considered is found by using elbow method. Various normalization techniques are used and results obtained are compared. K-means algorithm is also implemented with different proximity measures such as Euclidean, Manhattan, Supremum distance measures, Cosine, Pearson correlation similarity measures. Proposed method is compared with KNN and most popular methods. Results obtained for the proposed system are way better than KNN and most popular methods.
As music is very complicated it is very difficult to built an efficient recommendation system with only user-item rating matrix. Collaborative filtering method suffers with long tail and cold-start problems.
Table 4.1 Table various evaluation values for different normalization Techniques
Long tail problem can be addresses by using multi-level association rule mining. Multi-level association rule mining try to identify the items in long tail which are correlated to popular items. Cold-start problem can be addressed by using user demographic information for new users. New item cold-start problem can be addressed by considering metadata of items.
VI. REFERENCES
1. Yading Song, Simon Dixon, and Marcus Pearce, A Survey of Music Recommendation Systems and Future Perspectives, 9th International Symposium on Computer Music Modelling and Retrieval (CMMR 2012), 19-22 June 2012, Queen Mary University of London
2. O. Celma Herrada. Music Recommendation and Discovery in the Long Tail. PhD Thesis, 2009
3. Markus Schedl, Emilia Gómez, Julián Urbano, Music Information Retrieval: Recent Developments and Applications, Foundations and Trends R in Information Retrieval, vol. 8, no. 2-3, pp. 127–261, 2014
4. Michael D. Ekstrand, John T. Riedl, Joseph A. Konstan, Collaborative Filtering Recommender Systems, Tutorial at Foundations and Trends in Human–Computer Interaction 5. N. Lathia, Evaluating Collaborative Filtering Over Time, PhD
thesis, University College London, London, UK, June, 2010. 6. Geoffray Bonnin , Dietmar Jannach, Automated Generation of
Music Playlists: Survey and Experiments, ACM Computing Surveys, Vol. 47, No. 2, Article 26, Publication date: November 2014
7. Jiawei Han, Micheline Kamber, Data Mining: Concepts and Techniques (3rd ed.), 2014
[image:7.595.48.287.76.207.2]