International Journal of Innovative Technology and Exploring Engineering (IJITEE) ISSN: 2278-3075, Volume-8 Issue-12, October 2019
Abstract: Most of the countries globally depend on the energy-related industries in daily and economic activities. Due to the perpetual population growth and the fast economic development, the development of energy generation model is crucial in availing the economic planning strategy of the country. The study developed and evaluated the energy generation model of Al-Zawiya Steam Power Plant, Libya. Specifically, the study focused on the causal relationship between input and output of the energy generation model using the Partial Least Squares–Structural Equation Model (PLS-SEM) method as the sample size was too small to utilize Structural Equation Modelling-Analysis of Moment Structure (SEM-AMOS). A data was gathered from Al-Zawiya Steam Power Plant, Libya which consisted of 12 indicator variables with 60 observations. The analysis revealed that most of the causal relationships in the developed model were significant at p<0.005. The results indicated that the developed model was strengthened by empirical analysis and in parallel with the preceding findings and theoretical framework. Apart of input and output structural model, the study also prosperously validated all the indicator variables depicted in input and output measurement model. In conclusion, this study had successfully developed and evaluated energy generation model and corroborated the causal relationship of several input and output latent variables by betokens of structural equation model through PLS-SEM approach.
Index Terms: Energy generation model, input and output structural and measurement model, Partial Least Squares-Structural Equation Model (PLS-SEM).
I. INTRODUCTION
The Libyan oil and gas industry has contributed to its economic development significantly. Hence, the economic planners in the country have highlighted the development of the energy-related industries from an early economic planning stage. Electricity is one of the most important energy sources currently. A majority of the devices and facilities used in developed or developing countries are powered by electric energy. In comparison to other energy sources, the storage of electric energy is difficult, which makes it a transient energy form, and hence, it has to be used as soon as it is generated. Due to these factors, electricity is seen to be an indispensable and important economic product and was difficult to understand from an economic viewpoint [1]. The Libyan
Revised Manuscript Received on October 05, 2019.
Fadya Ramadan Shakhim, Department of Statistics, Faculty of
Science, Al-Zawya University, Al-Zawya, Libya.
Zulkifley Mohamed, Department of Mathematics, Faculty of Science and Mathematics, Universiti Pendidikan Sultan Idris, 35900 Tanjong
Malim, Perak, Malaysia. (Correspondence Author)
power sector comprises of major power plants, which are distributed in six geographically-isolated regions, i.e. Tripoli, West (Al-Zawiya), Eastern (Zwitina Benghazi), Central (Zelten), and South (Jakhira). Furthermore, these regions are not well connected to the other areas. In this study, the researchers aimed to develop and evaluate energy generation model and incorporated the electrically-induced resource externalities for Libyan energy generation plant. The study investigated the Libyan energy generation model, at the Al-Zawiya Steam Power Plant. Many studies discuss the energy generation on the aspect of efficiency, see [2],[3],[4] and [5]. A little focus on the input and output relationship. This study withal strive on the causal relationship between input and output of energy generation in the form of a structural equation model (SEM) by utilizing PLS-SEM.
II. PURPOSEOFTHESTUDY
The purport of this study is to develop and evaluate a structural model that illustrate the causal relationship between several input latent variables and output latent variables of energy generation plant. Specifically, the study developed the energy generation model in which the data was gathered from Al-Zawiya Steam Power Plant, Libya. In consummating the study, the PLS-SEM approach is implemented and SmartPLS 3.0 software is utilized to analyze the data.
III. METHODOLOGY
A. Data Collection and Energy Generation Variables Data collection was a vital step as it helped in achieving the major study objectives. The data in this study was compiled from the secondary data sources. These data was gathered several sources such as the Registration Reports; Economic survey of Libya and Power Research Centre; and General Directorate of the Power Plant Productivity report. The vital variables in energy generation plant as stated by [6],[7],[8],[9],[10],[11],[12] and [13], were electricity (MW), freshwater (m3), desalination water (seawater (m3/day) and amount of steam needed for freshwater production (tons/day)), steam power (steam turbine (tons/day) and boiler (m3/day of distilled water)), chemical additives (Phosphate (kg/day), Hydrazine, Morphine and anti-scale (L/day)), and maintenance and operation cost (fuel and chemical treatment costs (LYD/day)).
Fadya Ramadan Shakhim, Zulkifley Mohamed
Assessing the Partial Least Squares-Structural
Equation Modelling Causal Relationship
Output of Energy Generation Model
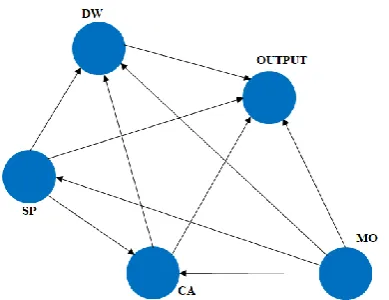
B. Energy Generation Model [image:2.595.313.557.242.422.2]The energy generation model in this study was developed based on [1],[7],[14] which highlighted the significant relationship between the input and output of the related variables in the energy generation plant. This model consisted of four measurement models representing the input and output of the energy generation. The input measurement model were desalination water (DW) (seawater and steam), steam power (SP) (boiler and steam turbine), chemical additives (CA) (sodium tri-phosphate, hydrazine, morphine and anti-scale), and maintenance and operation cost (MO) (fuel and chemical treatment costs). The technique that was used for the proposed model was further described by applying to the output measurement model which consists of fresh water and electricity. The developed energy generation model is depicted in Fig. 1
Fig 1. Input and Output of Energy Generation Model
C. Partial Least Squares-Structural Equation Model (PLS-SEM)
In assessing the energy generation model, the study employed PLS-SEM. Two different stages were engaged in the PLS-SEM model evaluation. In the first stage, the measurement model, the latent variable characteristics and measurement items that denote them were examined. While the structural model and its relationship was analysed in the second stage to determine the causal relationship between latent variables as indicated in the research model. As suggested by [15], the procedure of assessing the developed research model in PLS-SEM inclusive of (i) specify the structural model; (ii) identifying the measurement model; (iii) data collection; (iv) estimation of path model; (v) assessing the the measurement model; (vi) assessing the structural model; and (v) interpretation of the results.
The empirical data used in testing the developed research model was gathered from Al-Zawiya Steam Power Plant, Libya. The data consists of 12 indicators variables with 60 observations. The indicator variables are listed in Table 1. The empirical data was analyzed by utilizing SmartPLS 3.0.
Table 1. Indicator Variables of Energy Generation Model
IV. FINDINGSANDDISCUSSIONS
A. The Input and Output Measurement and Structural Model
The research model comprised of measurement and structural model. There were six measurement models in this study that describe the relationship between latent variables and indicator variables. The measurement model with its indicator variables shown in Fig. 2 was DW (D1 and D2); SP (S1 and S2); CA (C1, C2, C3 and C4); MO (M1 and M2); and Output (O1 and O2). The structural model was the path diagram that linked DW and Output; SP and DW; SP and CA; SP and Output; CA and DW; CA and Output; MO and DW; MO and SP; MO and CA; and MO and Output.
[image:2.595.73.268.251.401.2]
Fig 2. PLS-SEM Input and Output Causal Relationship of Energy Generation Model
B. Assessing the Reliability and Validity of the Measurement Model
The measurement model of energy generation model was assessed by means of its reliability and validity. As stated by [15] the reliability of the measurement model in PLS-SEM can be evaluated based on (i) internal consistency by examining the values of Alpha Cronbach (α) and Composite Reliability (CR); and (ii) reliability of each indicator variables by examining the outer loading value. While the validity of the measurement model can be evaluated based on (i) convergence validity by examining the value of Average Variance Extracted (AVE); and (ii) discriminant validity based on cross-loading of indicator variables and Fornell-Larcker criterion.
The finding revealed that the α and CR value for DW, SP, CA, MO, and Output constructs exceeded 0.70 as shown in Table 2. This shows that the indicator variables in each construct are sufficient to measure the respective constructs. Meanwhile the reliability value based outer loading value for each indicator variable (scale-item) were also greater than 0.70. This indicates that the indicator variables (D1, D2, S1, S2, C1, C2, C3, C4, M1, M2, O1, and O2) are sufficient to represent their respective constructs.
International Journal of Innovative Technology and Exploring Engineering (IJITEE) ISSN: 2278-3075, Volume-8 Issue-12, October 2019
[image:3.595.59.280.171.296.2]In assessing the the convergence validity of DW, SP, CA, MO and Output, the AVE was utilized. The study revealed that the value of AVE for all the latent variables were exceeded 0.50. As stated by [16], the AVE value of greater than 0.50 indicates the validity of each construct is achieved.
Table 2. Outer Loading, Indicator Reliability, Cronbach Alpha, Composite Reliability and Average Variance
Extracted Value for Energy Generation Model
[image:3.595.305.531.309.387.2]The cross loading of each indicator variables were used to determine the discriminating validity. The discriminant validity value shows the extent to which the items used to measure a construct differ from the other constructs. The result of the study as shown in Table 3 revealed that the indicator’s outer loading on the associated construct were greater than all of its loadings on other constructs (the cross loading). This indicates that the indicator variables which represent its constructs are distinct from each other by empirical standards. In addition, the square root of AVE for each construct was greater than the value of the corresponding coefficient in the respective row and column as shown in Fornell-Larcker criterion. In response to the Fornell-Larcker criterion, the discriminating validity for the DW, SP, CA, MO, and Output is achieved. As suggested by [15], it can be concluded that all the measurement model is acceptable based on the evaluation criteria stated in PLS-SEM.
Table 3. Fornell-Larcker Criterion and Cross Loadings Results
C. Assessing of the Structural Model
The structural model in this study was assessed by examining the collinearity between constructs, the significance of the path coefficient, the coefficient of determination (R2) value and the predictive relevance (Q2) value as suggested by [15].
Collinearity Between Predictor Constructs in Structural Model
The Variance Inflation Factor (VIF) of each set of the predictor constructs (latent exogenous) in structural model was examined in order to assess the collinearity. According to [15], the VIF value of less than 5.000 indicates no collinearity between predictor constructs in the structural model. The VIF value of this study is depicted in Table 4, where the VIF value for all the predictor constructs ranges from 1.166-2.803. This indicates that there are no collinearity (redundancy) between all the predictor constructs in its respective structural model.
Table 4. The Variance Inflation Factor of the Predictor Constructs (Latent Exogenous)
The Significance of the Path Coefficient
The significance of the path coefficient was assessed by utilizing the bootstrapping method. Fig. 3 shows the result of PLS-SEM bootstrapping analysis of energy generation model in which 12 cases was run using 5000 bootstrapped samples as recommended by [15].
Fig. 3. Bootstrapping Results for the PLS-SEM
[image:3.595.316.548.477.658.2]Output of Energy Generation Model
Table 5. The Relationship between Latent Constructs
* sig. at α=0.05; ** sig. at α=0.001
The Coefficient of Determination, R2 Value
The amount of variation in DW, CA, and Output endogenous latent variables described by its predictor variables can be evaluated by means of the R2 value. The study revealed that the R2 value for DW, SP, CA, and Output were 0.688, 0.158, 0.591 and 0.850 respectively as depicts in Fig. 2. This implies that 68.8%, 15.8%, 59.1% and 85.0% of variation in DW, SP, CA, and Output respectively was explained by the variables in the respective model. In conclusion, the DW, SP, CA, and Output structural models describe reasonably well the amount of variation explained by its exogenous constructs.
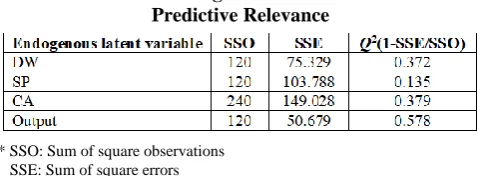
Predictive Relevance, Q2 Value
[image:4.595.48.287.493.581.2]In addition to R2 value, the blindfolding procedure was performed to calculate the predictive relevance (Q2) of the model fit. The Q2 shows how well observed values/indicator variables are reconstructed by the model and the parameter estimates [17]. [15] stated that Q2 is deemed to be of predictive significance higher than zero. The results of blindfolding of the measure of predictive relevance is shown in Table 6.
Table 6. Blindfolding Results of the Measure of Predictive Relevance
* SSO: Sum of square observations SSE: Sum of square errors
The study revealed that all the Q2 value were greater than zero for cross-validated redundancy. According to [15], Q2 value above zero providing support for the model’s predictive relevance regarding to its endogenous latent variables (DW, SP, CA and Output).
V. CONCLUSION
The study successfully developed and evaluated the input and output causal relationship of energy generation model by utilizing PLS-SEM. The research data collected from Al-Zawiya Steam Power Plant, Libya was used to validate the measurement and structural model of the developed model and fulfilled the criterion suggested by [15]. The study withal designate that the relationship of input latent variables (DW, SP, CA and MO) and output latent variable was statistically
studies such as [20] and [21].
In conclusion, the results indicated that the developed model was reinforced by an empiric assessment and parallel to the preceding findings and theoretical framework.
ACKNOWLEDGMENT
The authors wish to acknowledge the support of Universiti Pendidikan Sultan Idris, Malaysia in the completion of this study.
REFERENCES
1. P. Breeze, “The cost of power generation: the current and future competitiveness of renewable and traditional technologies.” Warwick: Business Insights, 2010.
2. X. Zhao, X. Xia and G. Yu, “Primal-dual learning based risk-averse
optimal integrated allocation of hybrid energy generation plants under uncertainty.” Energies, 2019; 12(12), 2275.
3. Y. Huang, K. Yang, W. Zhang and K.Y. Lee, “Hierarchical energy
management for the multienergy carriers system with different interest bodies.” Energies, 2018; 11(10), 2834.
4. C. Chen, H. Long and X. Zeng, “Planning a sustainable urban electric
power system with considering effects of new energy resources and clean production levels under uncertainty: a case study of Tianjin, China.” Journal of Cleaner Production, 2018; 173, 67-81.
5. S.C. Parkinson and N. Djilali, “Long-term energy planning with
uncertain environmental performance metrics.” Applied Energy, 2015; 147, 402-412.
6. H. Thomas, A. Marian, A. Chervyakov, S. Stuckrad, D. Salmieri and
C. Rubbia, “Superconducting transmission lines - sustainable electric energy transfer with higher public acceptance?” Renewable and Sustainable Energy Reviews, 2016; 55, 59-72.
7. L. Wu, Y. Hu and C. Gao, "Optimum design of cogeneration for power and desalination to satisfy the demand of water and power." Desalination, 2013; 324, 111-117.
8. K. Soman, “Thermal engineering.” New Delhi: PHI Learning, 2011.
9. S.A. Kalogirou, “Solar energy engineering: processes and systems.”
Waltham: MA, Academic Press, 2013.
10. A.A. Al-Karaghouli, L.L Kazmerski, “Renewable energy opportunities
in water desalination.” In Desalination, trends and technologies, M. Schorr, Ed. Rijeka, Croatia: InTech, 2011, 149-184.
11. S. Lattemann and T. Höpner, “Environmental impact and impact
assessment of seawater desalination.” Desalination, 2008; 220(1-3), 1-15.
12. E.B. Woodruff, H.B. Lammers and T.F. Lammers, “Steam power plant
operation (10th edition).” New York, NY: McGraw-Hill, 2017.
13. M.S. Murthy, Y.S. Patil, S.V.K. Sharma, B. Polem, S.S. Kolte and N.
Doji, “Revolving doors producing green energy.” IEEE Conference on Clean Energy and Technology (CET), 2011; 157-160.
14. E. Cardona and A. Piacentino, “Optimal design of cogeneration plants
for seawater desalination.” Desalination, 2004; 166, 411-426.
15. J.F. Hair, G.T.M. Hult, C.M. Ringle and M. Sarstedt, “A primer on
partial least squares structural equation modelling (PLS-SEM).” Thousand Oaks, California: SAGE Publications, 2014.
16. C. Fornell and D.F. Larcker, “Evaluating structural equation models
with unobserable variables and measurement error.” Journal of Marketing Research, 1981; 18(1), 39-50.
17. V.E. Vinzi, W.W. Chin, J. Henseler and H. Wang, “Handbook of
partial least squares: concepts, methods and applications.” Heidelberg: Springer, 2010.
18. T. Inoue and K. Yamad, “Economic evaluation toward zero CO2
emission power generation system after 2050 in Japan.” Energy Procedia, 2017; 142, 2761-2766.
19. G.G. Diego, M.G. Mario, I. Diego and D. Javier, “Prospective analysis
of life-cycle indicators through endogenous integration into a national power generation model.” Resources, 2016; 5(4), 39.
20. A. Herbst, F. Toro, F. Reitze and E. Jochem, “Introduction to energy
International Journal of Innovative Technology and Exploring Engineering (IJITEE) ISSN: 2278-3075, Volume-8 Issue-12, October 2019
21. C.G. Hans, S. Yvonne, P. Thomas, T. Diego Luca de and H. Dominik,
“Integrated modelling of variable renewable energy-based power supply in Europe.” Energy, 2017; 123, 173-188.
AUTHORS PROFILE
Fadya Ramadan Shakhim received a Bachelor in Statistics from University of Zawia (previously known as Seventh of April University), Libya and a Master of Science and Techonolgy in Statistics from Universiti Kebangsaan Malaysia. She completed her PhD degree in Applied Statistics from Universiti Pendidikan Sultan Idris, Malaysia. She is working at the University of Zawia, Libya as an assistant lecturer. She has been teaching subjects such as Probability Theory and Tests of Statistical Hypotheses. Her research interest is in Robust Statistics.