Enhancing Packet Delivery Ratio and a lifetime of
Wireless Sensor Networks using
Energy-Efficient
Unequal Clustering Routing Algorithm
Priyanka Handa, Tripatjot Singh Panag, Balwinder Singh Sohi
Abstract-Sensors are regarded as significant components of electronic devices. The sensor nodes deployed with limited resources, such as the power of battery inserted in the sensor nodes. So the lifetime of wireless sensor networks(WSNs) can be increased by using the energy of the sensor nodes in an efficient way. A major part of energy is consumed during the communication of data. Also, the growing demand for usage of wireless sensors applications in different aspects makes the quality-of-service(QoS) to be one of the paramount issues in wireless sensors applications. QoS guarantee in WSNs is difficult and more challenging due to the fact that the sensors have limited resources and the various applications running over these networks have different constraints in their nature and requirements. The packet delivery ratio(PDR) is a major factor of QoS. To achieve high QoS the packet delivery ratio should be maximum. The energy-efficient unequal clustering routing protocol (EEUCR) is evaluated and results show that it enhances the packet delivery ratio(PDR) and a lifetime of WSNs. In this protocol, the area of the network is divided into a number of rings of unequal size and each ring is further divided into a number of clusters. Rings nearer to the base station(BS) have smaller area and area of rings keeps on increasing as the distance from BS increases for balanced energy consumption. The nodes with heterogeneous energy are deployed in the network. Nodes nearer to the base station have higher energy as compared to farther nodes. Static clustering is used but cluster heads(CHs) are not fixed and are elected on the basis of remaining energy. This helps to increase lifetime of EEUCR. PDR of EEUCR is improved because multiple rings help to find better route which further aids to ensure safe reception of packets at the destination. Simulation results are compared with existing protocols and show that this algorithm gives better results.
Keywords: network lifetime, packet delivery ratio, quality-of-service, unequal clustering, wireless sensor networks.
I. INTRODUCTION
The WSNs are defined as a very large number of nodes that are connected to each other so that nodes can sense and collect the environmental data, communicate with each other and can process that data. The sensors are usually deployed into the scattered area, known as sensor field. The data gathered by sensors from an environment is forwarded to the BS through multi-hops or single-hop. The BS, also known as the sink, generally communicates with the users
through a satellite or an internet connection[1].
Revised Manuscript Received on October 05, 2019.
Priyanka handa*, Electronics and communication engg., research scholar at IKGPTU, Jalandhar, Punjab, INDIA..Email: [email protected]
Tripatjot singh panag, Electronics and communication engg., BBSBEC, Fatehgarh Sahib, Punjab, INDIA.. Email: [email protected]
Balwinder Singh Sohi, Electronics and communication engg., CGC,Gharuan, Mohali, Punjab, INDIA. Email: [email protected]
Long-lived networks are the prime objective of the researchers. Routing protocols should find the energy-efficient path to deliver the data to the BS. Also delivered data must be of high quality. The high QoS is necessary to guarantee the expected results provided by the network. QoS can achieve the following tasks.
Offer high-level services even when data is of different
types like video, audio, and images or VOIP.
Uses network resources very carefully and can
differentiate data as per the importance and priorities of that data.
The limited resources of the network such as bandwidth,
energy are managed efficiently.
WSNs are used for a wide range of applications and each application has its own QoS requirements such as delay sensitivity, network lifetime, fault tolerance, throughput and PDR, etc. Routing techniques play a major role to improve the QoS of the network. These protocols are called QoS Based routing protocols. QoS is an umbrella term for a group of technologies that permit network-sensitive applications to demand and receive expected services levels in terms of QoS requirements. The network's capability to offer superior services is measured as QoS of the network. However, in WSNs every class of application also has some common requirements. So the network must fulfill the QoS needs while transmitting the sensed data from the sensor field to the BS. The basic QoS issues in WSNs are described below in detail [1-4].
Limited resources and capabilities: The WSNs have
limited resources such as memory, bandwidth, power, and processing capabilities. So QoS can be improved by taking care of both QoS level and energy level consumption.
Node deployment: The sensor node deployment is an
important and critical task in WSNs. The proper deployment can improve the QoS of WSN.
Dynamic network topology: The topology of WSNs may
be dynamic or static. When WSNs are mobile then topology of the network is dynamic. The QoS in mobile networks is a common issue and can be solved by improving the communication between the nodes.
Scalability: WSNs should be scalable. The QoS should
not be affected by changing the number of sensor nodes in WSNs.
Multi-source Multi-sink: If WSNs are using multi-source
multi-sink then it should capable to maintain the diversified level of QoS supports.
Various traffic types: The data generated by sensor nodes
may be different types such as image, video, audio, etc. So, if the WSNs are able to process the data in an equally efficient manner then QoS
Less reliable medium: The WSNs can transfer their data by radio. The Radio channels are noisy and cross-signal interference is more.
Redundant Data: Sensor nodes are densely deployed so
they can generate redundant data. If the same data is transmitted many times then the energy of the network will be wasted and also it can arise more issues such as congestion.
A lot of work has been done in the last few years in the field of WSNs. We reviewed some of the most relevant papers. Handa et al.[1] described different types of WSNs. They presented a survey of layers of WSNs and also discuss open research issues of different layers. The applications and challenges of WSNs are explained. Asif et al.[2] focused on the QoS satisfaction in WSNs, basics of QoS support in WSNs, and more importantly challenge, requirements of QoS at each layer. They also review the QoS protocols and categorize the QoS aware protocols and elaborate on their
pros and cons. Heinzelman et al.[5] introduced adaptive
clustering first time. This is a single-hop communication algorithm. In this protocol every node has the same probability to be elected as cluster head irrespective of remaining energy. TDMA( time division multiple access) is used for intra-cluster communication. Handa et al.[6] introduced EEUCR. This is a ring-based routing algorithm. The nodes deployed in the sensor field are heterogeneous energy nodes. The area of the sensor field is divided into five rings. Radii of rings decrease as they approach BS. Nodes deployed in ring0 and ring1 are supernodes having energy two times greater than the nodes deployed in rings 2, 3 and 4. Fissaoui et al.[7] is an energy-efficient and fault-tolerant distributed algorithm for data aggregation in wireless sensor networks (EFTA) to plan the itinerary for a mobile agent and another alternative itinerary in case of node(s) failure. This algorithm adopts a clustering method to group sensor nodes in clusters then plans the itinerary among those clusters efficiently. It consists of three phases: (1) sensor nodes grouping in clusters. (2) Itinerary planning
among cluster heads. (3) Mobile agent migration.Nawar et
al.[8] designed an enhancement LEACH protocol. This
protocol considers energy and distance to choose best cluster head. This protocol after enhancement, similar to the original LEACH divides the nodes into clusters, each containing a cluster head whose task is considerably more energy-intensive than the rest of the nodes. Baz et al.[9] proposed Node Ranked–LEACH (NR‐LEACH) that enhances the performance of the LEACH protocol. This enhancement is based on distributing the energy load among the sensor nodes by using a node rank algorithm(NRA) used to elect the CH. The operation of this protocol is divided into rounds. The process of CHs election in the proposed algorithm is depending on node rank calculation. CH election is based on evaluation of each node by calculating
its weight. Panag et al.[10] proposed dual-head static
clustering algorithm to balance energy consumption by the sensor nodes. In this protocol two nodes in a cluster are selected as the CHs on the basis of remaining energy and distance from the BS and other nodes within the cluster. One CH is responsible for aggregation of data and second CH is responsible for the transmission of data to BS. Zhu et al.[11] described Hausdorff clustering and minimum energy routing for wireless sensor networks use a three-part distributed approach. First, the nodes are organized into static clusters using the Hausdorff clustering algorithm based on location,
communication efficiency, and network connectivity. This is followed by the selection of cluster heads. The cluster head role is scheduled among the cluster members using a greedy algorithm that selects the cluster heads based on the residual energy and the proximity of the nodes. Finally, these cluster heads form a backbone network to transmit the periodically gathered data to the sink using the minimum energy routing based on Bellman-Ford’s algorithm. Ferng et al[12] proposed ERPSCDS uses randomly distributed virtual points to divide the network into static clusters. Each node identifies its nearest virtual point to form a cluster. A node is selected to be the cluster head on the basis of its residual energy and its distance from the virtual point. Data from a CH to the sink is transmitted either directly or via multi-hop communication depending on the distance between the CH and the sink.
In this paper, EEUCR[6] is evaluated. The EEUCR uses the concept of unequal clustering, heterogeneous energy nodes, and multi-hop communication. The PDR of WSNs is improved and also the lifetime of the network increased in terms of first node dead(FND) as shown by simulation results.
This paper is organized as follows. Section II explains the network architecture of EEUCR. Section III shows the simulation results. Section IV concludes the paper and discuss future scope.
II. NETWORK ARCHITECTURE
The EEUCR[6] is a ring-based unequal clustering routing algorithm. The network region is divided into five rings. Radii of rings are non-uniform and decrease as distance of rings to BS decreases. The following Fig.1 shows the network architecture of EEUCR. It shows five rings of unequal sizes.
Fig.2. Flowchart of EEUCR
Fig.2 represents the flow chart of the process of EEUCR. Heterogeneous energy nodes are deployed in the network. The area of the network is divided into two zones As and An. where, As is an area where supernodes are deployed i.e. area of ring r0 & r1. An is an area where normal nodes are deployed i.e area of rings r2 , r3 & r4. The number of nodes in zone As and An are proportional to their respective area.
Value of q is such choosen that ratio of number of nodes in
As to number of nodes in An is 1:4. The communication energy consumption model used is given by equations 1 to 4
[5]. To transmit k-bit messages over a distance d, the energy expended by the radio is given by following equations:
(1)
(2)
(3)
where d0= (4)
Equation 1 and 2, shows energy consumption for data transmission. where, represent energy consumption
for the transmission of k bits and d) is energy
consumption for the amplification of k bits. The transmitter and receiver are apart by a distance(d). Equation 3, shows energy consumption for the reception of k bits. Energy consumption for the transmission increases with the increase of distance for the transmission. If d <d0 it will be single-hop communication but if d d0 then there will be multi-hop communication.
III. SIMULATION RESULTS AND DISCUSSION
The following parameters are measured by the simulations.
Packet delivery ratio (PDR): The fraction of packets
sent by the application that is received by the receivers. PDR is computed using the following equation.
(5)
(6)
where is the number of packets received by
destination node BS and is the number of packets sent
by sender node x. Ns is the set of sender nodes.
The lifetime of the network: Lifetime is the major
criterion for evaluating the performance of sensor networks. The lifetime of WSNs is the time between the start of the first communication round and the round when first node dies. The first node dead (FND) will result in area partitioning, so the information from that area cannot be gathered.
MatlabR2015b is used for execution of EEUCR. A number of experiments have been conducted to evaluate the performance of the proposed protocol. The algorithm has been tested for its ability to increase the PDR of a WSN and
to enhance the lifetime of the network. The following
different scenarios are used to check the values of PDR. A set of different protocols is used for comparison because the results of the same protocols are not available for two
scenarios. The Table-I shows values of the energy of ES and
E0 for deployment of 300 nodes and 100 nodes for scenario1
and 2 respectively. The total energy of the network will be dependent on the total number of nodes deployed and
[image:4.595.316.529.64.262.2]accordingly, the energy of Es and E0 will vary.
Table –I: Parameters used for the simulation in two different scenarios for comparison of PDR
Parameter
Values Scenario1 Scenario2 d0 36.17m 36.17m
Network diameter 500m 600m
Base station location 250,250 300,300
rm 250 300
The total energy of the network
18720j x No. of nodes(E0 and Es will
vary as the number of nodes varies)
0.5j x No. of
nodes(E0 and Es will
vary as the number of nodes varies)
Data packet size 8000bytes 1024bytes
E0
15600j for 300
nodes 0.42j for 100 nodes
Es
31200j for 300
nodes 0.84jfor 100 nodes
EDA 5nj/bit 5nj/bit
Control packet size 400bit 400bit
ETx_amp 0.014pj/bit 0.014pj/bit
ETx 50nJ/bits 50nJ/bits
ERx 50nJ/bits 50nJ/bits
Efs 6.37x10⁻² nj/bit/m2 6.37x10⁻² nj/bit/m2
Emp 4.87x10⁻⁵nj/bit/m4 4.87x10⁻⁵nj/bit/m4
Number of nodes 300-800 10-250
A. PDR of EEUCR for scenario1and scenario2
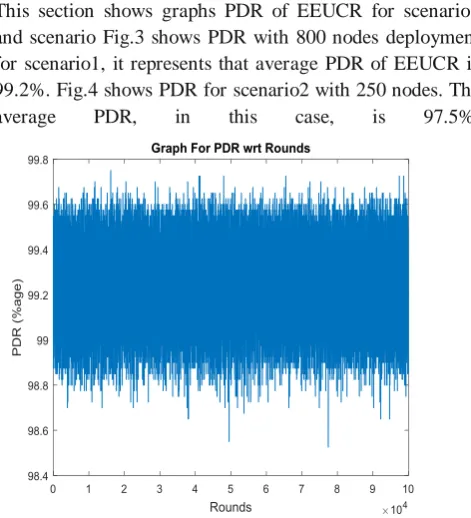
This section shows graphs PDR of EEUCR for scenario1 and scenario Fig.3 shows PDR with 800 nodes deployment for scenario1, it represents that average PDR of EEUCR is 99.2%. Fig.4 shows PDR for scenario2 with 250 nodes. The
[image:4.595.51.289.177.426.2]average PDR, in this case, is 97.5%.
[image:4.595.50.286.450.709.2]Fig.3. PDR of EEUCR with 800 nodes as per scenario1
Fig 4. PDR of EEUCR with 250 nodes as per scenario2
B. Comparison of PDR of EEUCR with existing protocols for scenario1
In this section, a comparison of the performance of the EEUCR with existing protocols for scenario1 is described.
Results of PDR of EEUCR are compared with EFTA[7] and alternative EFTA[7]. Results are shown
in Fig.5 and Table-II. The EEUCR performs better than EFTA and alternative-EFTA. In alternative-EFTA for 300 nodes PDR is around 80% and for 400 nodes PDR is around 87%. PDR for 500, 600, 700 and 800 nodes is 85%, 90%, 87% and 90% respectively. In EFTA for 300 nodes PDR is around 84% and for 400 nodes PDR is around 87%. PDR for 500, 600, 700 and 800 nodes is 88%, 91%, 92% and 93% respectively. The PDR of EEUCR for 300 nodes is 97.5% and for 400 nodes PDR is around 98.3%. PDR for 500, 600, 700 and 800 nodes is 98.8%, 99%, 99.1%, and 99.2% respectively. Results for scenario1 show that EEUCR performs better than EFTA and alternative-EFTA.
[image:4.595.316.540.507.681.2]
TableII. Approximate values of PDR of Alternative EFTA, EFTA, EEUCR as per scenario1.
Number of nodes
Alternative-EFTA EFTA EEUCR
300 80 84 97.5
400 87 87 98.3
500 85 88 98.8
600 90 91 99
700 87 92 99.1
800 90 93 99.2
C. Comparison of PDR of EEUCR with existing protocols for scenario2
This section represents a comparison of the performance of
the EEUCR with existing protocols for scenario2. Results of
PDR are compared with LEACH[5], LEACH-E[8], NR-LEACH[9] and are shown in Fig.6 and Table-III. The values of existing protocols are taken from NR-LEACH[9]. The comparison shows that EEUCR performs better than other protocols when deployed nodes are greater than 25. The performance of EEUCR is poor than other protocols when deployed nodes are less than 25.
Fig.6. Comparison of PDR of EEUCR with LEACH,
LEACH-E, NR-LEACH as per scenario2
Table-III. Approximate values of PDR of LEACH, LEACH-E, NR-LEACH, EEUCR as per scenario2
Number
of nodes LEACH LEACH-E
NR-LEACH EEUCR
10 90.9 92 94 40
25 78 78 85 70
50 38 43 72 88
75 38 41 74 92
100 17 22 75 95
150 35 37 77 96
200 29 31 71 97
250 7 12 59 97.6
Table–IV: Parameters used for the simulation in two different scenarios for comparison of lifetime
Parameter
Values Scenario1 Scenario2 d0 36.17m 36.17m Network
diameter 100m 350m
Base station
location 50, 50 175,175
rm 250 300
The total energy of the network
2j x No. of nodes(E0 and Es
will vary as the number of nodes varies)
5j x No. of nodes(E0 and Es
will vary as the number of nodes varies)
Data packet size 125bytes 525bytes
r0 25 30
E0
1.67j for 300 nodes
0.42j for 100 nodes
Es
3.34j for 300 nodes
0.84j for 100 nodes
q 0.5 0.5
EDA 5nj/bit 5nj/bit
Control packet
size 25byte 25byte
ETx_amp 0.014pj/bit 0.014pj/bit
ETx 50nJ/bits 50nJ/bits
ERx 50nJ/bits 50nJ/bits
Efs 6.37x10⁻² nj/bit/m2 6.37x10⁻² nj/bit/m2 Emp 4.87x10
-5nj/bit/m4 4.87x10 -5nj/bit/m4
Number of
nodes 300-700 300-700
D. Lifetime of EEUCR
The network lifetime is defined as number of
communication rounds before FND. After the death of first node, some areas will be partitioned because the information from that area can not be detected. So the lifetime of WSN
is the time before the death of first node. Following
Table-IV enlist the parameters used for simulation for two different scenarios. Results of protocols used for comparison with EEUCR are taken from DHSCA[10]. To take the values of FND of EEUCR is simulated 300-700 nodes deployment for scenario1 and scenario2.
E. Comparison of the lifetime of EEUCR with existing protocols for scenario1
In this section, EEUCR is compared with DHSCA[10], ERP-SCDS[11], Hausdorff[12] as per scenario1. The results of the comparison are shown in Fig.7 and Table-V. Results depict that EEUCR performs better than all other protocols. After simulation of EEUCR it is found that first node dies around 24000 rounds for 300-700 nodes deployment. The DHSCA's first node dies around 15000 communication rounds in every case of node deployment. Results of ERP-SCDS and Hausdorff show that the first node dies after 2800 and 2000 communication rounds respectively.
TableV. Approximate values of the lifetime(FND) of EEUCR, DHSCA, ERP-SCDS, Hausdorff as per scenario1.
number of
nodes EEUCR DHSCA
ERP-SCDS Hausdorff
300 25000 15665 2823 2042
350 24550 14995 2824 2163
400 24256 15689 2825 2093
450 24263 15022 2824 2042
500 23360 15033 2823 2042
550 24225 15045 2824 2042
600 23784 15347 2823 2042
650 24250 15165 2823 2042
Fig.7. Comparison of lifetime of EEUCR with existing protocols as per scenario1
F. Comparison of lifetime of EEUCR with existing protocols for scenario2
In this scenario, EEUCR is compared with the same set of protocols as was compared in scenario1. Results are shown in Fig.8 and Table-VI. In this scenario,
Fig.8. Comparison of the lifetime of EEUCR with existing protocols as per scenario2
EEUCR performs better than all other protocols. The values of EEUCR show that the first node dies between 5260 to 5460 communication rounds for 300 to 700 nodes deployed. For DHSCA first node dies between 4820 to 5393 communication rounds. The values of FND for ERP-SCD and Hausdorff are between 576 to 707 and 168 to 235 communication rounds respectively.
TableVI. Approximate values of the lifetime(FND) of EEUCR, DHSCA, ERP-SCDS, Hausdorff as per
scenario2
number of
nodes EEUCR DHSCA
ERP-SCDS Hausdorff
300 5260 4820 576 168
350 5273 4993 577 206
400 5289 5165 648 242
450 5300 5100 630 250
500 5312 5130 690 253
550 5350 5081 728 280
600 5415 5250 700 220
650 5436 5280 737 230
700 5460 5393 707 235
IV CONCLUSION AND FUTURE SCOPE
EEUCR is an unequal clustering based routing protocol to balance the energy consumption among nodes. The sensor field is divided into rings of unequal size, this helps to save energy of nodes nearer to BS. Heterogeneous nodes are deployed in the sensor field. In the ring 1 and 2 supernodes are deployed and in all other rings, normal nodes are deployed. This routing algorithm reduces the overhead of relay traffic to balance energy consumption and further increases the lifetime of the network. Results for PDR of the proposed protocol are compared with existing protocols in two different scenarios. For scenario1 PDR of EEUCR is compared with EFTA and alternative EFTA. The PDR of EEUCR is better than all other protocols. The PDR of EEUCR is compared with LEACH, LEACH-E, NR-LEACH in scenario2. The performance of EEUCR during scenario2 is better than other protocols except the number of nodes deployed is less than 25. Also, results of lifetime of EEUCR are compared with DHSCA, ERP-SCD, and Hausdorff in two scenarios. The lifetime of EEUCR in both scenarios show better performance than the existing protocols. The authors are working to extend this work to reduce propagation delay of WSNs.
REFERENCES
1. P. Handa, B.Sohi A Survey on Various Layers of Wireless Sensor Networks, Journal of Mobile Computing, Communications & Mobile Networks, Vol 2, issue2, 2015, pp1-9.
2. M. asif, S. khan, R. ahmad, M. sohail, and D. singh, (senior member, ieee), “Quality of service of routing protocols in wireless sensor networks: a review,” IEEE access, 2017.
3. J. Balen, D. Zagar, and G. Martinovic, “Quality of service in wireless sensor networks: A survey and related patents,'' Rel. Patents Comput. Sci., vol. 4, no. 3, 2011, pp. 188_202.
4. B. Bhuyan, H. K. D. Sarma, N. Sarma, A. Kar, and R. Mall, “Quality of service (QoS) provisions in wireless sensor networks and related challenges,” Wireless Sensor Netw., vol. 2, no. 11, , 2010, pp. 861-868.
5. W. Heinzelman, A. Chandrakasan and H. Balakrishnan, “Energy efficient communication protocols for wireless microsensor networks,” in: Proceedings of the 33rd Hawaiian International Conference on Systems Science, 2000.
6. P.Handa, T.S. Panag, B.S. Sohi, “Energy efficient unequal clustering routing algorithm for WSNs,” IJRTE, vol. 8, issue 3, 2019, pp.5540-5548, DOI:10.35940/ijrte.C5476.098319.
7. M. E. Fissaoui , Abderrahim Beni‑Hssane, Mostafa Saadi, “Energy efficient and fault tolerant distributed algorithm for data aggregation in wireless sensor networks,” Journal of Ambient Intelligence and Humanized Computing 2018, Springer.
8. N. M. Nawar, S. E. Soliman, N. M.ayad, H. S. El-sayed, and M. H. Kelash. , “Enhancement of mobility model for cluster hierarchical routing protocol for wireless sensor networks,” Int J Comput Appl (IJCA), 2014, volume 94, issue 9, pp12‐16.
9. A. A. Baz, A. E. Sayed, “A new algorithm for cluster head selection in LEACH protocol for wireless sensor networks,” Int J Commun Syst, Wiley, 2017.
10. T. S. Panaga, J.S. Dhillon, “ Dual head static clustering algorithm for wireless sensor networks,” Int. J. Electron. Commun. (AEÜ) , 2018, Pp148–156.
11. Zhu X, Shen L, Yum T.SP., “ Hausdorff clustering and minimum energy routing for wireless sensor networks,” IEEE Trans Veh Technol 2009.
Author-2 Photo
hoto
hoto
AUTHORSPROFILE
Priyanka Handa received her B.E. in Electronics and
Communication Engineering from MDU, Rohtak in 2006 and M.E. in Electronics and Communication Engineering from Panjab University, Chandigarh in 2010. She is pursuing her Ph.D. from I. K. Gujral Punjab technical university, Jalandhar. At present, she is working as an Assistant Professor in the Department of Electronics and Communication Engineering at Ch. Devi Lal State Institute of Engg. And Technology, panniwala mota, Haryana, India. She is having 10 years of teaching and research experience. Her areas of research is Wireless Sensor Networks and Optimization techniques. She is a life member of Indian Society for Technical Education (ISTE).
Tripatjot Singh Panag obtained his Bachelor’s degree in
Electronics and Communication Engineering from Guru Nanak Dev Engineering College (GDNEC), Ludhiana, Punjab, in May 2001 and Master's degree in Electronics and Communication Engineering from Baba Banda
Singh Bahadur Engineering College (BBSBEC),
Fatehgarh Sahib, Punjab, in April 2008. He completed his Ph.D. from Sant Longowal Institute of Engineering and Technology, Longowal, Punjab in November 2017. At present he is working as an Assistant Professor in the Department of Electronics and Communication Engineering at Baba Banda Singh Bahadur Engineering College (BBSBEC), Fatehgarh Sahib, Punjab, India. He is having 16 years of teaching and research experience. His areas of interest are Wireless Communication, Data Communication Networks, Digital System Design, Wireless Sensor Networks, and Optimization techniques. He is a life member of Indian Society for Technical Education (ISTE).
Balwinder Singh Sohi received his B.Sc. Engineering,
Masters of Engineering and Ph.D. in Electronics from Panjab University, Chandigarh, India in 1971, 1981 and 1992 respectively. He is the former Director of University Institute of Engineering and Technology, Panjab University. He is recipient of ‘The Sir Thomas Ward Memorial Prize’ of Institute of Engineers, Kolkata, in 2004 and 2005. He is a senior member of IEEE, fellow of Institution of Engineers, Life Member of ISTE. Presently he is working as director at Chandigarh Group of Colleges, Gharuan, Punjab. He has more than hundred research publications in various reputed journals and conferences. His areas of research are microprocessors and their applications, biomedical instrumentation,
wireless networking, computer networking, microwave and RF