International Journal of Innovative Technology and Exploring Engineering (IJITEE) ISSN: 2278-3075, Volume-8 Issue-12, October 2019
Abstract: This research intends to accurately mapping the Curve Number (CN) that is as the function of cover type, land use treatment, hydrology condition, and hydrologic soil group in the Lesti sub-watershed,. The methodology consists of to build the suitable CN modeling for predicting discharge in the Lesti sub-watershed and then to evaluate the result accurately. The value of CN is obtained from the mathematical formula with the input is rainfall depth and discharge. The result of CN modeling for the Lesti sub-watershed is accurate enough as is made by the United States Department of Agriculture (USDA) in USA. In addition, the CN mapping can be directly used by the engineers of the manager and designer on the water resources structures in Lesti sub-watershed.
Keywords: Curve Number (CN), hydrology, Lesti, zone-CN
I. INTRODUCTION
One of the important unsure in hydrology cycle is how can be determined the surface run-off and when it arrived at a point of observation [1]. To know the surface run-off and design flood with the certain return period in hydrology, there has been developed several models and methods. If the input is yearly design flood that can be obtained from the record of Automatic Water Level Recorder (AWLR), so by using the frequency analysis, it can be analyzed the design flood with the certain return period. The frequency analysis that can be used is Gumbel, Pearson, Log Pearson-III methods [1]. If there is not available data from AWLR, so by using the hourly rainfall or design rainfall with the certain return period, it can also be analyzed the design flood by using the method of Synthetic Unit Hydrograph (SUH).. In Indonesia, there are some methods that are widely used such as SUH of Snyder, Nakayasu, Gama, Limantara, and ITB. Due to the hydrographs that are developed, it will be known the design flood and when the flood arrived. Ideally, every watershed has its own SUH [2][3][4] that are developed from the specific data of the watershed. Until now, there has not been hydrograph data for a certain watershed. All of them are still tailor made
Revised Manuscript Received on October 05, 2019.
* Correspondence Author
Abdul Azis Hoesein*, 1Doctoral Program in the Department of Civil Engineering, Faculty of Engineering, University of Brawijaya, Malang, Indonesia. Email: [email protected]
Mohammad Bisri, Department of Water Resources, Faculty of Engineering, University of Brawijaya, Indonesia Indonesia. Email: [email protected]
Lily Montarcih Limantara, Department of Water Resources, Faculty of Engineering, University of Brawijaya, Indonesia Indonesia. Email: [email protected].
Ery Suhartanto, Department of Water Resources, Faculty of Engineering, University of Brawijaya, Indonesia Indonesia. Email: [email protected]
The United States Department of Agriculture (USDA) through the Natural Resources Conservation Service (formerly is Soil Conservation Service/ SCS) has developed the method of Run-off Curve Number [5] and it has been widely used in USA. SCS-USDA has mapped the Run-off Curve Number (in further is mentioned as Curve Number or CN) until to the sub-watershed level [6][7] and it has been accurately proved. The use of CN has been very applicable. An engineer has been able directly to calculate the run-off that is caused by the rainfall with the certain depth [8].
The research about CN is carried out by Nuraeni et.al (2002) in upstream Bengawan Solo by using daily rainfall, data of AWLR, land use, and minimum infiltration rate. They expressed that there is strong correlation between flood as the prediction and observed result. As known that the method of run-off Curve Number should also need the data of soil hydrologic soil group (HSG) and antecedent moisture content (AMC) [9][10], so it is needed the research by entering the factors regarding to the standard of procedure. The other study is carried out by Fikry et.al [11] that estimated the distribution of CN-SCS in the upstream Lesti sub-watershed. In the research location (upstream Lesti sub-watershed) which is the hydrology data are relatively complete enough, the prediction of surface run-off has to be calculated manually by using the available methods of flood forecasting (Snyder, Nakayasu, Limantara, and IRB). The engineers cannot directly predict the run-off from the available rainfall data by only using the available Curve Number. The selection of research location in upstream Lesti sub-watershed is due to the assumption that the data that is needed is available enough, then to complete the data that has not been yet with the help of System Information Geographic (SIG).
This study intends to give the same contribution in predicting discharge in the Lesti sub-watershed by using the model of SCS-run-off-Curve Number such as by making the run-off-Curve Number mapping in Lesti sub-watershed. Therefore, the engineers who will analyze the discharge in the watershed is enough to use the rainfall data and suitable run-off Curve Number.
II. MATERIALS AND METHODS
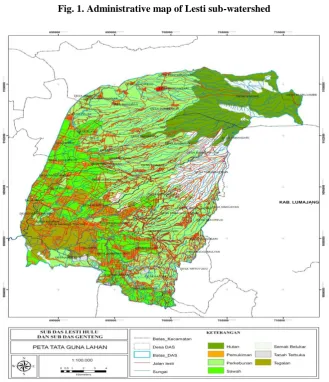
The study is conducted in Lesti sub-watershed due to the availability of data. Map of location and land use are presented as in the Fig. 1 and 2.
CN Modeling for Predicting Discharge in Lesti
Sub-watershed
Fig. 1. Administrative map of Lesti sub-watershed
Fig. 2. Land use Map of Lesti sub-watershed A. Scenario of Research
The scenario of research is as follow 1)To collect the map of Lesti watershed
2)To collect the data of physical characteristic in each sub-watershed. To calibrate the data, it is carried out the field observation randomly.
3)If the data are complete, the next step is to match the physical characteristic data of watershed with the list of CN that is published by the USDA-NRCS and then to determine the CN in every sub-watershed
4)By the CN, to calculate the run-off in sub-watershed. 5)Data of observed discharge and rainfall are analyzed for
calculating the observed and calculated discharge.
6)We have 2 run-off data. By using the statistical analysis, it
it can be concluded the model is dependable or not, it is depended on the value of correlation coefficient.
B. Run-off Curve Number
Run-off-curve-number (CN) is an empirical parameter that is used in hydrology for predicting the direct run-off or infiltration from rainfall (rainfall excess) [12][13]. The CN is developed by the Soil Conservation Service (SCS), United State Department of Agriculture (USDA) and the number is
just popular and it is known as the
SCS-run-off-curve-number. The CN is developed from an empirical analysis of run-off in the little watershed and a plot in the hills, and it is monitored
by the United States
[image:2.595.133.463.205.588.2]International Journal of Innovative Technology and Exploring Engineering (IJITEE) ISSN: 2278-3075, Volume-8 Issue-12, October 2019
Group (HSG) area, land use, the treatment to area, and hydrology condition. The reference of USDA illustrates the CN to describe the characteristic of cover vegetation and HSG.
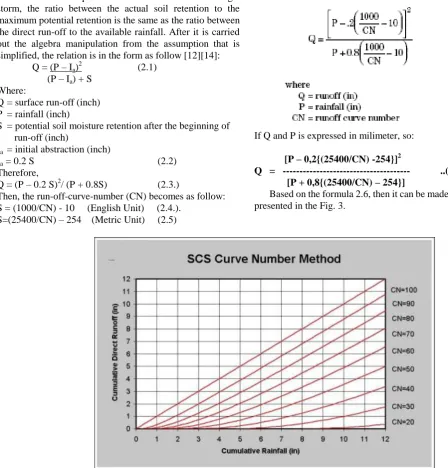
The basic assumption of SCS-CN is that for a single storm, the ratio between the actual soil retention to the maximum potential retention is the same as the ratio between the direct run-off to the available rainfall. After it is carried out the algebra manipulation from the assumption that is simplified, the relation is in the form as follow [12][14]:
Q = (P – Ia)2 (2.1) (P – Ia) + S
Where:
Q = surface run-off (inch) P = rainfall (inch)
S = potential soil moisture retention after the beginning of run-off (inch)
Ia = initial abstraction (inch)
Ia = 0.2 S (2.2) Therefore,
Q = (P – 0.2 S)2/ (P + 0.8S) (2.3.)
Then, the run-off-curve-number (CN) becomes as follow: S = (1000/CN) - 10 (English Unit) (2.4.).
S=(25400/CN) – 254 (Metric Unit) (2.5)
And the relation between Q and P can be expressed as the formula as follow:
If Q and P is expressed in milimeter, so:
[P – 0,2{(25400/CN) -254}]2
Q = --- ..(2.7) [P + 0,8{(25400/CN) – 254}]
[image:3.595.50.499.107.576.2]Based on the formula 2.6, then it can be made the curce as presented in the Fig. 3.
Fig. 3. Curve Number (Paul Schiariti)
III. RESULTS AND DISCUSSION
Before the rainfall data are used in the hydrology analysis process, it is needed to carry out the review between the rainfall and discharge data. In this process, there is only the extreme data is deleted. For example, if there is the daily rainfall is unreasonable such as on 1 until 31 January there is the same rainfall data, even though there is not the same rainfall data on the same time or even no rainfall there. Researcher assumes it is as the human error and it is not to be carried out to fill in the right data. Besides the extreme value that is not reasonable, it is also not to be carried out to improve the data.
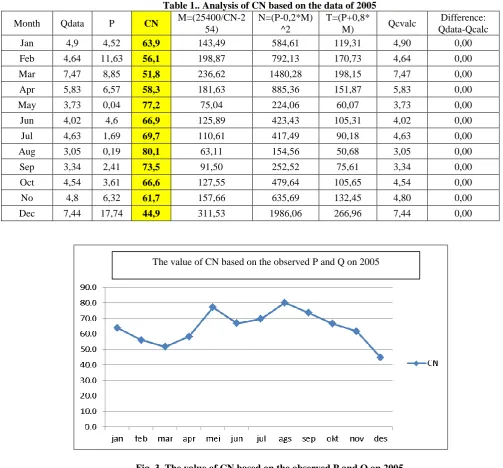
Table 1.. Analysis of CN based on the data of 2005
Month Qdata P CN M=(25400/CN-2
54)
N=(P-0,2*M) ^2
T=(P+0,8*
M) Qcvalc
Difference: Qdata-Qcalc
Jan 4,9 4,52 63,9 143,49 584,61 119,31 4,90 0,00
Feb 4,64 11,63 56,1 198,87 792,13 170,73 4,64 0,00
Mar 7,47 8,85 51,8 236,62 1480,28 198,15 7,47 0,00
Apr 5,83 6,57 58,3 181,63 885,36 151,87 5,83 0,00
May 3,73 0,04 77,2 75,04 224,06 60,07 3,73 0,00
Jun 4,02 4,6 66,9 125,89 423,43 105,31 4,02 0,00
Jul 4,63 1,69 69,7 110,61 417,49 90,18 4,63 0,00
Aug 3,05 0,19 80,1 63,11 154,56 50,68 3,05 0,00
Sep 3,34 2,41 73,5 91,50 252,52 75,61 3,34 0,00
Oct 4,54 3,61 66,6 127,55 479,64 105,65 4,54 0,00
No 4,8 6,32 61,7 157,66 635,69 132,45 4,80 0,00
Dec 7,44 17,74 44,9 311,53 1986,06 266,96 7,44 0,00
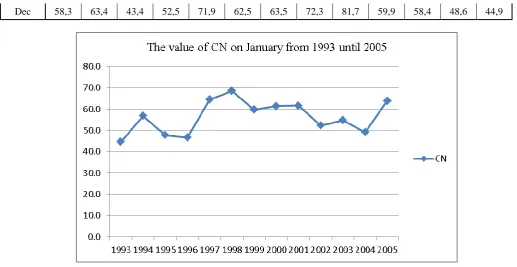
Fig. 3. The value of CN based on the observed P and Q on 2005 Table 2. The various CN every month from 1993 until 2005
Month 1993 1994 1995 1996 1997 1998 1999 2000 2001 2002 2003 2004 2005
Jan 44,6 56,8 47,8 46,6 64,4 68,5 59,7 61,3 61,6 52,3 54,7 49,1 63,9
Feb 54,7 48,7 42,9 45,1 60,0 59,1 69,6 56,6 57,5 49,4 59,2 45,8 56,1
Mar 50,4 45,5 43,4 53,3 70,6 57,5 58,7 54,7 63,0 51,5 59,4 51,3 51,8
Apr 50,8 48,9 52,1 51,5 67,1 62,1 51,9 56,2 70,6 59,5 66,6 66,8 58,3
May 68,0 62,2 69,6 73,8 81,4 76,0 71,1 63,0 79,2 71,2 70,1 64,1 77,2
Jun 64,2 71,3 68,0 77,4 85,6 68,9 82,0 74,3 74,0 79,3 80,8 72,3 66,9
Jul 80,7 73,3 73,6 76,2 87,4 73,0 82,3 81,2 86,3 82,2 85,0 75,2 69,7
Aug 79,8 75,9 83,8 70,3 87,1 82,5 85,7 82,6 89,8 84,3 86,1 78,8 80,1
Sep 85,1 80,6 85,6 84,4 89,0 73,2 85,8 83,3 88,1 85,9 81,4 70,0 73,5
Oct 86,1 77,8 73,8 67,0 80,5 66,6 73,0 62,1 75,9 86,8 78,6 76,0 66,6
Nov 67,8 71,4 48,8 64,1 75,3 64,0 53,2 57,4 65,9 73,6 59,2 59,3 61,7
[image:4.595.45.557.546.739.2]International Journal of Innovative Technology and Exploring Engineering (IJITEE) ISSN: 2278-3075, Volume-8 Issue-12, October 2019
[image:5.595.41.559.47.314.2]Dec 58,3 63,4 43,4 52,5 71,9 62,5 63,5 72,3 81,7 59,9 58,4 48,6 44,9
Fig. 4. The value of CN on January from 1993 until 2005
Based on the discharge observation in Automatic Water Level Recorder (AWLR) in Tawangrejeni Station, there is a significant discharge fluctuation that does not make sensefrom 5th December 2003 until 17th May 2004. After consulting to Perum Jasa Tirta I, evidently the floating tool is really damaged on Tawangrejeni AWLR. To be able to be used in further, the data is needed to be improved.
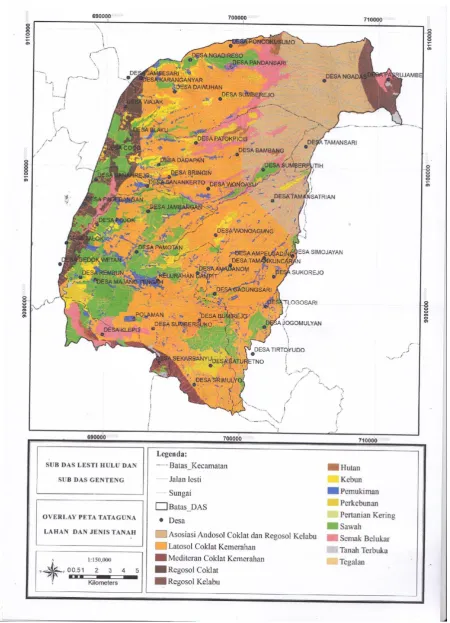
Fig. 5. Presents the overlay between land use map and soil type in the Lesti sub-watershe
IV. CONCLUSION
The value of CN is due to the overlay between land use map and soil type in the Lesti sub-watershed. Based on the value of CN as presented in the Table 2, the monthly discharge in Lesti sub-watershed can be predicted based on the formula of 2.7 above.
REFERENCES
1. L.M. Limanatra, “Hidrologi praktis [Practical Hydrology]”, Bandung. CV Lubuk Agung. ISBN 978-979- 505-205-2 pp. 324, 2010 2. L.M. Limantara, “Evaluation of
International Journal of Innovative Technology and Exploring Engineering (IJITEE) ISSN: 2278-3075, Volume-8 Issue-12, October 2019
3. L.M. Limantara, “The limiting physical parameters of synthetic unit hydrograph” World Applied Sciences Journal. Vol. 7(6), 2009, p. 802–804.
4. D. Priyantoro, L.M. Limantara, “Conformity evaluation of synthetic unit hydrograph (case study at upstream Brantas subwatershed, East Java Province of Indonesia)”, Journal of Water and Land Development. No. 35, 2017, p. 173–183. DOI: 10.1515/jwld-2017-0082.
5. W. Boughten, “A review of the USDA SCS Curve Number Method”. Australian Journal of Soil Research, 27 (3), 1989, p. 511-523. 6. A. Bhattacharya and J.P. Patil, “Abstraction Ratio in the Curve
Number Method of Runoff Estimation”, Journal of Agriculture Engineering, Vol 45, 2008, No. 1.
7. H. Cao, R. Vervoort, and S. Dabney, “Variation in Curve Number Derived from Plot Runoff data for New South Wales (Australia)”, Hydrological Processes, Vol. 25 (24), 2011, p. 3774-3789.
8. J. Bonta, “Determination of Watershed Curve Number Using Derived Distributions”, Journal of Irrigation and Drainage Engineering, Vol 123, No. 1, 1997, p. 28-36.
9. V.M. Ponce and R.H. Hawkins, “Runoff Curve Number: Has It Reached Maturity?”, Journal of Hydrologic Engineering, 1996: 11-19. 10. J. Simanton, R.H. Hawkins, M. Saravi, And K. Renard, “Runoff Curve Number Variation with Drainage Area, Walnut Gulch, Arizona”, American Society of Agricultural and Biological Engineers, Vol 39 (4), 1996, p. 1391-1394.
11. M.N. Fikriy, L.M. Limantara, and E. Suhartanto, “Perkiraan Sebaran Curve Number U.S Soil Conservation Service Pada Sub DAS Brantas Hulu”, 2014
12. M. Huang, J. Gallichand, C. Dong, Z. Wang, and M. Shao, “Use of Soil Moisture Data and Curve Number Method for Estimating Runoff in the Loses Plateau of China”, Hydrological Processes, 2007, 1471-1481.
13. R.H. Hawkins, “The Importance of Accurate Curve Number in the Estimation of Storm Runoff”, Journal of the American Water Resources Association, 11 (5), 1975, p. 887-890.
14. M. Elhakeem and A. Papanicolaou, “Estimation of the Runoff Curve Number via Direct Rainfall Simulator Measurements in the State of Iowa, USA”. Water Resources Management, Vol 23 (12), 2009, p. 2455-2473
AUTHORSPROFILE
Abdul Azis Hoesein. Author is a doctoral program student in the Department of Civil Engineering, University of Brawijaya, Indonesia. Beside that he is a lecturer in the Department of Water Resources Engineering in the same University. He is teaching Applied Hydrology and Engineering Economy. He was the head of Department of Water Resources Engineerin, Facuty of Engineering University of Brawijaya, and also was Dean of the Faculty of Engineering Unversity of Brawijaya.. He has carried out some research in the field of Water Resources Development and Hydrology. His master thesis in School of Civil Engineering, University of New South Wales, Australia titled Derivation of Runoff Curve Number From Observed Floods for Murrumbidgee and Upper Murray Basins under supervision of Prof D.H. Pilgrim. Email: [email protected]
Mohammad Bisri, Lecturer in the Department of Water Resources, Faculty of Engineering, University of Brawijaya, Jl. Mt Haryono No 167 Malang, Indonesia Email: [email protected]
Lily Montarcih Limantara, Lecturer in the Department of Water Resources, Faculty of Engineering, University of Brawijaya, Jl. Mt Haryono No 167 Malang, Indonesia Email: [email protected]