White Rose Research Online URL for this paper:
http://eprints.whiterose.ac.uk/113043/
Version: Published Version
Article:
Bridgestock, Luke, Van De Flierdt, Tina, Rehkämper, Mark et al. (13 more authors) (2016)
Return of naturally sourced Pb to Atlantic surface waters. Nature Communications. 12921.
ISSN 2041-1723
https://doi.org/10.1038/ncomms12921
[email protected] https://eprints.whiterose.ac.uk/ Reuse
This article is distributed under the terms of the Creative Commons Attribution (CC BY) licence. This licence allows you to distribute, remix, tweak, and build upon the work, even commercially, as long as you credit the authors for the original work. More information and the full terms of the licence here:
https://creativecommons.org/licenses/
Takedown
If you consider content in White Rose Research Online to be in breach of UK law, please notify us by
Received 14 Apr 2016|Accepted 16 Aug 2016|Published 28 Sep 2016
Return of naturally sourced Pb to Atlantic surface
waters
Luke Bridgestock
1,w, Tina van de Flierdt
1, Mark Rehka¨mper
1, Maxence Paul
1, Rob Middag
2,3, Angela Milne
4,
Maeve C. Lohan
5, Alex R. Baker
6, Rosie Chance
6,w, Roulin Khondoker
1, Stanislav Strekopytov
7,
Emma Humphreys-Williams
7, Eric P. Achterberg
8, Micha J.A. Rijkenberg
9, Loes J.A. Gerringa
9& Hein J.W. de Baar
9Anthropogenic emissions completely overwhelmed natural marine lead (Pb) sources during the past century, predominantly due to leaded petrol usage. Here, based on Pb isotope measurements, we reassess the importance of natural and anthropogenic Pb sources to the tropical North Atlantic following the nearly complete global cessation of leaded petrol use. Significant proportions of up to 30–50% of natural Pb, derived from mineral dust, are observed in Atlantic surface waters, reflecting the success of the global effort to reduce anthropogenic Pb emissions. The observation of mineral dust derived Pb in surface waters is governed by the elevated atmospheric mineral dust concentration of the North African dust plume and the dominance of dry deposition for the atmospheric aerosol flux to surface waters. Given these specific regional conditions, emissions from anthropogenic activities will remain the dominant global marine Pb source, even in the absence of leaded petrol combustion.
DOI: 10.1038/ncomms12921 OPEN
1Department of Earth Science and Engineering, Imperial College London, London SW7 2AZ, UK.2Department of Chemistry, NIWA/University of Otago
Research Centre for Oceanography, Dunedin 9054, New Zealand.3Department of Ocean Sciences & Institute of Marine Sciences, University of California Santa Cruz, CA 95064, USA.4School of Geography, Earth and Environmental Sciences, University of Plymouth, Plymouth PL4 8AA, UK.5Ocean and Earth Sciences, National Oceanography Centre Southampton, University of Southampton, Southampton SO14 3ZH, UK.6School of Environmental Sciences,
University of East Anglia, Norwich NR4 7TJ, UK.7Image and Analysis Centre, Natural History Museum, London SW7 5BD, UK.8Geomar-Helmholtz Centre
for Ocean Research, Kiel 24148, Germany.9Department of Ocean Systems (OCS), NIOZ Royal Netherlands Institute for Sea Research, and Utrecht
A
nthropogenic activities have significantly perturbed the global biogeochemical cycles of numerous trace metals1. One of the most extensively perturbed and documented biogeochemical cycles is that of lead (Pb; refs 2,3). The combu-stion of leaded petrol constitutes the dominant environmental Pb source during the past century, along with emissions from non-ferrous metal smelting, coal combustion and waste incineration1,4. The ocean has been strongly affected by this perturbation with even the deepest waters dominated by anthropogenic Pb (ref. 2). Historically, the North Atlantic received the highest anthropogenic Pb inputs due to its proximity to the industrialized regions of North America and Europe5–7. On the basis of coral records from Bermuda, the onset of the anthropogenic Pb perturbation of North Atlantic surface waters extends back to B1850 (ref. 7). Previous studies of Atlantic seawater sampled since the late 1970s, found furthermore that anthropogenic sources completely dominated modern marine Pb inventories5–12. The short residence time of Pb in ocean surface waters (several years), means their Pb content closely tracks atmospheric inputs5,6,13,14 For example, Pb concentrations in North Atlantic surface waters rose from pre-anthropogenic values of B15 pmol kg1 to a peak of B200 pmol kg1 in the 1970s, before sharply declining (by a factor of B5) during the 1980s and 1990s, a trend that largely reflects the increased usage and subsequent phasing-out of leaded petrol in the surrounding regions6,7.Surface waters of the tropical North Atlantic (0–30°N) receive the largest inputs of mineral dust in the entire global ocean via the North African dust plume15, which represents a potentially important natural source of Pb. However, studies conducted in the 1980s and 1990s found Pb in surface waters of this region to be dominated by anthropogenic sources, despite dramatically decreasing anthropogenic inputs at that time8–10. Almost complete cessation of global leaded petrol use has since been achieved, with North African countries among the last to phase-out following the Dakar Declaration in 2002 (ref. 16). With the termination of this prominent anthropogenic Pb flux, natural sources may once again provide significant contributions to Pb budgets of tropical North Atlantic surface waters.
The detection of significant amounts of natural Pb in ocean surface waters would not only be a testament to the global effort to reduce anthropogenic Pb emissions, but would also provide an unprecedented opportunity to study the factors governing marine Pb inputs from both anthropogenic and natural sources. In
particular, the relative proportions of Pb derived from mineral dust and anthropogenic emissions in ocean surface waters will be influenced by the relative atmospheric concentrations, deposition velocities and solubilities in seawater from aerosols of these two Pb sources. Such factors, typically highly variable in space and time, will be integrated over the residence time of Pb in ocean surface waters.
Mineral dust emitted in North Africa is transported across the tropical North Atlantic year round, albeit with considerable seasonal variability. Notably, the main focus of mineral dust transport moves northward, from around 4°N to 20°N between the boreal winter and boreal summer, following the seasonal migration of the inter tropical convergence zone (ITCZ)17. This latitudinal shift has a pronounced effect on the delivery of mineral dust to sites in the western tropical North Atlantic (WTA)18. The altitude at which mineral dust is transported over the tropical North Atlantic also varies seasonally, with low-level transport in the marine boundary layer during the boreal winter and transport in the Saharan air layer at altitudes of about 1–7 km during the boreal summer19–21. Consequently, mineral dust deposition rates in the eastern tropical North Atlantic (ETA) are higher in winter than in summer months20,22.
Here we reassess the importance of natural Pb sources to tropical North Atlantic surface waters, following the almost complete global phase-out of leaded petrol, and study the factors governing the relative atmospheric fluxes of anthropogenic and mineral dust derived Pb to surface waters of this region. We thereby present and interpret Pb concentration and isotope composition data for surface seawater samples, collected during the second leg cruise of the GEOTRACES section GA02 (64PE321; June–July, 2010) and the GEOTRACES section GA06 (D361; February–March, 2011) in the WTA and ETA respectively, in addition to atmospheric aerosols collected in the ETA during the GA06 section. These two quasi-meridional cruise transects were conducted at different times of the year, hence they intersect the North African dust plume at different stages of its seasonal migration (Fig. 1). We find that North African mineral dust constitutes a significant source of Pb to surface waters of this region, accounting for up to 30–50% of the total Pb budgets. Furthermore, we demonstrate that more efficient deposition of mineral dust relative to anthropogenic particles by dry deposition plays a key role in producing the observed proportions of these two Pb sources in ocean surface waters.
Easterlies Westerlies
GA06
(Feb–March, 2011) GA02, leg 2
(June–July, 2010)
ITCZ ITCZ
Easterlies
ITCZ
GA02, leg 2 11th June – 8th July, 2010
0 1
ITCZ
GA06 7th February – 19th March, 2011
Surface water samples
Aerosol samples
30°N
20°N
10°N
EQ
10°S
70°W 60°W 50°W 40°W 30°W 20°W
Ocean Data View
[image:3.595.58.544.526.647.2]a b c
Figure 1 | Collection locations of samples used in this study.Panel (a), sampling locations for unfiltered surface seawater (circles) and aerosols (brown lines) along the middle part of the GEOTRACES section GA02 (2nd leg; cruise PE321) and along the GEOTRACES section GA06 (cruise D361). Brown circles indicate surface seawaters affected by mixing with Amazon River outflow in the western tropical Atlantic (WTA). Green arrows show the main meteorological regimes, while black lines denote the position of the ITCZ (Inter Tropical Convergence Zone) during each cruise. The map was produced using Ocean Data View69. Panels (b) and (c) show aerosol optical depth (550 nm) averaged over the duration of the cruises PE321 (section GA02, 2nd leg) and cruise D361 (section GA06) respectively. The position of the North African mineral dust plume over the Atlantic Ocean can be clearly identified by higher values (darker colours). Visualizations were produced using the Giovanni online data system, NASA GES DISC70with data from the MODIS
Results
Sources of Pb to ocean surface waters. Lead isotope ratio
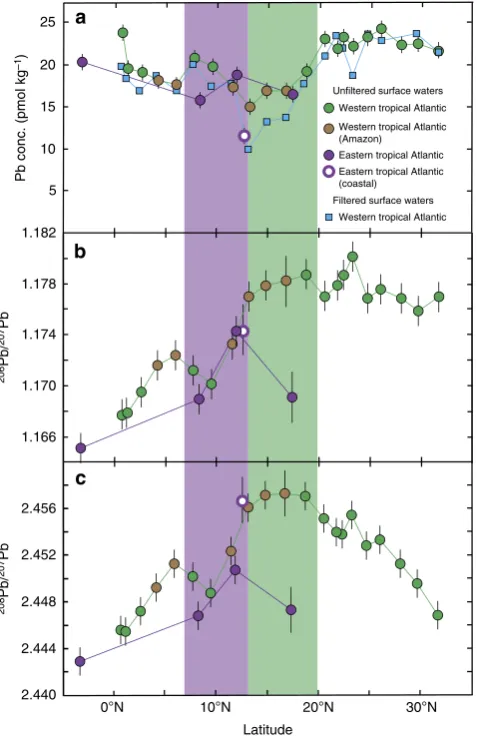
mea-surements can be used to distinguish between different sources of Pb to the ocean (for example, see refs 2,8–12). Unfiltered surface seawater samples were analysed for total Pb concentrations and isotope compositions (Table 1, Fig. 2a–c; see the ‘Methods’ section). To assess particulate Pb contributions to the samples, total Pb concentrations were compared with data for either filtered (o0.2mm) or particulate samples (40.45mm) collected
during the same cruises (Fig. 2a, Supplementary Table 1). It should be noted, that unfiltered samples were collected at slightly different locations and depths to filtered and particulate samples.
The major potential Pb sources to the study regions are, anthropogenic Pb transported by easterly winds originating from Africa and/or Europe23–25, anthropogenic Pb transported by westerly winds originating from North and Central America11,23, North African mineral dust transported by easterly winds26–28 and riverine inputs from the Amazon basin29,30. These different Pb sources can be distinguished using a plot of206Pb/207Pb versus 208Pb/207Pb (Fig. 3). In detail, the anthropogenic sources feature
low 206Pb/207Pb, 208Pb/207Pb ratios (easterlies) or intermediate 206Pb/207Pb coupled with low 208Pb/207Pb ratios (westerlies),
while natural sources (mineral dust and Amazon inputs) feature high 206Pb/207Pb and 208Pb/207Pb ratios. A compilation of the
relevant literature data used to assess the isotope composition of these sources is provided in Supplementary Tables 2–5, with details of these data sets provided in Supplementary Note 1.
[image:4.595.43.548.363.666.2]In context of these endmembers, surface waters from close to the equator, with low206Pb/207Pb,208Pb/207Pb ratios (Fig. 2b,c), contain the highest proportions of anthropogenic Pb transported by easterly winds (Fig. 3). Furthermore, advection of water from the South Atlantic by the North Brazil Current may also contribute to the low 206Pb/207Pb, 208Pb/207Pb ratios of these samples. Concurrent increases in both of these ratios with increasing latitude in the WTA and ETA (Fig. 2b,c) correspond to deviations towards the isotope composition of natural Pb from mineral dust and/or Amazon River inputs (Fig. 3). Maximum values for these ratios occur at 13.2–18.7°N in the WTA and 11.9°N in the ETA, indicating maxima in Pb contributions from natural relative to anthropogenic sources. A less pronounced maximum for these Pb isotope ratios occurs at about 5°N in the WTA. Between B20 to 30°N in the WTA, 206Pb/207Pb ratios remain high, while 208Pb/207Pb decreases (Fig. 2b,c), corres-ponding to an increase in the contributions of North/Central American anthropogenic Pb transported by westerly winds (Fig. 3). Between 11.9°N and 17.4°N in the ETA, a concurrent decrease in206Pb/207Pb and208Pb/207Pb ratios (Fig. 2b,c) signifies an increasing contribution of anthropogenic Pb transported by easterly winds (Fig. 3).
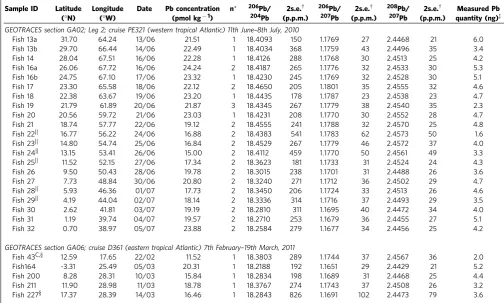
Table 1 | Lead concentration and isotope data for unfiltered surface seawater samples collected during along the GEOTRACES sections GA02 (2nd leg) and GA06.
Sample ID Latitude (°N)
Longitude (°W)
Date Pb concentration (pmol kg1)
n* 206Pb/
204Pb
2s.e.w
(p.p.m.)
206Pb/
207Pb
2s.e.w
(p.p.m.)
208Pb/
207Pb
2s.e.w
(p.p.m.)
Measured Pb quantity (ng)z
GEOTRACES section GA02; Leg 2; cruise PE321 (western tropical Atlantic) 11th June–8th July, 2010
Fish 13a 31.70 64.24 13/06 21.51 1 18.4093 150 1.1769 27 2.4468 21 6.0 Fish 13b 29.70 66.44 14/06 22.49 1 18.4034 368 1.1759 43 2.4496 35 3.4 Fish 14 28.04 67.51 16/06 22.28 1 18.4126 288 1.1768 30 2.4513 25 4.2 Fish 16a 26.06 67.72 16/06 24.24 2 18.4187 265 1.1776 32 2.4533 30 5.3 Fish 16b 24.75 67.10 17/06 23.32 1 18.4230 245 1.1769 32 2.4528 30 5.1 Fish 17 23.30 65.58 18/06 22.12 2 18.4650 205 1.1801 35 2.4555 32 4.6 Fish 18 22.38 63.67 19/06 23.20 1 18.4435 178 1.1787 23 2.4538 23 4.7 Fish 19 21.79 61.89 20/06 21.87 3 18.4345 267 1.1779 38 2.4540 35 2.3 Fish 20 20.56 59.72 21/06 23.03 1 18.4231 208 1.1770 30 2.4552 28 4.7 Fish 21 18.74 57.77 22/06 19.12 2 18.4555 241 1.1788 32 2.4570 25 4.8 Fish 22|| 16.77 56.22 24/06 16.88 2 18.4383 541 1.1783 62 2.4573 50 1.6
Fish 23|| 14.80 54.74 25/06 16.84 2 18.4529 267 1.1779 46 2.4572 37 4.0
Fish 24|| 13.15 53.41 26/06 15.00 2 18.4112 459 1.1770 50 2.4561 49 3.3
Fish 25|| 11.52 52.15 27/06 17.34 2 18.3623 181 1.1733 31 2.4524 24 4.3 Fish 26 9.50 50.43 28/06 19.78 2 18.3015 238 1.1701 31 2.4488 26 3.6 Fish 27 7.73 48.84 30/06 20.80 2 18.3240 271 1.1712 36 2.4502 29 4.7 Fish 28|| 5.93 46.36 01/07 17.73 2 18.3450 206 1.1724 33 2.4513 26 4.6
Fish 29|| 4.19 44.04 02/07 18.14 2 18.3336 314 1.1716 37 2.4493 29 3.5
Fish 30 2.62 41.81 03/07 19.19 2 18.2810 311 1.1695 40 2.4472 34 4.0 Fish 31 1.19 39.74 04/07 19.57 2 18.2710 253 1.1679 36 2.4455 27 5.1 Fish 32 0.70 38.97 05/07 23.88 2 18.2584 279 1.1677 34 2.4456 25 4.2
GEOTRACES section GA06; cruise D361 (eastern tropical Atlantic) 7th February–19th March, 2011
Fish 43C,y 12.59 17.65 22/02 11.52 1 18.3803 289 1.1744 37 2.4567 36 2.0 Fish164 -3.31 25.49 05/03 20.31 1 18.2188 192 1.1651 29 2.4429 21 5.2 Fish 200 8.28 28.31 10/03 15.84 1 18.2834 198 1.1689 31 2.4468 25 4.4 Fish 211 11.90 28.98 11/03 18.78 1 18.3767 274 1.1743 37 2.4508 26 3.2 Fish 227y 17.37 28.39 14/03 16.46 1 18.2843 826 1.1691 102 2.4473 79 3.6
CSample collected off the coast of east Africa.
*number of Pb concentration analyses conducted; quoted Pb concentrations are the mean of all analyses, and are corrected for an average blank of 11.7±4.3 pg (1 s.d.,n¼36)66.
wrelative within-run precision (2 s.e.) of isotopic data in parts per million (ppm). zQuantity of Pb utilized for the isotopic analysis.
yPb isotope ratios are assigned a larger level of uncertainty due to either the small quantity of Pb available for analysis (r2 ng) and/or poor within-run precision. For these samples,206Pb/204Pb,
206Pb/207Pb and208Pb/207Pb are assigned relative uncertainties of 2.6%, 1.7%and 0.8%respectively; for all other samples, these isotope ratios are assigned uncertainties of 1%, 1%and 0.25%
respectively. The quoted uncertainties are based on replicate analyses (2 s.d.) of in-house seawater reference materials66. Similarly, the Pb concentrations are assigned an uncertainty of±1 pmol kg1
based on replicate analyses (1 s.d.) of in-house seawater reference materials66.
Two important questions follow from these observations. First, whether the higher natural Pb contributions to WTA surface waters are due to mineral dust and/or Amazon River inputs. Second, whether the natural Pb detected in unfiltered seawater samples is primarily in dissolved or particulate form. In the WTA, water masses influenced by mixing with Amazon River water were encountered between 4–6°N and 13–17°N, as identified by decreases in salinity31,32. These samples broadly coincide with concurrent maxima in 206Pb/207Pb and 208Pb/207Pb (Fig. 2b,c), while salinity is negatively correlated with these isotope ratios (Fig. 4a, 206Pb/207Pb not shown). It is therefore possible that Amazon River inputs are an important source of natural Pb with high206Pb/207Pb and208Pb/207Pb for these selected samples.
However, these Amazon-influenced surface waters are also characterized by lower total Pb concentrations (15.0–18.1 pmol kg1) than the rest of the samples (19.2–24.3 pmol kg1), with three of the former (13.2–16.8°N)
featuring significant particulate Pb contributions of 18–34% (Fig. 2a, Table 1, Supplementary Table 1). The total Pb concentrations of Amazon-influenced samples display a positive correlation with salinity (r2¼0.60, P¼0.05), indicating that unmixed Amazon outflow water features low Pb contents (oo10 pmol kg1; Fig. 4b). This is much lower than dissolved
Pb concentrations reported for the Amazon River system (B300–800 pmol kg1)29, suggesting that Pb is efficiently removed by biogeochemical processes during mixing with seawater, consistent with previous findings for this and other river systems9,33. The Amazon is therefore unlikely to be a significant source of dissolved Pb to the tropical North Atlantic, but may provide minor contributions to the six Amazon influenced samples.
Importantly, the sample at 18.7°N in the WTA features maximum206Pb/207Pb and208Pb/207Pb ratios, but is not affected by mixing with Amazon outflow water (Fig. 2b,c, Fig. 4a). In addition, the latitude of the North African dust plume at the time of sampling along the GA02 section is consistent with the position of concurrent maxima in 206Pb/207Pb and 208Pb/ 207Pb ratios observed between 13.2 and 18.7°N in the WTA
(Fig. 1b, Fig. 2b,c). Atmospheric deposition of mineral dust is therefore attributed to be the dominant natural source of Pb to these surface waters. The similar Pb concentrations of unfiltered and filtered (o0.2mm) samples at 18.7°N in the WTA,
furthermore suggests that the natural Pb is predominantly in dissolved rather than particulate form (Fig. 2a, Supplementary Table 1).
In the ETA, the maximum contribution of naturally sourced Pb with high 206Pb/207Pb and 208Pb/207Pb occurs at 11.9°N (Fig. 2b,c). This is further south than in the WTA and consistent with the lower latitude of the North African dust plume in the ETA at the time of sampling. Hence, it can be inferred that atmospheric deposition of mineral dust is the main source of this natural Pb. Comparison of total and particulate (40.45mm) Pb concentrations in the ETA indicate particulate Pb contributions of about 7–12% (Supplementary Table 1), confirming that the majority of Pb in these waters is in dissolved form.
Now that we have established that North African mineral dust is the dominant source of natural Pb, isotope mass balance calculations are used to quantitatively estimate the maximum contributions of mineral dust derived Pbmin relative to
anthro-pogenic sourced Pbanth in surface waters. The maxima in Pbmin
contributions are taken to occur in the samples at 11.9°N in the ETA and 18.7°N in the WTA, to avoid any potential influence of Amazon River outflow. The samples from these locations broadly lie on a mixing line between the compositions of North African mineral dust and anthropogenic emissions transported by easterly winds in 206Pb/207Pb versus 208Pb/207Pb space (Fig. 3). We therefore assume that the Pb in these samples represents a binary mixture of these two sources.
On the basis of a compilation of literature data, the mean
isotope compositions of North African mineral dust
(206Pb/207Pb¼1.2051, 208Pb/207Pb¼2.4972) and anthropogenic Pb transported by easterly winds (206Pb/207Pb¼1.1532, 208Pb/207Pb¼2.4304) are used to define a mixing line between these two endmembers (Fig. 3; Supplementary Note 2). Comparison of our data with this mixing line indicates that the seawater samples feature maximum Pbmin contributions of
approximately 30 to 50%. The use of mean Pb isotope ratios to define the endmembers is thereby justified by the longer residence time of Pb in ocean surface waters (approximately months to years13,14 see the ‘Discussion’ section) compared with the atmosphere (approximately days34), because this will integrate the variable isotope composition of atmospheric inputs towards average values.
0°N 10°N 20°N 30°N 2.440
2.444 2.448 2.452 2.456 1.166 1.170 1.174 1.178 1.182 5 10 15 20 25
Western tropical Atlantic
Eastern tropical Atlantic
Eastern tropical Atlantic (coastal)
Western tropical Atlantic (Amazon) Unfiltered surface waters
Filtered surface waters
Western tropical Atlantic
208
Pb/
207
Pb
206
Pb/
207
Pb
Pb conc. (pmol kg
–1
)
a
b
c
Latitude
[image:5.595.51.290.50.421.2]Sources of Pb to the atmosphere. On the basis of results of air mass back trajectory analyses35, the aerosol samples were split into three groups, originating from North Africa (‘North African’), Algeria (‘Algerian’) and samples collected within/south of the ITCZ. The latter group did not encounter land in the 5 days preceding collection (‘Oceanic’) (Supple-mentary Figs 1–3). The ‘Algerian’ samples were distinguished from the remaining ‘North African’ aerosols, as leaded petrol was still available in Algeria at the time of sampling in 2011 (ref. 16). Every aerosol sample was subjected to both total digestion and a leaching procedure to determine the component of each sample that is potentially soluble in the marine environment (see the ‘Methods’ section). The Pb and Al concentrations as well as the Pb isotope compositions for the total digests and leachates are presented in Table 2.
Two independent approaches were applied to estimate the relative proportions of Pbminand Pbanthin the total aerosol digests:
an isotope mass balance calculation and an approach based on crustal enrichment factors (EFcrust). The first calculation used the Pb
isotope compositions of the aerosol samples, which are in accord with a mixing relationship in206Pb/207Pb versus208Pb/207Pb space between Pbanth transported by easterly winds, and Pbmin from
North African mineral dust (Fig. 3). In detail, the Pb isotope compositions of the total digests trend towards mineral dust compositions while the leachate samples overlap the range of Pbanth
transported by easterly winds (206Pb/207Pb¼1.1338–1.1666 and 208Pb/207Pb¼2.4037–2.4466). This is consistent with the findings
of previous studies, showing that Pbanthis much more soluble than
Pbmin (refs 36–42). The isotope composition of each leachate is
therefore taken as representative for Pbanth in the corresponding
total digest. The relatively large isotopic variability of the leachates is indicative of significant compositional heterogeneity for Pbanthin
the atmosphere over short timescales (approximately days). Presumably this reflects the short residence time of several days for these atmospheric aerosols34.
On the basis of these systematics, the isotope mass balance approach assumes the total digests contain a binary mixture of Pbmin and Pbanth transported by easterly winds, whereby the
isotope composition of Pbanthis represented by the corresponding
leachates. Using the mean 206Pb/207Pb ratio of North 10%
20% 30%
40% 50%
60% 70%
80% 90%
US and Central American anthropogenic emissions (Westerlies)
North African anthropogenic emissions (Easterlies)
2.40 2.42 2.44 2.46 2.48 2.50 1.14
1.15 1.16 1.17 1.18 1.19 1.20 1.21
Western tropical Atlantic
Eastern tropical Atlantic Eastern tropical Atlantic (coastal) Historic surface waters Surface waters
Aerosols Total digestion Leachate
Amazon river
Western tropical Atlantic (Amazon)
North African mineral dust
2.444 2.452 1.17
1.18
North American
206
Pb/
207
Pb
208Pb/207Pb
208Pb/207Pb
206
Pb/
207
Pb
a
[image:6.595.140.455.51.305.2]b
Figure 3 | A plot of206Pb/207Pb versus208Pb/207Pb for surface water and aerosol samples for source assessment.Panel (a)206Pb/207Pb versus 208Pb/207Pb for unfiltered surface seawater from GEOTRACES sections GA02 (2nd leg) and GA06 and aerosols (total digests and leachates; GA06).
Shown for comparison are the Pb isotope compositions of (1) the major potential Pb sources to the tropical Atlantic (coloured fields23–30) with recent North American aerosols denoted by light blue diamonds11, (2) surface seawaters collected in the region during the 1980s and 1990s (grey squares8,9), as well as (3) a mixing line between anthropogenic Pb (Pbanth) transported by easterly winds and mineral dust derived Pb (Pbmin). Inset panel (b), displays an
enlargement of206Pb/207Pb versus208Pb/207Pb ratios for unfiltered surface seawater only. Quoted uncertainties (2 s.d.) for the seawater and aerosol data are assessed as through replicate analyses of in-house seawater standards66(seawater) or by propagation of uncertainty associated with blank corrections and measurement protocols (aerosols).
2.442 2.446 2.450 2.454 2.456
Pb concentration (pmol kg–1)
Salinity
15 17 19 21 23 25 32
33 34 35 36 37
a b
Western tropical Atlantic Western tropical Atlantic (Amazon)
208Pb/207Pb
Figure 4 | Comparison of the Pb contents and isotope composition of Amazon influenced to the remainder of WTA surface waters.Salinity versus208Pb/207Pb ratios (panela), and Pb concentrations (panelb) for unfiltered surface seawater samples collected in the western tropical Atlantic (GEOTRACES section GA02, 2nd leg). The samples affected by mixing with Amazon River water are distinguished as brown circles, while other samples are marked in green. Quoted uncertainties in208Pb/207Pb
[image:6.595.307.551.419.536.2]African mineral dust from the literature as Pbmin endmember
(206Pb/207Pb¼1.2051, Supplementary Table 5), and the 206Pb/207Pb ratio of each leachate to represent Pb
anth, the
proportion of Pbmin in each total digest is calculated from the
isotope mass balance (Supplementary Note 2). Importantly, use of 208Pb/207Pb ratios for these calculations yields almost identical
results (Supplementary Fig. 4). In detail, estimated Pbmin
proportions range between 2 and 61%, with uncertainty arising mainly from the potentially variable isotope composition of the Pbminendmember (Table 2). The latter is assessed by propagating
the full range of compiled 206Pb/207Pb data for North African mineral dust (1.2000–1.2167) through the calculations. This yields Pbmin% uncertainties of up to about±10%, which increase
with increasing Pbminproportions (Supplementary Fig. 5).
The second approach using EFcrustvalues provides additional,
independent constraints on the relative proportions of Pbminand
Pbanth in the total digests. Crustal enrichment factors are a
common method of assessing the relative importance of mineral dust and anthropogenic emissions to atmospheric Pb budgets (for example, see refs 20,36,43–45). They are typically calculated by normalizing the Pb/Al ratio of an aerosol sample (Pb/Alsample) to
a reference ratio for the upper continental crust, Pb/Alucc
(equation (1)).
EFcrust¼ Pb=Alsample
= Pb=Alucc
ð1Þ
The main uncertainty of this approach is how well the chosen crustal reference ratio characterizes the mineral dust. Such uncertainty has led to the convention of applying EFcrust values
in a qualitative manner, whereby only EFcrust values45 or 10
are interpreted to represent definite enrichments of Pbanth
(for example, see refs 36,43–45). Using Pb/Alucc¼2.09104
from Rudnick & Gao46, the EFcrust values for the total digests
range between 1.9 and 14.9 (Table 2). Hence, the majority of the aerosol samples would not be considered significantly enriched in
Pbanth following this conventional approach. However, the
isotope data clearly shows that they contain substantial proportions of Pbanth(Fig. 3).
To fully compare the constraints on aerosol Pbminproportions
provided by the isotope data and EFcrustvalues, and to assess the
suitability of the chosen Pb/Alucc reference ratio, Pbmin
propor-tions in the total digests are quantitatively estimated following equation (2), where Altotaland Pbtotaldenote the atmospheric Al
and Pb concentrations derived from the total digests. This approach yields Pbmin proportions for the total digests of 7 to
54%, in good agreement with the results of the isotope mass balance approach (Table 2, Fig. 5a). Importantly, this agreement suggests that the Pbmin proportion estimates are reasonably
robust, and that the chosen crustal reference value suitably characterizes the Pb/Al ratio of North African mineral dust. There are a few exceptions to this, notably sample ISO-11 for which the results of the two approaches differ by about 25%. This discrepancy is likely due to an unusual natural Pb/Al ratio of the mineral dust as a result of mineralogical variability. The isotope mass balance calculations are hence more likely to provide robust estimates of Pbminproportions.
Pbminð Þ ¼% ½ðAltotalPb=AluccÞ=Pbtotal100 ð2Þ
In summary, both approaches demonstrate that the propor-tions of Pbmin and Pbanth in the atmosphere are highly variable
over timescales of several days. Most likely, this variability reflects differences in the emission and transport of these two distinct Pb sources. Atmospheric Al concentrations are commonly used as a proxy for the concentration of mineral dust in the atmosphere, with the assumption that the latter has a Al content of 8% (w/w) (for example, see refs20,43,44). Atmospheric Al abundances range over three orders of magnitude from 68 to 5,048 ng m3, corresponding to atmospheric mineral dust concentrations of about 0.9–63mg m3. Estimated Pbmin proportions generally
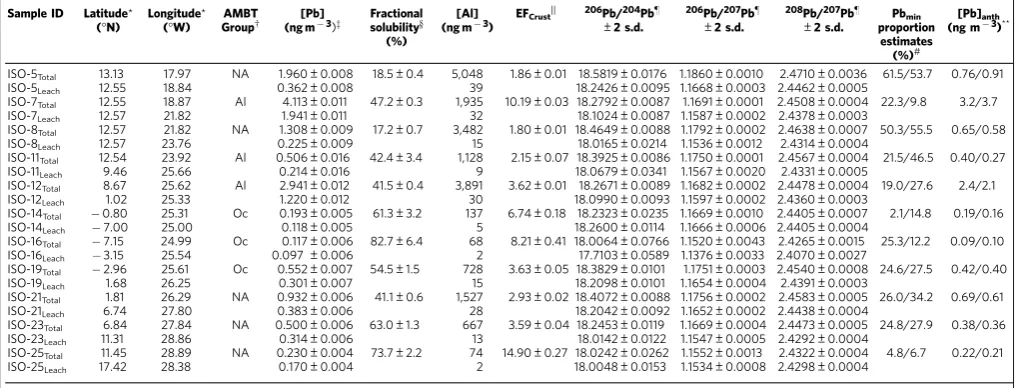
[image:7.595.44.560.83.277.2]increase with increasing Al concentrations (Fig. 5b), which Table 2 | Elemental concentrations and Pb isotope compositions for aerosols collected in the eastern tropical Atlantic along GEOTRACES section GA06.
Sample ID Latitude*
(°N)
Longitude*
(°W)
AMBT
Groupw (ng m[Pb]3)z Fractionalsolubilityy (%)
[Al]
(ng m3) EFCrust
|| 206Pb/204Pbz
±2 s.d.
206Pb/207Pbz
±2 s.d.
208Pb/207Pbz
±2 s.d.
Pbmin
proportion estimates (%)#
[Pb]anth
(ng m3)**
ISO-5Total 13.13 17.97 NA 1.960±0.008 18.5±0.4 5,048 1.86±0.01 18.5819±0.0176 1.1860±0.0010 2.4710±0.0036 61.5/53.7 0.76/0.91
ISO-5Leach 12.55 18.84 0.362±0.008 39 18.2426±0.0095 1.1668±0.0003 2.4462±0.0005
ISO-7Total 12.55 18.87 Al 4.113±0.011 47.2±0.3 1,935 10.19±0.03 18.2792±0.0087 1.1691±0.0001 2.4508±0.0004 22.3/9.8 3.2/3.7
ISO-7Leach 12.57 21.82 1.941±0.011 32 18.1024±0.0087 1.1587±0.0002 2.4378±0.0003
ISO-8Total 12.57 21.82 NA 1.308±0.009 17.2±0.7 3,482 1.80±0.01 18.4649±0.0088 1.1792±0.0002 2.4638±0.0007 50.3/55.5 0.65/0.58
ISO-8Leach 12.57 23.76 0.225±0.009 15 18.0165±0.0214 1.1536±0.0012 2.4314±0.0004
ISO-11Total 12.54 23.92 Al 0.506±0.016 42.4±3.4 1,128 2.15±0.07 18.3925±0.0086 1.1750±0.0001 2.4567±0.0004 21.5/46.5 0.40/0.27
ISO-11Leach 9.46 25.66 0.214±0.016 9 18.0679±0.0341 1.1567±0.0020 2.4331±0.0005
ISO-12Total 8.67 25.62 Al 2.941±0.012 41.5±0.4 3,891 3.62±0.01 18.2671±0.0089 1.1682±0.0002 2.4478±0.0004 19.0/27.6 2.4/2.1
ISO-12Leach 1.02 25.33 1.220±0.012 30 18.0990±0.0093 1.1597±0.0002 2.4360±0.0003
ISO-14Total 0.80 25.31 Oc 0.193±0.005 61.3±3.2 137 6.74±0.18 18.2323±0.0235 1.1669±0.0010 2.4405±0.0007 2.1/14.8 0.19/0.16
ISO-14Leach 7.00 25.00 0.118±0.005 5 18.2600±0.0114 1.1666±0.0006 2.4405±0.0004
ISO-16Total 7.15 24.99 Oc 0.117±0.006 82.7±6.4 68 8.21±0.41 18.0064±0.0766 1.1520±0.0043 2.4265±0.0015 25.3/12.2 0.09/0.10
ISO-16Leach 3.15 25.54 0.097±0.006 2 17.7103±0.0589 1.1376±0.0033 2.4070±0.0027
ISO-19Total 2.96 25.61 Oc 0.552±0.007 54.5±1.5 728 3.63±0.05 18.3829±0.0101 1.1751±0.0003 2.4540±0.0008 24.6/27.5 0.42/0.40
ISO-19Leach 1.68 26.25 0.301±0.007 15 18.2098±0.0101 1.1654±0.0004 2.4391±0.0003
ISO-21Total 1.81 26.29 NA 0.932±0.006 41.1±0.6 1,527 2.93±0.02 18.4072±0.0088 1.1756±0.0002 2.4583±0.0005 26.0/34.2 0.69/0.61
ISO-21Leach 6.74 27.80 0.383±0.006 28 18.2042±0.0092 1.1652±0.0002 2.4438±0.0004
ISO-23Total 6.84 27.84 NA 0.500±0.006 63.0±1.3 667 3.59±0.04 18.2453±0.0119 1.1669±0.0004 2.4473±0.0005 24.8/27.9 0.38/0.36
ISO-23Leach 11.31 28.86 0.314±0.006 13 18.0142±0.0122 1.1547±0.0005 2.4292±0.0004
ISO-25Total 11.45 28.89 NA 0.230±0.004 73.7±2.2 74 14.90±0.27 18.0242±0.0262 1.1552±0.0013 2.4322±0.0004 4.8/6.7 0.22/0.21
ISO-25Leach 17.42 28.38 0.170±0.004 2 18.0048±0.0153 1.1534±0.0008 2.4298±0.0004
*Latitudes/longitudes between which samples were collected.
wAMBT¼air mass back trajectory group, NA¼North African, Al¼Algerian, Oc¼oceanic (Supplementary Figs 1–3). zAtmospheric Pb concentration, uncertainty estimated by propagation of the sampling blank uncertainty (1 s.d., see Methods).
yFractional solubility of Pb in leaching procedure (equation (4)); uncertainty estimated by propagating the uncertainties (1 s.d.) of the atmospheric Pb concentrations from analyses of the leachates and total aerosol digests (see Methods).
||Crustal enrichment factors (equation (1)); uncertainty based on the uncertainty (1 s.d.) of atmospheric concentrations (see text).
zPb isotope ratios are corrected for the Pb content and isotope composition of the sampling blank, with uncertainties (2 s.d.) assessed as described in the Methods section. #Estimated proportions of Pbminin the total digests calculated using the isotope mass balance/EF approaches.
suggests that the observed variability in Pbmin proportions is
largely driven by highly variable atmospheric mineral dust concentrations. This conclusion is consistent with the findings of previous studies in regions strongly affected by both mineral dust and anthropogenic emissions36,43,44. However, there is considerable scatter in the trend of Fig. 5b, presumably reflecting variations in atmospheric Pbanthconcentrations.
Atmospheric Pbanth concentrations are calculated using the
estimated Pbmin proportions and total atmospheric Pb
concen-trations (Pbtotal) (equation (3)). Note that using the Pbmin
proportions determined by either the isotope mass balance or the
EFcrust approach yields similar results (Supplementary Fig. 6).
Two of the samples from the ‘Algerian’ group exhibit anom-alously high atmospheric Pbanth concentrations of 2.4 and
3.2 ng m3, presumably reflecting the continued use of leaded petrol in Algeria at the time of sampling16(Table 2). Atmospheric Pbanth concentrations for the remainder of the samples range
between 0.1–0.8 ng m3.
Pbanth ng m3
¼Pbtotal½ðPbminð%Þ=100ÞPbtotal ð3Þ
Solubility of anthropogenic and mineral dust derived Pb.
Previous studies concluded that Pbanthis more soluble than Pbmin
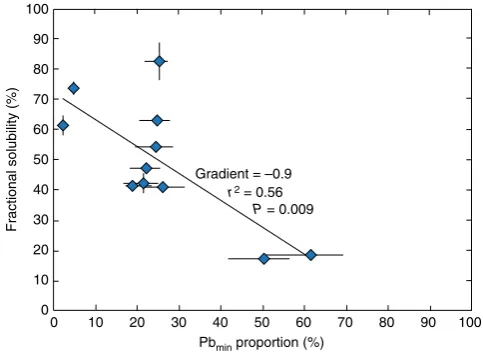
in natural waters (precipitation and seawater) and attributed this to differences in solid state speciation36–42. This solubility difference is also demonstrated here by the anthropogenic isotope compositions of the leachates (Fig. 3). The fraction of Pb released by leaching, calculated relative to the Pb concentrations released from total digestion and expressed as a percentage (equation (4)), ranges between 19 and 83% (Table 2). The estimated Pbminproportions in the total digests are thereby
negatively correlated with the fractional solubility, with a gradient of 0.9 (r2¼0.56,P¼0.009) (Fig. 6). This gradient suggests that Pbanthis approximately 100 times more soluble than Pbminduring
leaching, that is, B1% decrease in fractional solubility per 1% increase in Pbminproportions in the aerosol. Extrapolation of this
trend yields fractional solubilities of B70% and 15% for the pure Pbanth and Pbmin endmembers, respectively. The apparent
negative solubility for the Pbmin endmember is obviously
unrealistic. The latter result is, however, still significant because it likely reflects scavenging of both Pbanth and Pbmin following
initial aerosol dissolution during leaching, a type of behaviour that has been documented previously36–39,47.
Fractional solubilityð Þ ¼% ðPbLeach=PbTotalÞ100 ð4Þ
Discussion
This is the first time a significant proportion of up to 30–50% of Pb from a natural source has been detected in Atlantic surface waters. With the exception of the potentially natural Pb contributions observed in surface waters of the remote Southern Ocean48, this finding also applies to the entire global ocean. We suggest that our observation reflects the nearly complete phase-out of leaded petrol, and is a testament to the success of efforts to reduce anthropogenic Pb emissions in regions surrounding the Atlantic, which started over 40 years ago49.
An important observation is that the locations determined for the maximum Pbminproportions in surface waters are consistent
with the position of the North African dust plume during the two cruises (Fig. 1b,c, Fig. 2). This may indicate that seasonal changes in surface water Pb inventories of this region occur in response to the changing position of the dust plume. Alternatively, these features may be perennial, reflecting the locations of highest annual mineral dust fluxes. For the ETA this is potentially the case, as mineral dust deposition rates are highest in this region during the boreal winter, when the dust plume is situated at lower latitudes20,22. However, the magnitude of mineral dust transport to sites in the WTA by the dust plume is relatively consistent throughout the seasonal cycle18. Ocean circulation can act to redistribute and mix the different atmospheric Pb inputs to surface waters. A significant role for large-scale redistribution of surface ocean Pb in the tropical North Atlantic is negated, however, by the well-defined atmospheric input signals, which coincide with the changing positions of the dust plume.
If this interpretation is correct, it implies that the residence time of Pb in ocean surface waters in this region may be on the order of months, to produce and preserve such spatially distinct and seasonal isotope signatures. In particular, the residence time must be long enough to allow highly variable atmospheric inputs to be averaged to produce the observed smooth and systematic spatial variability in Pb isotope compositions (Fig. 2). However, it must also be short enough to avoid any ‘memory’ of previous dust
0 10 20 30 40 50 60 70 80 90 100
10 20 30 40 50 60 70 80 90 100 0
r2 = 0.62
0 10 20 30 40 50 60 70 80 90 100
10 100 1,000
Atmospheric Al concentration (ng m–3)
0.1 0.2
0.5 1
2 3
Pb
min
(%) EF
crust
approach
Pbmin (%) Isotope mass balance approach
Pb
min
(%) Isotope mass balance approach
a
[image:8.595.46.290.51.378.2]b
Figure 5 | Results of mineral dust derived Pb proportion estimates for the aerosol total digests.(a) comparison between the proportions of mineral dust derived Pb (Pbmin) in the total digests of aerosol samples, as
estimated using the isotope mass balance versus the enrichment factor (EF) based approaches. The grey line denotes a 1:1 relationship. Panel (b) the proportion of Pbminin the total aerosol digests estimated
using the isotope mass balance approach plotted versus atmospheric Al concentrations, as a proxy for atmospheric mineral dust abundance. The black contours denote constant anthropogenic Pb (Pbanth) concentrations
for the atmosphere (in ng m3), calculated for mineral dust with Pb/Al ratio of 2.09104(ref. 44). Uncertainty in the Pb
minproportion
plume positions and redistribution of this input signal by ocean circulation.
Our results may therefore suggest a substantially shorter residence time for Pb in ocean surface waters of the studied area than the value of several years that is typically assumed, based on investigations of oligotrophic regions of the ocean13,14. Although this interpretation requires validation by further studies, we can speculate that enhanced scavenging rates of Pb in the tropical Atlantic surface waters could be related to the large inputs of mineral dust in this region. Mineral dust is expected to be a sink as well as a source of Pb through re-adsorption of Pb onto the surfaces of mineral dust particles36–39,47(Fig. 6) and by acting as ballast, increasing the rate at which particulate organic material is removed from the ocean surface50.
The detection of Pbmin in the ocean surface also enables the
study of factors that govern its atmospheric flux. Such insights will prove useful in assessing how changes in anthropogenic and natural Pb fluxes may affect the Pb budgets of other oceanic regions. The relative proportion of Pbmin and Pbanth in ocean
surface waters (os) will depend on their relative atmospheric concentrations (at), deposition velocities (dp) and solubilities (sol; equation (5)).
Pbmin=Pbanth
ð Þos¼ðPbmin=PbanthÞatðPbmin=PbanthÞdp
ðPbmin=PbanthÞsol
ð5Þ
The results of our leaching procedure suggest that (Pbmin/Pbanth)solE0.01 (Fig. 6). However, given the uncertainty about how well the leaching conditions replicate relevant natural processes, we derive a more conservative constraint of (Pbmin/Pbanth)solr0.1. In any case, this solubility difference
requires the atmospheric deposition of Pbmin to greatly exceed
that of Pbanthto reproduce the large observed Pbminproportions
(30–50%) in ocean surface waters. In the following, we investigate whether realistic relative atmospheric concentrations of Pbmin
and Pbanth alone can be responsible for the higher Pbmin
deposition rates that are needed, or whether the preferential deposition of Pbminover Pbanthis also required (that is, different
deposition velocities).
Over short timescales (approximately days), the relative proportions of Pbmin and Pbanth in the atmosphere are highly
variable (B2–60% Pbmin), which can be predominantly ascribed
to variations in atmospheric mineral dust concentrations (Fig. 5). To investigate the impact of such changes on surface water Pb budgets, it is necessary to constrain the relative atmospheric concentrations of Pbminand Pbanth, averaged over the residence
time of Pb in ocean surface waters. The Pb residence time in surface waters of this region may be as short as several months (see above), whereby the maximum Pbmin contributions to
surface waters possibly relate to the seasonal migration of the North African dust plume. During the seasonal dusty periods, typical monthly averaged atmospheric mineral dust concentra-tions at sites in the ETA and WTA are about 20–50mg m3 (refs 18,20). These values likely represent the highest relevant atmospheric mineral dust concentrations, since averaging over longer timescales will include less dusty periods. Assuming an Al concentration of 8% and Pb/Al¼2.09104 for mineral dust, this corresponds to atmospheric Pbmin concentrations of
0.4–0.8 ng m3. Coupled with the median atmospheric Pbanth
concentration (0.4 ng m3) determined from the aerosol total digests (omitting the two anomalously values for ‘Algerian’ samples), this results in (Pbmin/Pbanth)atratios of 1–2 (Table 3).
Hence, even during the dustiest periods of the year, the average atmospheric Pbminconcentrations are unlikely to greatly exceed
those of Pbanth. A more conservative approach can be adopted by
coupling the lowest estimated atmospheric Pbanthconcentrations
of 0.1 ng m3 with the highest reasonable average atmospheric Pbminabundance of 0.8 ng m3, which sets a maximum possible
(Pbmin/Pbanth)atratio of 8.
Particles suspended in the atmosphere are transferred to ocean surface waters through either wet or dry deposition. The main removal mechanism in dry deposition is gravitational settling, which becomes less efficient with decreasing particle size34. Anthropogenic enrichments of trace metals in aerosols are known to be concentrated in smaller particles (B0.1–1mm) than mineral dust (B2mm following transport to the WTA)51,52. Models therefore parameterize mineral dust to be preferentially deposited over finer anthropogenic particles during dry deposition and this is supported by field observations22,36,53–55. In contrast, wet deposition is considered to efficiently remove both mineral dust and finer anthropogenic particles53. Therefore, the relative deposition velocities of Pbmin and Pbanth depend on the relative
importance of wet versus dry deposition, which in turn is determined by the amount of precipitation in the relevant region. In our study area, the ITCZ marks a location of intense precipitation (up to 10 mm day1, annual average), while the area immediately to the north is characterized by much lower precipitation rates (0–1 mm day1, annual average)56. Consequently, wet deposition is the dominant deposition mode in the ITCZ57, whereas further north, where the relative maxima in Pbmincontributions to seawater are observed, dry deposition is
estimated to account for 95% of the atmospheric dust flux to the ocean45.
Aluminium concentration data for surface seawater suggests that mineral dust derived trace metals fluxes are larger to the north (430°N) and south (o10°N) of the observed relative
maxima in Pbmin contributions to surface waters32,58,59. Most
likely, this reflects more efficient dust removal in regions where wet deposition is important or dominant. Hence, the observed geographic positions of aerosol fluxes with the highest Pbmin
proportions is likely not coincident with the highest absolute fluxes of Pbmin to this region. This suggests that preferential
deposition of Pbminover Pbanthby dry deposition is a key factor
Fractional solubility (%)
0 10 20 30 40 50 60 70 80 90 100
10 20 30 40 50 60 70 80 90 100 0
P = 0.009 Gradient = –0.9
r2 = 0.56
[image:9.595.306.548.50.226.2]Pbmin proportion (%)
Figure 6 | The relationship between solubility and proportion of mineral dust derived Pb.Results of the fractional solubility of Pb in the leaching procedure relative to the total digests as a function of estimated proportion of mineral dust derived Pb in each aerosol sample. Displayed Pbmin
in producing the observed high proportions of Pbminin the ocean
surface. To test this hypothesis, we carried out a sensitivity test, which investigates the (Pbmin/Pbanth)dpratios needed to produce
the observed values of (Pbmin/Pbanth)os¼0.3–0.5 (equation (5)),
using the previously derived boundary conditions of (Pbmin/Pbanth)at¼1–2 and o8, and (Pbmin/Pbanth)solr0.1
(Table 3). The results of the test support the hypothesis, as they demonstrate that dry deposition, characterized by preferential removal of Pbmin over Pbanth with (Pbmin/Pbanth)dp41,
[image:10.595.43.554.86.221.2]is required for most of the investigated parameter space (Table 3).
Climatological models of aerosol deposition to open ocean surface waters have parameterized dry deposition velocities as 0.02–0.2 cm s1 and 0.4–2 cm s1 for fine (o1mm; anthropo-genic) and coarse particles (41mm; mineral dust) respectively, which corresponds to (Pbmin/Pbanth)dp of about 10–20 (refs
22,36,54,54). The dominance of aerosol flux by dry deposition, therefore likely increases the proportions of Pbmin in surface
water by a factor of 10 to 20, relative to a wet deposition dominated flux. Hence, the observed 30–50% proportion of Pbmin
in surface waters would likely only be 2–5% in a wet deposition dominated regime, and would be undetectable using the isotopic data. In this context, it is important to emphasize that the dominance of dry deposition is relatively unusual, with wet deposition estimated to dominate the atmospheric aerosol flux to the global ocean60.
In summary, significant amounts of up to 30–50% of Pb from natural sources (mineral dust) were detected in ocean surface waters of the tropical North Atlantic. This finding reflects the now almost complete global phase-out of leaded petrol and can be viewed as a success of environmental policy. Relative maxima in Pbmin contributions to surface waters occur in restricted
latitudinal bands, and their location and magnitude are influenced by the position of the North African dust plume, which features the highest atmospheric mineral dust concentra-tions observed for the global ocean, and the dominance of dry deposition which favors the deposition of Pbmin over Pbanth.
Acting together, these factors are relatively specific to this region of the ocean. The observation that Pbanth still contributes up to
50% of the Pb in these surface waters hence suggests that Pb emissions from other anthropogenic activities, such as the combustion of unleaded petrol, coal burning and metal smelting, remain the dominant sources of Pb to the ocean, even following the global cessation of leaded petrol usage1,4.
Methods
Sample collection.Samples utilized for this study were collected during the second leg of the GEOTRACES GA02 section on theRV Pelagia(cruise 64PE321, 11th June–8th July, 2010) and during the GEOTRACES GA06 section on theRRS Discovery(cruise D361, 7th February–19th March, 2011). Unfiltered surface waters (2–3 m depth) were collected while underway, during both of these cruises, using a towed ‘fish’. Within trace-metal-clean environments on the ships, samples for total Pb concentration and isotope composition analysis were subsequently transferred into pre-cleaned LDPE bottles and triple bagged. Back on shore, within a clean environment at Imperial College London, samples were subsequently acidified to an approximate pH of 2 by addition of ultrapure 6 M HCl.
During the GA02 section (cruise PE321), additional seawater for dissolved (o0.2mm) multi-element trace metal analysis was collected with an all-titanium ultraclean CTD sampling system metals61using samplers constructed from polyvinylidene difluoride (PVDF)62. Samples were filtered from the PVDF
samplers under pressure (1.5 atm) from inline pre-filtered nitrogen gas in a clean environment aboard the ship. The filters utilized were 0.2mm Sartobran-300 (Sartorius) filter cartridges. Samples were collected into pre-cleaned63LDPE
sample bottles (500 ml), following five rinses of the bottles with the sampled seawater. Finally, filtered samples were acidified on board to a pH of 1.7 to 1.8 by addition of ultrapure HCl (Baseline, Seastar Chemicals).
Samples for particulate (40.45mm) elemental concentration analysis were collected during the GA06 section (cruise D361). In a clean environment, particles were collected directly from trace metal clean 10 l OTE (Ocean Test Equipment) sample bottles, under pressure (1.7 bar) of filtered nitrogen gas, onto acid-cleaned 25 mm Supor polyethersulfone (PES) membrane disc filters (Pall, 0.45mm). Samples were stored frozen (20°C) until shore-based analysis.
The results reported here are limited to those obtained for only the shallowest filtered (o0.2mm) and particulate (40.45mm) samples collected during the two respective cruises (9–25 m depth; Supplementary Table 1).
Eleven aerosol samples were collected for elemental and Pb isotope analysis on the GA06 section cruise in the eastern tropical North Atlantic (ETA) by high-volume sampling (1 m3min1) onto Whatman 41 cellulose fibre filters
(203 mm241 mm)64,65(Supplementary Table 6). Sampling was automatically controlled according to the wind direction, and paused whenever the wind direction was unfavourable to avoid contamination from the ship’s emissions. The filters were cleaned before aerosol collection in acid baths of 0.5 M HCl (1 h) followed by 0.1 M HNO3(1 h) with thorough rinses with 18.2 MOcm water from a Millipore system after removal from each acid bath, at the University of East Anglia. Filters were fitted into the sampling apparatus within a laminar flow hood. Three sampling blanks were collected during the cruise by placing clean filters into the sampling apparatus, without turning on the pumping system. In addition, one cleaned Whatman 41 filter was taken to assess the blank contribution from the filter material. Following sample collection, the filters were stored in zip-lock plastic bags and frozen at 20°C.
Seawater Pb concentration and isotope composition analysis.The Pb concentrations and isotope compositions of the unfiltered seawater samples were determined using thermal ionization mass spectrometry (TIMS) following previously described analytical techniques66at Imperial College London. Briefly, Pb concentrations were determined on 50 ml of seawater by isotope dilution. Following equilibration with a known quantity of a Pb double spike (207Pb–204Pb),
Pb was purified from the seawater by Mg(OH)2co-precipitation and a single-stage Table 3 | Results of sensitivity test on (Pbmin/Pbanth)dpusing constraints for (Pbmin/Pbanth)atand (Pbmin/Pbanth)soloutlined in the
main text.
(Pbmin/Pbanth)sol (Pbmin/Pbanth)at
Representative Maximum
1 2 8
0.01 30.0–50.0 15.0–25.0 3.8–6.3 0.02 15.0–25.0 7.5–12.5 1.9–3.1
0.03 10.0–16.7 5.0–8.3 1.3–2.1
0.04 7.5–12.5 3.8–6.3 0.9–1.6
0.05 6.0–10.0 3.0–5.0 0.8–1.3
0.06 5.0–8.3 2.5–4.2 0.6–1.0
0.07 4.3–7.1 2.1–3.6 0.5–0.9
0.08 3.8–6.3 1.9–3.1 0.5–0.8
0.09 3.3–5.6 1.7–2.8 0.4–0.7
0.10 3.0–5.0 1.5–2.5 0.4–0.6
ion exchange chromatography procedure, before analysis by TIMS. To distinguish measurements affected by spurious high blanks, Pb concentrations were measured in duplicate or triplicate for the majority of samples, and any anomalously high values were discarded. Measurements of Pb isotope compositions were conducted on Pb purified from about 2 l of seawater by Mg(OH)2co-precipitation and a two stage ion exchange chromatography procedure. Instrumental mass bias encountered during the TIMS analyses was corrected using a Pb double spike (207Pb–204Pb). Uncertainty in Pb concentrations (1 s.d.) and isotope compositions (2 s.d.) are assessed through replicate analyses of in-house seawater standards66.
The 0.2mm filtered samples from the WTA were analysed for multiple metals, including Pb as described by Middaget al.67, at the University of California, Santa Cruz. Briefly, Nobias PA1 chelating resin was used to pre-concentrate the metals in the seawater sample and to remove interfering sea salts, before analysis on a sector-field inductively coupled plasma mass spectrometer (Thermo Element XR Magnetic Sector ICP-MS). Analyses of SAFe and GEOTRACES reference samples agreed with consensus values for Pb and results from a crossover station agreed between the different occupations67.
Determination of Pb in the particulate samples was carried out at the University of Plymouth using a three-step sequential acid digestion following the method of Ohnemuset al.68. All samples were analysed using ICP-MS (Thermo Fisher X
Series 2) with use of a collision/reaction cell utilizing 7% H in He. Replicate blank filters were processed in the same manner and the mean value deducted from the samples. Evaluation of the digestion efficiency was assessed using certified reference materials (CRMs) BCR-414 (Trace elements in plankton; Institute for Reference Materials and Measurements) and SO-2 (podzolic B horizon soil; Canadian CRM Project) and the subsequent Pb data was in agreement with the certified values.
Aerosol elemental and isotopic analysis.Aerosol sample preparation was conducted within clean room laboratories at Imperial College London. A portion of each Whatman 41 filter (equivalent toB25–50% of the total exposed filter area) was subjected to a ‘total’ digestion procedure with the aim of liberating all available Pb and Al for analysis. In addition, a second portion of each filter (equivalent to B12–50% of the total exposed filter area) was subjected to leaching, with the aim of liberating the Pb and Al that is readily soluble in ‘natural’ waters for analysis, following previously published methods54,64,65. The filter portions were taken by
cutting the filters using ceramic scissors into pieces that were collected in 60 ml or 90 ml Teflon vials inside a laminar flow bench.
For the total digestions, the Whatman 41 cellulose filter and organic material in the aerosol, were first treated on a hotplate in open fluoropolymer (Savillex) vials using, 10–20 ml 15.6 M HNO3at 90–120°C, for 12–15 h; 10 ml 15.6 M HNO3þ1 ml 9.8 M H2O2at 90–120°C, for 12–15 h; and 4 ml 15.6 M HNO3þ1 ml 11.6 M HClO4, starting at 120°C and increasing to 220°C over 12–15 h. Residual HClO4was removed by repeated cycles of refluxing with 1–2 ml 15.6 M HNO3and evaporation to dryness at 140–220°C. During the third step, 1–2 ml of 15.6 M HNO3was added periodically to dilute the HClO4and help control the rate of the reaction. The second step was omitted for filter portions representingo50% of the total exposed area and the third step was repeated if the digestion of organics was incomplete. Following this, the aerosol samples were digested in closed vials in 3 ml 15.6 M HNO3þ1 ml 28 M HF, at 120–140°C for 4 days, with regular treatment in an ultrasonic bath. Finally, the HNO3–HF solutions were evaporated to dryness and samples were re-dissolved in 4 M HNO3. The Pb blank of the total digestion procedure was 53±48 pg (1 s.d.,n¼7), which iso0.05% of the sample Pb and therefore negligible.
For the leaching of filters, Whatman 41 filter portions were submersed in an ammonium acetate solution (B0.5 M aqueous NH3solution–1 M acetic acid, pH 4.7; 25 ml of solution per 25% of total exposed filter area) and shaken for 60 min at 200 r.p.m. The solutions were then passed through 0.2mm Whatman cellulose acetate filters within 60–75 min of the addition of the leaching solutions. The filtered solutions were evaporated to dryness and re-dissolved in 4 M HNO3. The Pb blank of the leaching procedure was 48±27 pg (1 s.d.,n¼6), which iso0.05% of the liberated Pb in the samples and is therefore negligible.
Elemental concentrations (Pb and Al) were determined on 10% aliquots of the total digestion and leach solutions, which were evaporated to dryness and re-dissolved a suitable volume of 1 M HNO3. Lead concentrations (average of206Pb, 207Pb and208Pb) were determined using an Agilent 7700x quadrupole ICP-MS
instrument in the ‘no gas’ mode of the collision-reaction cell, at the Natural History Museum, London. Aluminium concentrations were determined for the total digestion solutions by inductively coupled plasma atomic emission spectroscopy (ICP-AES) using a Thermo iCap 6500 Duo instrument, also at the Natural History Museum, London. For the leach solutions, Al concentrations were determined by quadrupole ICP-MS.
The Pb blank content of the aerosol sampling and digestion/leaching methods were determined using ‘blank’ Whatman 41 filters to be 25±16 ng filter1
(1 s.d.,n¼4) for the total digestion procedure, and 12±7 ng filter1(1 s.d.,n¼4)
for the leaching technique. Since these blanks correspond to contributions of between 0.4 and 7.2% of the Pb extracted by the total digestion and leach procedures, the Pb concentrations were corrected for this blank using the mean values. Atmospheric Pb and Al concentrations were calculated from the determined concentrations and the known volume of the air sampled (Supplementary Table 6). The uncertainty of the atmospheric Pb concentrations
was calculated by propagating the 1 s.d. of the mean blank values though the blank correction.
Lead isotope compositions were determined on aliquots (0.6–53%) of the total digestion and leach solutions, corresponding to 10–100 ng of Pb (typically 20 ng Pb), at Imperial College London. Lead was purified from the sample matrix by processing through a two-stage ion exchange chromatography procedure adapted from Paulet al.66(Supplementary Table 7). The blank contribution of the ion
exchange procedure was 14±13 pg (2 s.d.,n¼7), which iso0.3% of the Pb processed and is therefore negligible. The isotope composition of the purified Pb was subsequently analysed using the same measurement protocols as for seawater samples66.
Loads of 10 and 20 ng SRM NIST 981 Pb (common Pb isotopic standard) were analysed at the start of every measurement session, with values in good agreement with literature results (Supplementary Table 8). The basaltic reference materials BCR-2 and BHVO-2 (US Geological Survey), with about 20 ng of Pb, were also processed though the ion exchange procedure and analysed alongside the samples. To this end, powdered aliquots of 0.04–0.2 g of these reference materials were digested in a 3:1 mixtures of 28 M HF and 15.6 M HNO3(total volume of 6–8 ml), at 140°C for 4 days with regular treatments in an ultrasonic bath, before chemical separation. Results are in good agreement with published reference values (Supplementary Table 8). The reproducibility of the206Pb/204Pb,206Pb/207Pb and208Pb/207Pb ratios of BCR-2 (n¼9) are taken to be representative for the samples.
The blank of the Whatman 41 filters and the sampling procedure contributes significantly to the total amount of Pb in the aerosol samples (0.4–7.2%). The Pb isotope data of the aerosols were hence corrected of this blank contribution, using the mean Pb contents and isotope compositions determined for the blank filters. The isotope composition determined for the blank filters subjected to the total digestion procedure was206Pb/204Pb¼18.40±0.61,206Pb/207Pb¼1.175±0.037
and208Pb/207Pb¼2.437±0.023 (mean±2 s.d.,n¼4). For the leaching procedure
blank, the respective results were 18.32±0.30, 1.172±0.022 and 2.437±0.012
(mean±2 s.d.,n¼4).
The uncertainty of the blank correction was calculated by separately propagating through the blank correction (1) the 1 s.d. uncertainty of the mean blank content (the larger 2 s.d. uncertainty yields unrealistic negative values), and (2) the 2 s.d. of the blank isotope composition. The total uncertainty for each sample was then calculated by standard addition of variances from (1) the propagated uncertainty in the blank contribution (1 s.d.), (2) the propagated uncertainty of the blank isotope compositions (2 s.d.), and (3) the 2 s.d. reproducibility of the replicate Pb isotope analyses of 20 ng BCR-2 aliquots. The former two variances encompass the uncertainty generated by the Pb blank encountered during sample collection, while the latter variance accounts for the uncertainty induced by the chemical separation and mass spectrometric analysis.
Data availability.All relevant data are either presented in the main article or Supplementary Information File and are available from the authors at request.
References
1. Nriagu, J. O. & Pacyna, J. M. Quantitative assessment of worldwide contamination of air, water and soils by trace-metals.Nature333,134–139 (1988).
2. Boyle, E. A.et al.Anthropogenic lead emission in the ocean the evolving global experiment.Oceanography27,69–75 http://dx.doi.org/10.5670/pceanog.2014.10 (2014).
3. Reuer, M. K. & Weiss, D. J. Anthropogenic lead dynamics in the terrestrial and marine environment.Philos. Trans. A Math. Phys. Eng. Sci.360,2889–2904 (2002).
4. Pacyna, J. M. & Pacyna, E. G. An assessment of global and regional emissions of trace metals to the atmosphere from anthropogenic sources worldwide.
Environ. Rev.9,296–298 (2001).
5. Veron, A. J., Church, T. M., Flegal, A. R., Patterson, C. C. & Erel, Y. Response of lead cycling in the surface sargasso sea to changes in tropospheric input.
J. Geophys. Res. Oceans98,18269–18276 (1993).
6. Wu, J. F. & Boyle, E. A. Lead in the western North Atlantic Ocean: completed response to leaded gasoline phaseout.Geochim. Cosmochim. Acta61,
3279–3283 (1997).
7. Kelly, A. E., Reuer, M. K., Goodkin, N. F. & Boyle, E. A. Lead concentrations and isotopes in corals and water near Bermuda, 1780-2000.Earth Planet. Sci. Lett.283,93–100 (2009).
8. Veron, A. J., Church, T. M., Patterson, C. C. & Flegal, A. R. Use of stable lead isotopes to characterize the sources of anthropogenic lead in North-Atlantic surface waters.Geochim. Cosmochim. Acta58,3199–3206 (1994). 9. Alleman, L. Y.et al.Isotopic evidence of contaminant lead in the South
Atlantic troposphere and surface waters.Deep-Sea Res. Pt. II48,2811–2827 (2001).