This is a repository copy of The impact of ditch blocking on the hydrological functioning of blanket peatland.
White Rose Research Online URL for this paper: http://eprints.whiterose.ac.uk/104376/
Version: Accepted Version
Article:
Holden, J orcid.org/0000-0002-1108-4831, Green, SM, Baird, AJ
orcid.org/0000-0001-8198-3229 et al. (6 more authors) (2017) The impact of ditch blocking on the hydrological functioning of blanket peatland. Hydrological Processes, 31 (3). pp. 525-539. ISSN 0885-6087
https://doi.org/10.1002/hyp.11031
© 2016 John Wiley & Sons, Ltd. This is the peer reviewed version of the following article: “Holden J, Green SM, Baird AJ, Grayson RP, Dooling GP, Chapman PJ, Evans CD, Peacock M, Swindles G. The impact of ditch blocking on the hydrological functioning of blanket peatlands. Hydrological Processes. 2017;31:525–539. doi: 10.1002/hyp.11031”, which has been published in final form at https://doi.org/10.1002/hyp.11031. This article may be used for non-commercial purposes in accordance with Wiley Terms and
Conditions for Self-Archiving.
eprints@whiterose.ac.uk https://eprints.whiterose.ac.uk/ Reuse
Unless indicated otherwise, fulltext items are protected by copyright with all rights reserved. The copyright exception in section 29 of the Copyright, Designs and Patents Act 1988 allows the making of a single copy solely for the purpose of non-commercial research or private study within the limits of fair dealing. The publisher or other rights-holder may allow further reproduction and re-use of this version - refer to the White Rose Research Online record for this item. Where records identify the publisher as the copyright holder, users can verify any specific terms of use on the publisher’s website.
Takedown
If you consider content in White Rose Research Online to be in breach of UK law, please notify us by
The impact of ditch blocking on the hydrological functioning of blanket peatlands
1
Joseph Holden1, Sophie M. Green1,4, Andy J. Baird1, Richard P. Grayson1, Gemma P. Dooling1,4,
2
Pippa J. Chapman1, Christopher D. Evans2, Mike Peacock3, Graeme Swindles1
3
4
1water@leeds, School of Geography, University of Leeds, Leeds, LS2 9JT, UK
5
2Centre for Ecology and Hydrology, Deiniol Road, Bangor, LL57 2UP, UK.
6
3Department of Environment, Earth and Ecosystems, The Open University, Walton Hall, Milton
7
Keynes, MK7 6AA, UK
8
4Department of Geography, College of Life and Environmental Sciences, Amory Building,
9
University of Exeter, Rennes Drive, Exeter, EX4 4RJ, UK.
10
11
Abstract
12
Ditch blocking in blanket peatlands is common as part of peatland restoration. The effects of
ditch-13
blocking on flow regimes and nearby water tables were examined in a field trial. After an initial six
14
month monitoring period, eight ditches had peat dams installed 10 m apart along their entire length
15
(dammed), four of these ditches were also partially infilled through bank reprofiling (reprofiled).
16
Four ditches were left open with no dams or reprofiling (open). These 12 ditches and the
17
surrounding peat were monitored for a further 4 years. An initial five-fold reduction in discharge
18
occurred in the dammed and the reprofiled ditches with the displaced water being diverted to
19
overland flow and pathways away from the ditches. However, there was a gradual change over time
20
in ditch flow regime in subsequent years, with the overall volume of water leaving the dammed and
21
the reprofiled ditches increasing per unit of rainfall to around twice that which occurred in the first
22
year after blocking. Hence monitoring for greater than one year is important for understanding
23
hydrological impacts of peatland restoration. Overland flow and flow in the upper ~4 cm of peat
24
was common and occurred in the inter-ditch areas for over half of the time after ditch blocking.
25
There was strong evidence that topographic boundaries of small ditch catchments, despite being
26
defined using a high-resolution LiDAR-based terrain model, were not always equivalent to actual
27
catchment areas. Hence caution is needed when upscaling area-based fluxes, such as aquatic carbon
28
fluxes, from smaller scale studies including those using ditches and small streams. The effect of
29
ditch blocking on local water tables was spatially highly variable but small overall (time-weighted
30
mean effect < 2 cm). Practitioners seeking to raise water tables through peatland restoration should
31
first be informed either by prior measurement of water tables or by spatial modelling to show
32
whether the peatland already has shallow water tables or whether there are locations which could
33
potentially undergo large water-table recoveries.
34
Keywords:peat, drainage, ditches, wetland, restoration, water tables, discharge
36
Introduction
38
Peatlands are an important form of wetland where net litter formation has exceeded decomposition,
39
enabling the build-up of organic matter as peat. Blanket peatlands are a type of rainwater-fed
40
peatland which can occur even on sloping ground as long as there is sufficient rainfall and impeded
41
subsurface drainage. Blanket peatlands typically occur in hyper-oceanic regions of the world
42
(Charman, 2002; Gallego-Sala and Prentice, 2012). The hydrological regime of blanket peatlands
43
tends to be dominated by water movement at or close to the surface due to saturation of the peat and
44
a low hydraulic conductivity throughout most of the peat profile (Price, 1992; Evanset al., 1999;
45
Holden and Burt, 2003; Holden and Burt, 2003).
46
47
In the UK, blanket peat accounts for 87 % of peatland cover (Bairdet al., 2009), equivalent to 6.5
48
% of the land area, and exists primarily in the uplands, covering mostly gently rolling terrain.
49
Blanket peat depths are typically 1-3 m but can be in excess of 6 m in places. Many UK peatlands
50
were artificially drained between the 1940s and 1980s to support agricultural demand in areas of
51
marginal productivity (Green, 1974; Baldocket al., 1984), for commercial forestry (Holdenet al.,
52
2007), to aid peat extraction for horticulture and energy production, and because of the perception
53
that peatland drainage could alleviate flood risk (Newson, 1992; Holdenet al., 2006; Acreman and
54
Holden, 2013). Drainage of UK blanket peatland has been relatively widespread, most commonly
55
through ditch cutting. Cross-slope ditches have been shown to alter water-table depths and
56
dynamics, typically resulting in deeper and more highly fluctuating water tables immediately
57
downslope of each ditch (compared with intact slopes) because ditches effectively shorten the
58
upslope contributing area (Holden and Burt, 2003; Holdenet al., 2006; Holdenet al., 2011). The
59
ratio of subsurface flow to overland flow has been shown to be greater in ditched peatland slopes
60
than for undrained systems nearby (Holdenet al., 2006). Even when ditches are orientated in a
61
downslope direction in blanket peatlands there could be local effects on peatland water tables and
62
therefore on the propensity to saturation and the amount of overland flow. This is because water
63
levels in the ditch will tend to be lower (relative to a datum) than water tables within the
64
surrounding peat and hence there will be a hydraulic gradient towards the ditch. However, while
65
hydraulic conductivity can be high very near the peat surface and above pipes in blanket peatlands
66
(Cunliffeet al., 2013), for most of the peat profile hydraulic conductivity appears to be very low,
67
albeit highly variable (Holden and Burt, 2003; Lewiset al., 2011). Therefore, it may be that
68
hydraulic gradient effects on water flow into ditches running downslope may be minor.
69
70
In response to concerns about biodiversity, erosion, carbon storage and potentially exacerbated
71
flood risk, many UK peatland ditch networks are being blocked as part of peatland restoration
schemes (Armstronget al., 2009; Parryet al., 2014). Many different techniques are used for ditch
73
blocking; particularly common is the installation of peat dams at intervals of several metres along
74
the course of the ditch (Armstronget al., 2009). Sometimes ditches are ‘reprofiled’ by moving peat
75
from ditch sides into ditch channels to reduce the sidewall gradient, the result being a much
76
shallower channel on which a vegetation cover develops (Parryet al., 2014).
77
78
Ditch blocking and reprofiling are likely to alter hydrological flowpaths in blanket peatlands.
79
Depending on dam success, water can pond to create pools (Peacocket al., 2013; Beadleet al.,
80
2015) and excess water can be forced out of the ditch channel across the surrounding peat surface to
81
follow topographic drainage routes (Holden, 2006). These routes may differ from the routes that
82
existed before blocking (Lane and Milledge, 2012). The effects of drainage on peatland
83
hydrological processes have been shown to change over long time periods (years and decades) as
84
the peat system adjusts in response to management interventions (Holdenet al., 2006). In the same
85
way, there may also be lag effects in response to peatland restoration measures such as ditch
86
blocking. These apparent lag effects have been observed in water-table response time series (Wilson
87
et al., 2010) and in drained, blocked and control comparison studies of water-table dynamics
88
(Holdenet al., 2011). However, following ditch blocking, it has not been established whether the
89
flow regime from blanket peat hillslopes progressively changes over time in the months and years
90
after ditches have been blocked.
91
92
There have been few studies of the hydrological impact of ditch blocking in situations where
93
peatland ditches run predominately downslope. Most studies have examined water-table behaviour
94
in and around ditches and blocked blanket peat ditches where the ditches are orientated across the
95
slope (e.g. Worrallet al., 2007; Gibsonet al., 2009; Wilsonet al., 2010; Holdenet al., 2011) or
96
where the site is virtually flat (e.g. Haapalehtoet al., 2011; McCarter and Price, 2013). However,
97
there are large areas of blanket peatland with both downslope and cross-slope ditch layouts in the
98
UK.
99
100
There is an assumption for blanket peatlands that the surface topography draining into a point in a
101
ditch or stream is equivalent to the water source area for that point. This assumption seems
102
reasonable given the dominance of near-surface flow within blanket peat systems. However, it has
103
not been tested. In particular, given that drains or drain blocking may alter hydraulic gradients on
104
site, it is important to establish whether surface topography can be used as a reasonable guide to
105
determining the water source area. A key variable which relies on good quality area-averaged
106
(areal) water flow information is the peatland aquatic carbon flux. These fluxes (and those of other
parameters) are often expressed as mass per unit area per unit time so that they can be directly
108
compared to free-phase carbon gas fluxes which are typically reported in the same format (e.g.
109
Gibsonet al., 2009; Billettet al., 2010). Many aquatic carbon sampling points have been located in
110
small catchments including peatland ditch systems (Gibsonet al., 2009; Turneret al., 2013). Areal
111
flux values are often upscaled in modelling studies or applied to larger catchments (e.g. Worrallet 112
al., 2007). However, at smaller scales in blanket peatlands there is greater risk that the surface
113
catchment area may not represent the actual catchment area of the channel. Differences between the
114
hydraulic gradient and the surface slope are more likely to affect catchment water budget
115
calculations at the scale of small catchments around ditches. In addition, radiocarbon data have
116
shown that the sensitivity of different peatlands to carbon loss following drainage is highly variable
117
due to large differences in their hydraulic properties (Evanset al., 2014). Therefore, considerable
118
caution is required when translating understanding from studies undertaken in one peat type (e.g.
119
continental raised bog) to another (e.g. blanket bogs), or even from one blanket bog to another
120
where the drainage characteristics vary.
121
122
This study aims to: i) determine the effects of typical ditch blocking methods on flow regimes for
123
ditches that are predominantly downslope; ii) determine whether the surface topographic catchment
124
area is suitable for water budget calculations at the drainage ditch scale in blanket peatlands; iii)
125
determine whether there is evidence for a lagged response to ditch blocking in the discharge regime
126
from the peat system and iv) test whether ditch blocking significantly affects water tables in the
127
nearby peat in situations where drains run in a predominantly downslope direction.
128
129
130
2. Methods
131
2.1 Study site
132
The study was carried out at the Migneint blanket peatland in the upper Conwy catchment in North
133
Wales (52.97°N, 3.84°W) on an area of hillslope located at approximately 500 m altitude, with a
134
across an area ofc. 2 ha, drained by a set of 12 parallel ditches running in a roughly downslope
135
direction (Figure 1). The ditches had a mean spacing of 16 m (range 11 to 26 m), mean slope of 4.5
136
(range 3.9 to 5.1), and a mean length of 99 m (range 84 to 107 m). The ditches were mostly
137
shallow with a mean depth of 0.58 m (range 0.1 m to 1.53 m) and in some cases overgrown by
138
vegetation, although all were hydrologically functional at the start of the experiment. Peat depths in
139
the study area range from around 0.5 to 2.5 m, and the vegetation comprises a typical blanket
140
vaginatumL. (hare's tail cotton grass) and various species ofSphagnum(bog mosses). The peat in
142
this area overlies Cambrian mudstones and siltstones (Lynas, 1973).
143
144
In February 2011, eight of the ditches were blocked using two common methods widely used in
145
blanket bogs (Parryet al., 2014), and four open ditches were retained as controls (Figure 1). The
146
two ditch-blocking methods used were damming and reprofiling plus damming (henceforth referred
147
to as reprofiling). The ditches chosen to receive each treatment were assigned by a statistician,
148
taking into account measured flow rates from the ditches. Those ditches with similar flow rates
149
were grouped together and then treatments randomly assigned within groups. Within this random
150
approach, reprofiled ditches were not adjacent to one another as it was felt that this method was
151
most likely to impact on adjacent ditches through generating dispersed surface flow. Following
152
typical UK practice, peat dams were constructed at regular intervals (~10 m) along the ditch using
153
peat taken from ‘borrow pits’ next to the ditch immediately upslope of each dam. Pools formed
154
behind the dams and extended into the adjacent borrow pits forming water bodies of approximately
155
2-3m width, but with their lengths extending into the original ditch channel upslope by a distance
156
that was dependent upon the gradient of the hillslope. For ditches in the reprofiling treatment, ditch
157
vegetation was removed, the base of the ditch compressed and the ditch partially infilled with peat
158
scraped from ditch walls to reduce the steepness of the sidewall slope, and the vegetation replaced.
159
This treatment also involved the construction of peat dams at regular intervals. Given that the
160
ditches were orientated in a predominantly downslope direction it is probable that some pool
161
overspill could re-enter the same ditch channel downslope depending on hydrological flowpaths.
162
163
2.2 Measurements
164
Discharge and water-table equipment was installed in June 2010 and monitoring commenced in
165
August 2010. All monitoring equipment was removed in early February 2011 to allow for the eight
166
ditches to be blocked, and equipment reinstalled by the end of the month. Monitoring resumed for a
167
period of four years, until the end of February 2015. Rainfall was recorded using an automated
168
tipping bucket raingauge logged hourly which was located within the 2 ha study site. As the area of
169
study was relatively small and ditches closely spaced, rainfall variability between ditches should not
170
be a major factor affecting differences in ditch flow. All raingauges may be prone to error in catch,
171
particularly when there are strong winds. Therefore the gauge was placed in small hollow to
172
minimise these effects.
173
174
2.2.1 Discharge
Discharge from each ditch was measured using a 22.5ov-notch weir and a WT-HR 1000
water-176
height logger (TruTrack Ltd, Christchurch, New Zealand) recording at 15-minute intervals, with
177
logged values being an average (over 15 minutes) of readings taken every minute. The logger was
178
calibrated, so logged water heights were known to be accurate and the v-notch weir was calibrated
179
by collecting manual discharge data to create a stage-discharge relationship. The ditch flow weirs
180
measured both overland flow and lateral subsurface flow that entered and flowed along the ditches.
181
182
Discharge of overland flow on the areas between the ditches was monitored from July 2011 until
183
February 2015 to determine whether the volume of overland flow changed over time since ditch
184
blocking. Overland flow generated from the peat on both sides of each study ditch (Figure 1) was
185
channelled into one overland flow weir box per ditch using ultraviolet-stable polyvinyl chloride
186
(PVCu) soffit boards pushed into the peat to a depth of 3-5 cm. Microtopographic variation meant it
187
was impossible for the boards to remain at one depth across their length. The soffit boards varied in
188
length running from the approximate mid-point between ditches towards the ditch. Overland flow
189
channelled from one side of the ditch crossed over the ditch via a PVC pipe before entering the
190
overland flow weir box near the ditch. Overland flow weir boxes were gauged at 15-minute
191
intervals (averaged as for ditch discharge above) using TruTrack WT-HR 500 loggers and
192
calibrated with manual stage-discharge readings. The outflow from the overland flow weir boxes
193
occurred downslope of the main ditch weir to ensure that the monitored overland flow did not affect
194
water flow in the gauged ditch. The downslope location of the soffit boards also meant that they had
195
no impact on the measurement of ditch flow because any flow that they captured would not have
196
otherwise flowed into the ditch weirs had the soffit boards not been present. Because the soffit
197
boards were inserted to a depth of 3-5 cm, overland flow in this study refers to all water flow at the
198
surface and, on average, the flow in the upper 4 cm of the peat profile.
199
200
Over the study period there were occasional logger failures. Unreasonable values from the ditch
201
flow and overland flow records caused by, for example, icing up, or occasional one-off erroneous
202
readings from the pressure sensor were removed before data analysis. Where a data gap of two
203
points or fewer (215-min intervals) occurred in the automated record the values were infilled
204
using linear interpolation. Otherwise, data gaps were retained and reported as missing values to be
205
taken into account when interpreting the total water flux.
206
207
2.2.2 Water-table depths
208
Eighty-three dipwells were installed (Figure 1), of which 24 were fitted with automatic water-level
209
recorders. At the other dipwells, manual readings were taken approximately every three weeks in
summer and every six weeks in winter. The automated dipwells comprised high-density
211
polyethylene (HDPE) pipes, with an outside diameter (o.d.) of 32 mm, a length of 1000 mm and 3.5
212
mm wall thickness. These pipes were perforated with numerous 2 cm horizontal, 0.3 mm wide slits
213
spaced at intervals of 5 mm. The automated wells were located midway between each ditch and also
214
within each ditch to measure water level within the ditch (or water-table depth below the ditch floor
215
when the ditch was dry). They were fitted with either WT-HR 1000 water-height data loggers, or
216
Divers (DI240, 5 m, Schlumberger Water Services, Delft, The Netherlands), which measured and
217
recorded water tables at 2-hr intervals. Each data logger was manually calibrated, and thereafter
218
checked and cleaned throughout the project at regular intervals. Manually gauged dipwells were
219
made from 32 mm o.d.1000 mm (PVC) pipe with a 3.5 mm wall thickness. The tubes were
220
perforated with 8-mm diameter holes drilled at 100 mm intervals along four lines running
221
lengthwise along the pipe, with holes in each line offset from those in neighbouring lines by 50 mm.
222
One set of manually recorded dipwells were located at 2 m from each ditch both on the eastern and
223
western sides (coded x.2E or x.2W, where x is the ditch number) in line with an automated dipwell
224
within the ditch (coded x.0) and an automated dipwell installed half way between ditches (coded
225
x.mid). The installation of this set of dipwells was completed in August 2010. In June 2011, the
226
remaining manually-recorded dipwells were installed adjacent to 35 gas flux collars (our gas flux
227
data are not reported herein). These were located within the ditch channel and 1 m and 3 m west of
228
each ditch (coded Cx.0, Cx.1W or Cx.3W where x is the ditch number). In Ditch 5 the gas flux
229
collar was coincident with dipwell 5.0; hence, no additional manual dipwell was installed at that
230
point. All dipwells were surveyed for their altitudinal position using the x.mid dipwell as a local
231
transect datum in each case so that absolute water-table heights could be plotted relative to one
232
another across each dipwell transect. All dipwells were tested for their response time by measuring
233
the recovery of well water levels in response to a sudden withdrawal of water. The time for 90%
234
recovery ranged from a few seconds to 120 minutes. Hence our water-table data are deemed to be
235
very reliable as all our dipwells functioned well with rapid response times.
236
237
2.3 Calculations
238
Total discharges were calculated for each weir in m3(total volume over a given time period) and
239
mm (areal discharge over a given time period). Areal discharge was calculated by determining the
240
surface topographic catchment area of each weir. If areal discharge > rainfall this indicates that the
241
topographically-defined catchment area must be under-estimating the true area contributing flow to
242
the gauging point, and therefore suggests that water budget calculations at the ditch scale are
243
unreliable. Figure 1 shows the surface-derived catchment area for each ditch weir, calculated from
244
LiDAR digital elevation model (DEM) data provided by the National Trust using 50 cm grid cells.
However, damming of ditches may lead to changes in catchment areas for adjacent ditches, notably
246
if water is shed from a dammed ditch into an adjacent undammed ditch. While attempts were made
247
to minimise this effect in the current study by selecting a site in which the ditches follow an
248
approximately downslope direction, there may still be some spillage from pools in ditches where
249
the ditches do not run exactly downslope. To examine themaximumtheoretical effect of such
250
changes in surface flowpaths, a DEM was created where it was assumed that all of the dammed or
251
reprofiled ditches had been completely infilled with peat. The four open control ditches were,
252
however, left in place in the DEM. The catchment area for each ditch weir under this infilling
253
scenario is shown in Figure 1. There would also be some modifications to the surface catchment
254
areas for overland flow collectors under such a scenario. The catchment areas for both scenarios
255
(scenario 1: pre-blocking catchment areas; scenario 2: catchment areas assuming complete infilling
256
of dammed and reprofiled ditches) for the ditch and overland flow weirs are shown in Table 1 and
257
both are used when calculating the areal discharge from each weir. Note the infilling scenario is an
258
extreme one and unlikely to be fully met during the initial years after ditch blocking. However, by
259
calculating total areal discharge it will be possible to check whether any such water redistribution
260
effects have been occurring.
261
262
Scenario 2 results in very small catchment areas for the weirs in Ditches 3, 4, 5, 11 and 12 (Table 1,
263
Figure 1). In the case of Ditches 3, 4 and 5, however, there is a large theoretical rise in catchment
264
areas for overland flow weirs. For Ditches 10, 11 and 12 the overall catchment areas for both
265
overland flow and ditch flow weirs are substantially reduced in scenario 2 largely due to downslope
266
flow towards the west away from the weirs. The overall area of the monitored hillslope that
267
capturesbothoverland flow and subsurface flow (i.e., the ditch weirs) is 24 % smaller in the infilled
268
scenario. Hence, if ditch blocking was fully effective we would expect to capture less total flow
269
because ~24 % of the water should be diverted away from blocked ditches to follow the topographic
270
gradient of the site in a direction that partly by-passes the weirs. The catchment area supplying
271
overland flow weirs in scenario 2 is about three times greater than that for scenario 1 (Table 1).
272
273
Importantly, Figure 1 and Table 1 highlights that Ditches 6 and 7, which were open ditches, appear
274
to act as effective controls because their theoretical catchment areas are hardly affected under the
275
maximum infilling scenario for the surrounding ditches. In this paper, calculations to compare
276
blocked ditch flow and associated overland flow and water-tables to the open control treatments are
277
typically made with reference to Catchment 6. If the particular dataset being analysed from
278
Catchment 6 had any major problems (such as missing data due to data logger malfunction) then
279
comparisons were made to the matching dataset from Catchment 7.
281
When data have been evaluated on an annual basis, the data are treated in full years from 1stMarch
282
(2011/12, 2012/13, 2013/14, 2014/15) because ditch blocking took place in February 2011. Data
283
from before March 2011 are included, where relevant and available, and tend to run for the 6
284
months from August 2010 to January 2011 inclusive, covering both summer and winter periods.
285
286
For some of the dipwell and ditch flow data, calculations were performed to determine relative
287
impacts of ditch blocking compared to control ditches usingbothbefore and after blocking datasets
288
(hereafter referred to as the BACI approach). The BACI approach helps deal with problems around
289
differences in water-table depth between treatments resulting solely from wetter or drier weather
290
conditions experienced in a given year. For example, for each particular dipwell location (e.g., 2 m
291
west of the ditch) the mean difference between water-table depth was determined relative to the
292
control at open Ditch 6 ((control water-table depth) minus (study ditch water-table depth)). This
293
mean ‘offset’ was calculated for the period before ditch blocking. The calculation was repeated for
294
each of four study year periods (see above). The former offset value was subtracted from the latter
295
offset values. If the resulting annual number was >0 this suggested a relatively ‘positive’ change in
296
the treatment water-table depth compared to the control (i.e., the water tables had become shallower
297
(closer to the surface) relative to the control).
298
299
For some water-table comparisons we calculated time-weighted means to account for variations in
300
the intervals between water-table measurements, thus removing biases that may be caused by a
301
higher frequency of readings at one time of year compared to another. The measured water-table
302
depth for a dipwell was assigned to represent a proportion of the year calculated as half the number
303
of days between the previous reading and the current reading plus half the number of days between
304
the current reading and the next reading. The water-table depth was multiplied by that proportion of
305
the year and this value was then summed across the year to provide a time-weighted annual mean
306
water-table depth.
307
308
3. Results
309
3.1 Ditch flow
310
For ditches that were dammed or reprofiled in February 2011 there was, as expected, an immediate
311
effect on the discharge regime (Figure 2), with flow considerably reduced. Ditch 3 appears, from
312
Figure 2, to be an exception but 30 % of the datalogger record for Ditch 3 was lost during the
313
August 2010 to January 2011 (inclusive) pre-blocking phase. As a consequence many of the higher
314
peaks in flow for the earlier part of the record that were observed in other ditches are missing from
the Ditch 3 record. Ditches that were left open (2, 6, 7, and 9) show larger peak flows compared to
316
the other ditches for the period from March 2011. There were very large differences in total flows
317
between ditches, with the largest total flows after February 2011 occurring in the open ditches (2, 6,
318
7, and 9) (Table S1). The logger for Ditch 2 suffered regular failures and was out of action for a
319
large proportion of the time and so we treated those records with more caution. Runoff efficiency
320
(areal discharge expressed as a percentage of precipitation) for the study area as a whole was 82 %
321
before ditch blocking. However, during this first period of the study two ditches (4 and 9) appeared
322
to produce more areal discharge than rainfall (Figure 3). During later periods of the study several
323
ditches appeared to produce more areal discharge than rainfall under both catchment area scenarios
324
(Figure 3). When using scenario 1 catchment areas for the period after ditch blocking, the runoff
325
efficiencies for the whole site were 32 % (2011/12), 56 % (2012/13), 89 % (2013/14) and 71 %
326
(2014/15). For the scenario 2 catchment areas, the runoff efficiencies for the whole site were 122%
327
(before), 47 % (2011/12), 83% (2012/13), 132 % (2013/14) and 106 % (2014/15) (Table S1).
328
329
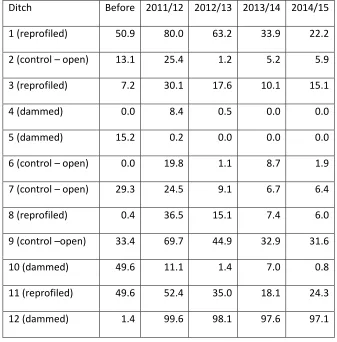
The proportion of time when flow was occurring in the ditches varied markedly between ditches,
330
with Ditches 1, 9, 11 and 12 having the longest dry periods (Table 2). The proportion of time flow
331
occurred increased for each full year of the study from 2011/12 to 2013/14 in all ditches except the
332
open ones and Ditch 10 (Table 2). Further increases in flow time (i.e. with the greatest values since
333
the ditch blocking took place) were found for Ditches 1, 8, 10 and 12 for the final year of the study,
334
although flow periods were longer in 2014/15 for control ditches 7 and 9 compared to the other
335
years since ditch blocking took place. Overall, flows were more continuous from ditches in later
336
years of the study. There appeared to be a large increase in flow periods at the Ditch 10 (dammed)
337
weir after ditch blocking compared to the period before blocking suggesting that pooled water
338
(water in pools behind dams) upslope was able to slowly seep out of this drain system for long
339
periods after rainfall. This hydrological behaviour is confirmed by less steep flow duration curves
340
for Ditch 10 in the years after ditch blocking (Figure 4).
341
342
At the high flow end of the flow duration curves (Figure 4) in particular, but for most of the dataset,
343
open control Ditches 6 and 7 have very similar curves between each year. The curves only deviate
344
between years for Ditch 6 during low flow conditions. The open Ditches 2 and 9 have
similarly-345
shaped curves across the years. The other ditches, however, show large differences in the slopes of
346
the curves between years, with more separation at the high end of the curves between years and in
347
particular between the pre- (black symbols) and post-blocking periods. The very gentle gradient
348
curves for Ditch 5 (dammed) after blocking indicate a change to more continuous flow all year as
349
also outlined in Table 2 with a less ‘flashy’ regime year on year as indicted by the progressively less
steep curves for each year in the record (Figure 4). The weir at Ditch 5 may also have a very large
351
increase in catchment area (and consequent discharge totals) associated with spillage of water from
352
other blocked drains (Table 1).
353
354
The total flow passing the ditch weirs declined from 14.96 m3per mm of rainfall to only 5.80 m3
355
per mm in the first year after blocking compared to the period before blocking. When only ditches
356
that were blocked are considered that figure was 9.39 m3mm-1dropping to 2.30 m3mm-1.
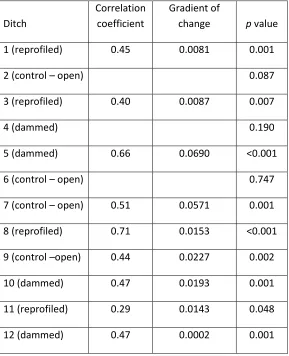
357
Considering only the period after ditch blocking, most of the ditches experienced a significant
358
increase (p< 0.05) over time (using month since blocking as the sequential time unit in a linear
359
regression) in the volume of water produced per mm of rainfall (Table 3). At control Ditch 6 there
360
was no significant increase in runoff volume per mm of rainfall over the same period. Open Ditch 9
361
did show a significant trend of increasing discharge per unit of rainfall but this is in line with
362
expectations that water from adjacent blocked ditches would flow into that ditch which may have
363
experienced an increase in catchment area of ~20 % after ditch blocking operations compared to the
364
situation before February 2011.
365
366
3.2 Overland flow
367
Overland flow regularly occurred on the site (Table 4) and all weir boxes recorded overland flow
368
showing that it was spatially widespread. Most weir boxes recorded flow for extended periods after
369
rainfall, suggesting that saturation-excess overland flow was the dominant surface flow mechanism.
370
Unfortunately overland flow data are unavailable for weir box 6 from July 2014 onwards due to
371
logger failure so we therefore used weir box 7 as a comparative control. For the eight blocked or
372
reprofiled ditches there were three full years of overland flow data. When each of these 24 possible
373
ditch-years was compared to control weir box 7 it was found that 19 had more frequent overland
374
flow than recorded at weir box 7 (Table 4). Overland flow occurred less frequently at weir box 12
375
in all study years compared to control weir box 7. Weir box 12 is the only one which theoretically
376
would have a reduced catchment area due to drain infilling and this weir box did experience much
377
less frequent overland flow than any other site. The duration of overland flow increased each year
378
relative to control weir box 7 for weir boxes 1-5 (Table 4).
379
380
The volume of overland flow almost tripled between the first year after blocking and the final year
381
of the study despite similar rainfall totals (Table S2). The large values of overland flow in
382
catchments 6 and 7 combined suggest that even where the ditches are open, overland flow (and
383
shallow throughflow to ~4 cm depth) may be the dominant flow path for water at the study site.
384
Note that the catchment areas for the ditch weirs and the overland flow weir boxes are different and
so it is not possible to simply partition the total ditch flow recorded in a ditch weir into overland
386
flow and subsurface flow based on the overland flow recorded at the overland flow weir box.
387
388
The relationship between overland flow and ditch flow was fairly stable during the study period for
389
control catchments 6 and 7 (Figure 5; only data for Ditch 7 are shown - patterns were similar at
390
Ditch 6) suggesting that the relative importance of overland flow and subsurface flow remained
391
stable in these control ditches. The relationship was also stable for most other ditches suggesting
392
that the balance of overland flow and lateral subsurface flow partitioning did not change in the years
393
after blocking. However, for Ditch 4 there was a tendency towards higher overland flow rates in
394
2014/15 compared to earlier years for comparable ditch flows. The opposite was the case for Ditch
395
8 (reprofiled). For Ditch 5 (dammed) the relationship between overland flow and ditch flow was
396
similar between years but there was a tendency for higher rates of both in 2013/14 and 2014/15
397
(note data only available to May 2014), compared with 2012/13 (Figure 5).
398
399
3.3 Water tables
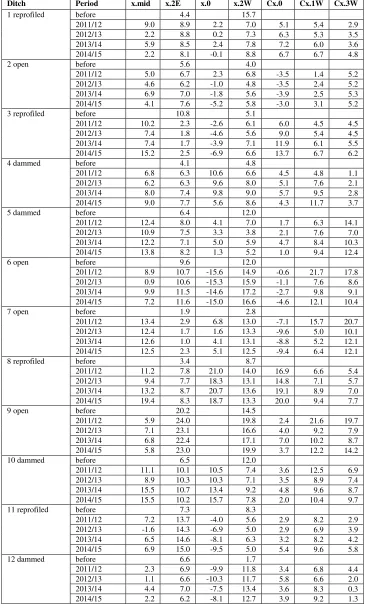
400
Water tables at the study site tended to be very shallow (Table S3). Some of the dipwells located
401
within ditches (x.0 and Cx.0) were clearly located where ponding above the surface was common
402
while others were not, including for dipwells in the same ditch, highlighting the spatially variable
403
nature of water level conditions on the floor of both blocked and unblocked drains (Table S3). At a
404
distance of only 2 m from open ditches, before blocking occurred, the mean time weighted
water-405
table depth for each dipwell ranged from 1.7 cm to 20.2 cm. Of the 24 dipwells located 2 m from
406
ditch edges, eight had mean time weighted water-table depths within 5 cm of the surface for the 6
407
month period before ditch blocking.
408
409
Using time-weighted annual means for each dipwell, a repeated measures one-way analysis of
410
variance (ANOVA) was used to test for treatment and time (year) effects for the 2 m dipwells (east
411
and west combined,n=8 per year per treatment). This indicated no significant effect of drainage
412
treatment (open, dammed, reprofiled) (p= 0.197), but a significant effect of year on water-table
413
depths (p< 0.001), with 2013/14 having significantly deeper water tables (byc. 1.3 cm) than
414
2012/13. The dipwells to the west of the ditches are where effects of treatment are likely to be
415
greatest due to the site’s gradient. However, a repeated measures one-way ANOVA for these
416
dipwells alone (n= 4 per year per treatment) indicated no significant effect of drainage treatment,
417
but a significant effect of year on water-table depths, with 2013/14 having significantly deeper
418
water tables (byc. 1.7 cm) than 2012/13. A separate repeated-measures ANOVA was used to
419
compare the Cx.1 and Cx.3 dipwells and there was no significant effect of treatment (p= 0.067)
from open (average depth: 10.0 cm), dammed (7.2 cm) or reprofiled (5.9 cm) ditches. The results
421
also showed that there was a significant effect of the year after blocking (p= 0.001), with 2011/12
422
(9.2 cm) > 2014/15 (8.3 cm) > 2013/14 (7.1 cm) > 2012/13 (6.1 cm). There was no effect of
423
distance from the ditch or an interaction effect between year after blocking, treatment and distance.
424
However, the above strict ANOVA analysis masks some of the spatial variability across the site.
425
Using time weighted means, 11 of the 16 dipwells either side of dammed or reprofiled ditches
426
indicated shallower water tables after blocking of ditches compared with the relative conditions 2 m
427
either side of control Ditch 6. Using the BACI approach, at some locations the apparent mean net
428
water-table rewetting effect was around 10 cm (e.g., 1.2W (reprofiled), 3.2E (reprofiled), 5.2W
429
(dammed), 10.2W (dammed)). However, the average time-weighted relative rewetting effect
430
(compared to the period before site interventions) across all of the 2 m dipwells when comparing all
431
blocked and reprofiled ditches with control Ditch 6 was only 0.4 cm, 1.4 cm, 1.8 cm and 1.5 cm in
432
the four study periods (2011/12, 2012/13, 2013/14, 2014/15) after blocking respectively.
433
434
By taking an annual mean approach the above BACI and ANOVA analyses remove some of the
435
temporal variability which may be important on site. Therefore as a further check ordinary least
436
squares regression was performed on the 2 m water-table records using day since blocking as a
437
predictor. Five dipwells out of 24 tested showed a trend towards a wetter condition (Figure S1, S2)
438
(reprofiled: 1.2W, 3.2E, 11.2W; control: 7.2E; dammed: 5.2W and 10.2W). However, these trends
439
were weak withr2< 0.1 in all but one case (3.2E). Thus the three analytical techniques for dealing
440
with the water-table data adjacent to ditches described above suggest that ditch blocking has had a
441
limited impact on water tables except in a few locations.
442
443
Examination of dipwell transects relative to a local datum (separate datum for each dipwell transect)
444
showed that in all cases water-table heights above datum, for mid-points between ditches, were
445
much greater than those around the ditches (two examples shown in Figure 6). Such an effect is
446
most likely due to the peat surface being typically higher at the mid-points than adjacent to or
447
within each ditch (e.g., the median peat surface height difference was 28 cm between mid-point
448
dipwells and the dipwells 2 m east of the ditch). The absolute water-table height for the 2 m
449
dipwells east and west of each ditch were very similar except for around Ditch 9 – open.
450
451
For the automated dipwells located midway between ditches the records showed a relatively small
452
range in means between dipwells for any given year (e.g., for 2011/12 4.0 cm (Ditch 2) to 12.7 cm
453
(Ditch 7)). Dipwell 7 was used as a control as it was midway between two open ditches (control
454
ditches 6 and 7). During the second half of the study period there was a relative deepening of
tables at the mid-point between ditches towards that found at the control (7.mid) for dipwells 4.mid,
456
5.mid, 10.mid, 11.mid, and 12.mid (all dammed or reprofiled) (Figure 7).
457
458
4. Discussion
459
4.1 Catchment area assessment
460
The 82 % runoff efficiency for the 2 ha hillslope before ditch blocking took place is in line with
461
previous water budgets for headwater blanket peatlands (Evanset al., 1999; Holden, 2006; Holden
462
et al., 2012), and almost identical to the 81% runoff efficiency measured during more than 30 years
463
of water balance monitoring at the Plynlimon (Pumlumon) moorland research catchment in
mid-464
Wales (Marc and Robinson, 2007). For the period before ditch blocking we can be most confident
465
about the cumulative surface catchment area for the twelve ditch weirs. However, even during this
466
first period of the study there are two ditches (4 and 9) that produced far more areal discharge than
467
rainfall. Such data provide clear evidence that the water (and carbon) source areas for these ditches
468
are different from those defined by the surface topography alone. It may be that subsurface springs,
469
pipes and other throughflow pathways result in source areas for those ditches which stretch beyond
470
the topographically-defined catchment; water chemistry data (not shown - see Evanset al., 2016)
471
show unusually high pH and inorganic carbon concentrations in Ditch 4, suggesting groundwater
472
influence. Hence, at scales of around 1000 to 3000 m2which are typical surface catchment areas for
473
the outlets of first order ditches, caution must be taken when calculating water budgets and it may
474
be necessary to reconsider the findings from earlier studies that have looked at areal flow rates and
475
aquatic carbon fluxes at such scales, including those from ditch and ditch-blocking studies.
476
Fortunately, at a one order of magnitude greater scale (20000 m2), such effects appear to become
477
less important. However, it is still possible that subsurface sources for the monitored part of the
478
hillslope occur outside this cumulative topographic area, but logically such effects should decrease
479
as catchment area increases.
480
481
4.2 Flow regimes and lag effects
482
There is strong evidence, at the study site, of both a step change in flow as a result of ditch blocking
483
and a gradual change over time after ditch blocking. The ditch blocking had the expected immediate
484
effect on ditch flows with a ~ five-fold reduction in flow down the ditches that were blocked. This
485
should not be interpreted as an overall reduction in water loss from the site: in upland UK
486
catchments with high rainfall and low mean temperatures, there is very limited capacity for even
487
quite drastic changes in land use, such as afforestation of grassland, to change runoff efficiencies by
488
more than a few percent (Marc and Robinson, 2007). Thus water leaving the hillslope must have
been transported away from the ditch gauging points, following the pre-drainage topography, or
490
been transported down the hillslope as inter-ditch flow.
491
492
After ditch blocking there was a gradual overall increase in ditch discharge from the site so that for
493
each unit of rainfall the site exported a greater volume of water via the ditch network. Such a
494
change was related to an increase in baseflow from the ditches, with more prolonged flow periods
495
(shorter dry periods) and more gently sloping flow duration curves. The gradual changes over time
496
that were observed indicate a lagged hydrological response to ditch-blocking. Such lagged
497
responses have been shown for water-table records before (slow recovery in water-table depths and
498
slow reduction in water-table variability (Wilsonet al., 2010; Holdenet al., 2011)) but never for
499
water flows in a blanket peatland channel system.
500
501
It is not clear why the ditch flows should increase over time in the years after ditch blocking,
502
compared to the year immediately after blocking, but it is possible that the enhanced baseflow was
503
related to increased lateral subsurface flow on site caused by slightly shallower mean water-table
504
depths at some locations across the site. However, it may also be that leaks slowly developed in the
505
dam network. The re-packed peat that formed the dams may not be stable and could be prone to
506
piping and cracking caused by subsidence or the high seepage force associated with the large
507
hydraulic gradient between the upper and lower part of the dam. It may also be that adjustments to
508
surface and subsurface flowpaths occurred such as new routes for water to bypass dams and flow
509
back into ditches around vegetation on the peat surface, or changes in subsurface pipe connectivity
510
associated with ponding in ditches. These possible processes require further research and in most
511
cases (e.g. studies of piping, pipeflow and macropore flow) would require new studies to investigate
512
how these peat physical properties and rates of flow through different pore structures change after
513
ditch blocking. As vegetation re-establishes within the system of pools and dams it is possible that
514
some of the breaches in the system could gradually become blocked, reversing this initial response;
515
however, we did not observe this in the four years post blocking.
516
517
When using areal discharge based on the original topographically-derived catchment areas for each
518
ditch, the total discharge efficiency was found to be greater than 100% for several drains. Thus their
519
real catchment areas must have increased over time due to the ditch blocking activity and to spillage
520
of water from one ditch to another. However, the whole system had not shifted to behave as if the
521
blocked drains had completely infilled because, when the cumulative catchment area for the weirs
522
was used in the infilling scenario for the overall study site, runoff efficiency was > 100%. The
523
figure is so high because the catchment area in the infilling scenario is much smaller than for the
open ditch scenario. The system therefore appeared to be operating in the latter part of the study, in
525
terms of catchment source areas, somewhere in between that of scenario 1 and scenario 2.
526
527
Overland flow was only monitored for the period after blocking. There were very long periods of
528
saturation-excess overland flow production on the site, particularly around blocked drains. Overland
529
flow continued to occur on the slopes near all blocked drains for more than 50 % of the time after
530
blocking. It is possible that changes may have happened below the soffit boards over time that
531
caused more overland flow to be produced in later years such as pore clogging due to disturbance
532
and accumulation of debris around the boards. However, we saw little evidence of surface debris
533
build up and so it is unlikely that deep subsurface pore blocking due to debris accumulation
534
occurred. The relationship between overland flow and ditch flow was stable from year to year for
535
the open control ditches. However for some (but not all) of the blocked ditches the relationship
536
shifted from year to year suggesting that long-term changes to the hydrological system as a result of
537
ditch blocking were spatially variable, with lagged effects in some areas and for some processes.
538
539
Evidence from some of the water-table records also suggests lag effects such as water-tables
540
becoming deeper at the mid-point between ditches in comparison to the mid-point control in the
541
latter part of the record. This may either be a recovery effect from site disturbance operations and
542
machinery, or it may be further evidence to suggest that the site became ‘leaky’ and that initial
543
successful rewetting of inter-ditch areas was reduced as ditch dams (and the ditch-flow weirs)
544
started to release more water in the latter half of the study. Haapalehtoet al. (2014) found, in a
545
regional survey in Finland, that even after restoration, water tables tended to be to be deeper in old
546
ditch lines, indicating the leakiness of filled ditches. The ‘leaky’ site hypotheses is more likely for
547
our site given the strength of evidence from our ditch discharge data, but further research is required
548
to understand what effects restoration machinery may have on long-term ecohydrological
549
functioning of peatlands.
550
551
4.3 Water-table change
552
Overall, water-table depths on site were relatively shallow, similar to what one would expect to see
553
on an intact and fully functioning blanket bog (Gilman, 1994; Evanset al., 1999; Lindsay, 2010).
554
On first inspection these data suggest that ditch drainage was not very effective at the site. This is
555
potentially due to high rainfall at the site, low hydraulic conductivity of the peat and the fact that
556
ditches were orientated in an almost downslope direction. Ditch blocking and reprofiling had no
557
significant overall effect on water-table depths relative to the peat surface when taking a strict
statistical approach for treatments as a whole. This is unlike findings for fens and raised bog
559
peatlands on more gently sloping terrain (e.g. Menberuet al., 2016).
560
561
We found evidence of an important topographic effect whereby the peat surface at mid-points
562
between ditches was at a higher elevation than the peat adjacent to ditches. Absolute water-table
563
elevations were therefore also higher in mid-point regions compared to the locations 1-3 m from the
564
ditches. This peat surface elevation difference is likely to be due to long-term subsidence of the peat
565
near to the ditches. Such subsidence effects around peatland drains have been observed in many
566
types of peatland over the past few decades including raised bogs (e.g. Haapalehtoet al., 2014),
567
fens (e.g. Leifeldet al., 2011) and tropical peat swamps (e.g. Wöstenaet al., 1997). However, these
568
effects have not, until now, been reported on steeply sloping blanket peatlands.
569
570
Long-term consolidation or wastage of the peat near to ditches at our study site may have taken
571
place thereby reducing pore space and, through a negative feedback, generated shallow water tables
572
near to ditches. Such an effect may have caused steepened hydraulic gradients on site in the years
573
after ditch creation thereby potentially forcing more surface and subsurface flow into the ditches
574
(depending on the hydraulic conductivity – which was not measured on site). These topographic
575
effects may not be reversed in the short-term (decades) after ditch blocking as peat growth rates
576
tend to be very slow, although where ditches are reprofiled or ponded with water behind dams there
577
may be a reduced hydraulic gradient from mid-way between ditches towards the ditch channel.
578
Such effects could be localised around individual pools and therefore water-table effects of
579
restoration on sloping blanket bogs, particularly where drains run predominately downslope, may be
580
very localised. The legacy of such spatially-structured topographic responses to drainage may have
581
implications for carbon fluxes. As there were only modest effects on water-table regime, some ditch
582
blocking may have little impact on key parts of the peatland carbon cycle including decomposition,
583
except for local effects focussed on pools formed behind dams. Due to sideways shedding of water
584
into the ditches, downslope inter-ditch areas may still be deprived of water even after damming of
585
ditches, particularly if there has been near-ditch subsidence. In some places, however, as would be
586
expected, blocked ditch water levels were higher in absolute terms than in the surrounding peat and
587
so water would tend to flow from the ditch into the peat at those points. Our data suggest that water
588
may be drawn into the ditch from the peat at some points and then from the ditch back into the peat
589
at other points along the ditch course.
590
5. Conclusions
592
The hydrological analysis at the study site has shown that the site is a typical flashy blanket
593
peatland system, dominated by overland flow, but with evidence of subsurface flow connectivity
594
that extends beyond the topographic boundaries of small ditch catchments. There was extremely
595
high variability in flow rates between ditches which had similar surface catchment areas. Hence
596
caution is needed when upscaling from studies that may have only collected evidence on
597
hydrological flows and aquatic carbon fluxes from one or two ditches (or blocked ditches) (e.g.
598
Gibsonet al., 2009; e.g. Armstronget al., 2010). At small individual ditch catchment scales, care
599
must also be taken when calculating water and carbon budgets based on surface topographic area.
600
The evidence suggests that it may be necessary to reconsider the findings from earlier studies that
601
have looked at areal discharge and aquatic carbon fluxes at such scales, including those from ditch
602
and ditch-blocking studies. We also recommend that aquatic flux measurements at small scales
603
should always be reported alongside water balance data to give confidence in the extrapolation.
604
605
While ditch blocking had an immediate effect on ditch flows, the analysis shows that there has also
606
been long-term change in the hydrology of the system in the years following ditch blocking. There
607
was some evidence (ditch, overland flow and water-table data) to suggest that the system has
608
become more ‘leaky’ since the initial restoration works were carried out with a greater volume of
609
water per mm of rainfall flowing down the ditch or former ditch channels (but in the form of slow
610
seepage and baseflow, rather than high flow peaks). It is not clear why this has occurred and several
611
lines of investigation should be explored including the possibility that the dams are leaking at an
612
increasing rate, that new flow routes have formed allowing water to enter back into ditches that was
613
previously distributed away from ditches, and that subsurface connectivity of bypassing flow (e.g.,
614
pipeflow) may be important on site. Our analysis has shown the need for long-term monitoring
615
studies to test whether findings in the initial post-restoration phase still apply several years later and
616
also as part of testing the robustness of management intervention measures in later years after ditch
617
blocking. It may be that, because the predominant orientation of the ditches in our study was
618
downslope, leakiness changes over time were more likely than at sites where ditches run in a more
619
cross-slope direction.
620
621
The surface topography at the site suggested that subsidence of the peat had occurred close to the
622
drains. While this has been commonly reported for peatlands, it has not, until now, been reported
623
for steeply sloping blanket peatlands. More research is required to determine whether this
624
subsidence effect is widespread across sloping blanket peatlands, but if it is then it makes
water-625
table restoration even more challenging for blanket peatlands, particularly for cases where drains
are orientated predominantly downslope. There was relatively little impact of ditch blocking or
627
reprofiling on site water tables. Practitioners seeking to raise water tables more widely across
628
blanket peatland sites should be informed either by prior measurement of water tables or by
629
topographic modelling to highlight where surface flows might be redirected after management
630
interventions on site. This information may help prioritise resource use by showing whether the
631
peatland already has shallow water tables or whether there are locations which could potentially
632
undergo larger water-table recoveries through ditch blocking than were observed at our study site.
633
634
635
Acknowledgements
636
The research was funded by Defra (Project SP1202). We thank the National Trust, and in particular
637
Trystan Edwards for land access and providing LiDAR data, and Natural Resources Wales for
638
granting permission for the study to take place. We thank Dr Richard Smart, Dr Nathan Callaghan
639
and the National Trust for field assistance, and David Cooper from CEH Bangor for statistical
640
advice at the onset of the project. We thank two anonymous reviewers for their comments which
641
helped improve the manuscript.
642
643
Table I.Surface topographically-derived catchment areas (m2) of the study weirs for two scenarios.
645
Ditch Ditch flow Overland flow
Scenario 1: Assuming all open ditches
Scenario 2: Assuming
treatment ditches act as if they are infilled
Scenario 1: Assuming all open ditches
Scenario 2: Assuming treatment ditches act as if they are infilled
1 2942 2499 100 69
2 1950 2537 229 322
3 2426 105 291 777
4 1350 19 61 527
5 969 38 43 1639
6 1462 1494 79 117
7 1227 1340 45 54
8 1195 823 280 50
9 1642 1997 55 25
10 2142 1329 161 103
11 1541 4 63 713
12 1311 40 108 37
Total 20157 12225 1515 4433
646
647
648
649
651
Table II.Proportion of time (%) when flows < 0.1 mL s-1occurred at the ditch weir.
652
Ditch Before 2011/12 2012/13 2013/14 2014/15
1 (reprofiled) 50.9 80.0 63.2 33.9 22.2
2 (control – open) 13.1 25.4 1.2 5.2 5.9
3 (reprofiled) 7.2 30.1 17.6 10.1 15.1
4 (dammed) 0.0 8.4 0.5 0.0 0.0
5 (dammed) 15.2 0.2 0.0 0.0 0.0
6 (control – open) 0.0 19.8 1.1 8.7 1.9
7 (control – open) 29.3 24.5 9.1 6.7 6.4
8 (reprofiled) 0.4 36.5 15.1 7.4 6.0
9 (control –open) 33.4 69.7 44.9 32.9 31.6
10 (dammed) 49.6 11.1 1.4 7.0 0.8
11 (reprofiled) 49.6 52.4 35.0 18.1 24.3
12 (dammed) 1.4 99.6 98.1 97.6 97.1
653
654
Table III.Correlation coefficients and the gradient of change over time since March 2011 in monthly
656
discharge per unit rainfall (m3mm-1). Coefficient and gradient values only shown wherep< 0.05.
657
Ditch
Correlation coefficient
Gradient of
change pvalue
1 (reprofiled) 0.45 0.0081 0.001
2 (control – open) 0.087
3 (reprofiled) 0.40 0.0087 0.007
4 (dammed) 0.190
5 (dammed) 0.66 0.0690 <0.001
6 (control – open) 0.747
7 (control – open) 0.51 0.0571 0.001
8 (reprofiled) 0.71 0.0153 <0.001
9 (control –open) 0.44 0.0227 0.002
10 (dammed) 0.47 0.0193 0.001
11 (reprofiled) 0.29 0.0143 0.048
12 (dammed) 0.47 0.0002 0.001
658
Table IV.Proportion of time overland flow (OLF) was recorded at the weir boxes (flow ≥ 0.1 mL s
-660
1) and the difference in proportion of time OLF occurred compared to weir box 7.
661
662
Ditch % time OLF recorded % difference to control weir box 7
2012/13 2013/14 2014/15 2012/13 2013/14 2014/15
1 (reprofiled) 66 77 79 4 23 23
2 (control – open) 80 78 83 18 24 27
3 (reprofiled) 40 51 61 -22 -3 5
4 (dammed) 44 71 86 -18 17 30
5 (dammed) 69 94 100* 7 40 44
6 (control – open) 72 56 56* 10 2 0
7 (control – open) 62 54 56
8 (reprofiled) 73 53 72 11 -1 16
9 (control –open) 72 30 32 10 -24 -24
10 (dammed) 98 63 61 36 9 5
11 (reprofiled) 76 63 48 14 9 -8
12 (control – open) 24 25 9* -38 -29 -47
*Data available for weir box 5 until May 2014 only, weir box 6 until July 2014 only and weir box 12 until 663