ISSN 1011-0844
ECU-EMS information
1 D 1989 Monthly
EXCHANGE RATES : two years of unchanged EMS central rates.
This month the European Monetary System entered its third year with fixed bilateral parities (central rates) between
the currencies participating in the system. This EMS stability should be examined against the background of a sharp
dollar fall in 1987, its subsequent appreciation but also its extremely erratic movements in 1988, as well as the
persistent US trade and budget deficits. Dominant economic events in this period were the serious stock market
crisis of October 1987, but also the higher growth rates of economic activity in the OECD area.
The main characteristics of the said two-year period of fixed EMS central rates, can be summarised as follows:
. almost all of the observed tensions in the EMS, had an origin external to the system, such as the fall of the dollar,
the stock market crash and a rise in the interest rates in the US.
. the financial character of the said external "shocks" probably facilitated their absorption by the Community
economies. On the other hand, the effects of a parallel, real (as opposed to financial) external shock, the fall of
oil prices since 1986, were clearly beneficial to all EMS countries.
. the variability of the exchange rates of the non-EMS participating currencies were, as expected, much higher
(five times, on average) than that of the EMS countries.
. less expected was the higher, average, variability of the short-term interest rates of the currencies which do not
participate in the exhange rate mechanism of the EMS, especially that of sterling (a freely floating exchange rate
was supposed to lessen the necessity of interest rate adjustments).
An important element for the functioning of the EMS in the years ahead, refers to the decision of the council of
ministers (June '88) concerning the free capital movements by June 1990. This new element marks a new phase
for the European Monetary System and the ECU, but underlines also their dynamic character, in the sense that they
constitute integral parts of the movement towards the Economic and Monetary Union.
The changes in the exchange rates of the non-EMS currencies vis-à-vis the ecu, during 1988 (December
',i
December '87) were as follows:
over
sterling appreciated by 6.6% and the drachma depreciated by 5.5%. Both currencies form part of the ecu but do not
participate in the exchange rate mechanism of the EMS. Regarding the currencies not yet participating in the ecu
basket, the peseta appreciated by 3.9% whereas the escudo depreciated by 2%.
Contents
I. A graph of the bilateral fluctuations of the EMS currencies.
II. Yearly and monthly issues of ecu bonds.
III. Interest rates on ecu deposits and yields on ecu bonds.
IV. Latest month's ecu bond issues.
V. Consumer price indices in national currencies.
VI. Consumer price indices in ecus.
eurostat
OFICINA ESTADÍSTICA DE LAS COMUNIDADES EUROPEAS
DE EUROPÆISKE FÆLLESSKABERS STATISTISKE KONTOR
STATISTISCHES AMT DER EUROPÄISCHEN GEMEINSCHAFTEN
ΣΤΑΤΙΣΤΙΚΗ ΥΠΗΡΕΣΙΑ ΤΩΝ
ΕΥΡΩΠΑΪΚΩΝ ΚΟΙΝΟΤΗΤΩΝ
STATISTICAL OFFICE OF THE EUROPEAN COMMUNITIES
OFFICE STATISTIQUE DES
COMMUNAUTÉS EUROPÉENNES
ISTITUTO STATISTICO DELLE COMUNITÀ EUROPEE
BUREAU VOOR DE STATISTIEK DER EUROPESE GEMEENSCHAPPEN
SERVIÇO DE ESTATÍSTICA DAS COMUNIDADES EUROPEIAS
L-2920 Luxembourg - Tél. 43011 - Télex: Comeur Lu 3 4 2 3
B-1049 Bruxelles, bâtiment Berlaymont, rue de la Loi 2 0 0 (bureau de liaison) Tél. 2351111
Note
For any information
tel.
4301-2022
4301-3519
4301-3288
4301-4770
on
D.
T.
G
S.
the statistics in
Glatzel
Papaspyrou
Thouvenm
Ansion
this bulletin
tl.·-: Λ '"'
contact Luxembourg:
© ECSC-EEC-EAEC, Brussels · Luxembourg, 1989
Reproduction is authorized, except for commercial purposes, provided the source is acknowledged.
TABLE I
BILATERAL
FLUCTUATIONS
OF THE EMS CURRENCIES
1.2 τ
I I I I I I I 1 I I I I I I I I I I I I I I I I I I I I I I I I I I I I I I I I I I
01 OS 07 09 11 15 17 21 23 25 29 01 05 07 09 13 15 19 21 23 28 30
November December
How
to read the graph
1
. The various curves should be compared in pairs. To find the differential between two currencies, subtract the
(positive or negative) values along the y-axis corresponding to each currency.
2. The graph is drawn with the curve of the strongest currency above that of the weakest. It shows therefore the relative
position of each currency vis-à-vis the other currencies.
3. When two curves intersect or merge over a period of time there is no differential between the two currencies and
their market exchange rate equals their bilateral central rate.
Construction of
the graph
1. The graph is drawn within a horizontal band corresponding to the maximum 2,25% margin of fluctuation applying
at any given moment to market exchange rates and the bilateral central rates of the EMS currencies, with the
exception of the LIT, which has a maximum authorized fluctuation of 6%. This band is divided symmetrically by
a horizontal axis along which the points would be plotted if all currencies were at their bilateral central rate and
there were therefore no fluctuations.
2. The daily market exchange rates of all currencies are compared with the relevant bilateral central rates and the
differentials between the two calculated.
3. The maximum fluctuation between two currencies (with the exception of the LIT) is shown within the band,
symmetrical with the horizontal axis. The fluctuations of the other currencies in relation to either of the two
currencies in question are shown within the maximum permissible fluctuation.
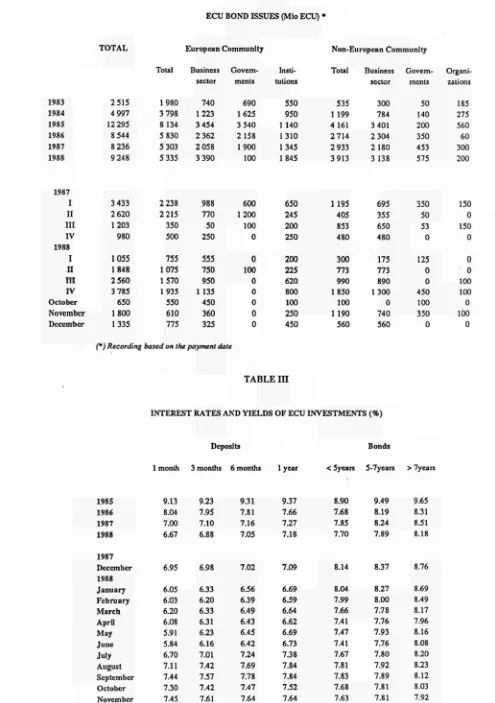
TABLE Π
ECU BOND ISSUES (Mio ECU) *
TOTAL European Community Non-European Community
1983 1984 198S 1986 1987 1988 1987 I II III IV 1988 I II III IV October November December 2515 4 997 12 295 8 544 8 236 9 248 3 433 2 620 1203 980 1055 1848 2 560 3 785 650 1800 1335 Tout 1980 3 798 8 134 5 830 5 303 5 335 2 238 2 215 350 500 755 1075 1570 1935 550 610 775 Business sector 740 1223 3 454 2 362 2 058 3 390 988 770 50 250 555 750 950 1 135 450 360 325 Govern ments 690 1625 3 540 2158 1900 100 600 1200 100 0 0 100 0 0 0 0 0 Insti tutions 550 950 1 140 1310 1345 1845 650 245 200 250 200 225 620 800 100 250 450 Total 535 1 199 4 161 2714 2 933 3913 1195 405 853 480 300 773 990 1850 100 1 190 560 Business sector 300 784 3 401 2 304 2180 3 138 695 355 650 480 175 773 890 1300 0 740 560 Govern ments 50 140 200 350 453 575 350 50 53 0 125 0 0 450 100 350 0 Organi zations 185 275 560 60 300 200 150 0 150 0 0 0 100 100 0 100 0
(*) Recording based on lhe payment dale
TABLE I B
INTEREST RATES AND YIELDS OF ECU INVESTMENTS (%)
TABLEIV
LAST MONTH ECU BONDS ISSUES
Issue 'ayment
Date
Borrower (country)
Issued Issue Coupon Term Maturity Yields
(Mio ECU) Price (years) %
Lead Listing Notice Manager
01/12/88 27/01/89
Eurofima 100 101.500 7 5/8 5 27/01/94 7.26 Credit Suisse LX Swap First Boston
01/12/88 04/01/89
Credit local de France
50 101.000 7 5/8 4 12/10/92 7.77 CCF LX Swap
02/12/88 20/12/88
12/12/88 17/01/89
Credita nstalt Bankverein (AUSTRIA)
SCA Capital Corporation BV
(SWEDEN)
60 10C.625 7 3/4 5 09/12/93 7.35
101 100.000 41/4 15 17/01/04
Mitsubishi Finance
Svenska Int.
LX Swap
LN Convert
TABLE V
CONSUMER PRICE INDICES IN NATIONAL CURRENCY
1985=100 B DK D ELL E F IRL I L NL Ρ UK
EUR 12 EMS 1970 34.9 26.8 50.4 10.3 13.5 25.3 15.6 14.2 37.0 40.0 6.4 19.6 25.4 29.8 1980 71.2 68.3 82.6 39.1 56.2 63.3 56.1 52.5 70.3 81.8 35.2 70.7 65.1 66.7 1982 83.3 84.0 92.5 58.9 73.7 80.2 79.1 72.1 83.1 92.2 51.8 85.9 80.8 82.1 1983 89.7 89.8 95.5 70.8 82.6 87.8 87.3 82.7 90.2 94.8 64.9 89.8 87.7 88.9 1984 95.4 95.5 97.9 83.8 91.9 94.5 94.8 91.6 96.1 97.8 83.6 94.3 94.2 94.9 1985 100.0 100.0 100.0 100.0 100.0 100.0 100.0 100.0 100.0 100.0 100.0 100.0 100.0 100.0 1986 101.3 103.6 99.8 123.0 108.8 102.5 103.8 105.8 100.3 100.3 111.8 103.5 103.6 102.7 1987 102.9 107.8 100.0 143.2 114.5 105.9 107.1 110.9 100.2 100.2 122.2 107.7 106.9 105.4 05 103.8 112.8 101.2 159.7 118.0 108.3 108.9 115.7 101.2 100.9 131.6 112.3 109.3 108.1 06 104.0 112.8 101.3 161.8 118.5 108.6 108.9 116.1 101.4 100.8 132.3 112.7 109.6 108.3 07 104.3 112.3 101.2 161.4 120.1 109.0 108.9 116.4 101.8 101.0 133.4 112.8 110.0 108.5 1988 08 104.6 113.0 101.3 161.8 121.2 109.3 109.8 116.8 102.0 101.3 135.3 114.1 110.5 108.8 09 104.7 113.7 101.3 166.6 122.4 109.6 109.8 117.4 102.1 101.6 136.7 114.6 110.9 109.1 10 104.7 113.9 101.4 170.7 122.5 109.8 109.8 118.3 102.3 101.7 138.0 115.8 111.5 109.5 11 104.6 114.7 101.7 171.9 122.5 109.9 110.5 119.3 102.6 101.8 140.1 116.3 111.8 109.9
Annual rate of increase (%)
It DK D ELL E Κ IRL I L NL Ρ UK
EUR 12 EMS 61-70 3.0 6.0 2.7 2.1 6.1 4.1 4.8 4.0 2.6 4.2 4.5 4.1 3.7 3.3
71-80 .
7.4 9.8 5.1 14.5 15.4 9.7 13.7 14.1 6.7 7.4 18.7 13.8 9.9 8.4 1982 8.7 10.1 5.3 20.9 14.4 11.8 17.2 16.5 9.3 5.7 22.7 8.6 10.8 10.4 1983 7.7 6.9 3.3 20.5 12.1 9.6 10.4 14.7 8.6 2.7 25.1 4.6 8.5 8.4 1984 6.3 6.3 2.4 18.3 11.2 7.3 8.6 10.8 6.5 3.2 28.9 5.0 7.4 6.7 1985 4.9 4.7 2.2 19.4 8.9 5.9 5.4 9.2 4.1 2.3 19.6 6.1 6.1 5.4 1986 1.3 3.6 -0.2 23.1 8.8 2.7 3.8 5.8 0.3 0.3 11.8 3.4 3.6 2.7 1987 1.6 4.0 0.3 16.1 5.3 3.0 3.1 4.8 -0.1 -0.2 9.4 4.2 3.2 2.7 05 1.0 4.6 1.1 12.5 3.9 2.5 1.9 5.0 1.2 0.8 8.3 4.2 2.8 2.8 06 1.1 4.6 1.1 11.8 4.3 2.6 1.9 4.9 1.5 0.9 9.2 4.6 3.0 2.8 07 1.0 4.1 1.0 13.2 4.6 2.7 1.9 5.1 2.0 1.1 9.7 4.8 3.2 2.9 1988 08 0.9 4.5 1.2 14.0 5.7 2.8 2.1 5.1 1.8 1.2 10.0 5.7 3.6 3.0 09 1.2 4.5 1.4 14.8 5.7 3.0 2.1 4.9 1.8 1.1 11.0 5.9 3.8 3.0 10 1.3 4.2 1.3 14.1 5.2 3.0 2.1 4.9 2.0 0.7 10.7 6.4 3.9 3.0 11 1.6 4.6 1.6 14.1 5.5 3.0 2.7 5.4 2.2 0.8 11.9 6.4 3.4 3.2
Average deviation around the mean
EUR 12 EMS 0.8 1.0 3.5 4.0 3.9 4.0 4.2 3.9 3.3 2.8 2.4 2.3 2.7 2.0 1.9 1.7 1.7 1.4 1.7 1.4 1.8 1.4 2.0 1.4 2.0 1.3 2.1 1.3 2.1 1.4
Average deviation vis-à-vis the minimum
TABLE VI
CONSUMER PRICE INDICES IN ECU
1985=100 Β DK D ELL E F IRL I L NL Ρ UK EUR 12 SME ECU 1970 30.9 28.0 30.0 35.2 24.5 30.1 16.4 32.2 32.5 27.1 28.3 27.0 29.4 30.3 30.2 1980 78.7 70.0 72.9 69.7 72.8 73.1 58.5 63.9 77.7 74.4 65.9 69.8 70.9 71.2 71.7 1982 83.8 82.6 86.7 94.4 88.4 84.8 81.5 78.8 83.5 88.6 86.9 90.1 85.5 84.3 85.8 1983 88.7 88.7 93.7 95.0 83.6 88.1 87.0 88.6 89.3 93.8 85.8 90.1 89.9 90.5 91.0 1984 94.3 94.1 97.3 99.4 93.7 93.5 93.3 96.0 95.0 97.2 93.9 93.9 95.2 95.6 95.6 1985 100.0 100.0 100.0 100.0 100.0 100.0 100.0 100.0 100.0 100.0 100.0 100.0 100.0 100.0 100.0 1986 103.9 104.8 104.3 93.8 102.1 102.5 101.5 104.8 102.9 104.9 98.9 90.9 101.3 103.9 102.0 1987 107.4 109.7 107.5 96.1 103.9 103.8 98.9 107.3 104.6 107.7 97.8 90.0 103.1 106.4 104.2 05 107.3 113.6 108.3 101.4 110.8 104.2 98.6 108.3 104.6 108.8 100.9 100.9 106.3 107.3 106.5 06 107.5 114.5 108.6 103.0 111.5 105.0 99.2 108.9 104.7 108.5 101.5 100.2 106.6 107.8 106.7 07 107.6 113.9 108.5 102.6 112.5 105.4 99.3 109.4 105.1 108.2 102.6 100.8 106.9 107.9 106.8 1988 08 107.6 113.9 108.4 102.5 114.4 105.1 99.1 109.8 104.9 108.3 103.9 103.7 107.5 107.9 107.2 09 108.2 114.6 108.8 104.9 114.5 105.3 100.2 109.8 105.4 109.1 104.2 102.7 107.7 108.3 107.5 10 108.2 114.3 108.9 106.5 115.5 105.3 100.0 110.9 105.7 109.3 104.9 104.3 108.2 108.5 107.8 11 108.1 115.0 109.2 106.0 115.9 105.5 101.6 112.0 106.1 108.9 105.9 104.5 108.6 108.8 108.1
Annual rate of increase (%)
Β DK D ELL E F IRL I L NL Ρ UK EUR 12 SME ECU 61-70 3.8 5.4 4.5 1.3 3.7 3.3 4.7 4.3 2.9 5.1 3.7 2.8 3.7 4.1 3.8 71-80 9.8 9.6 9.3 7.0 11.5 9.3 13.8 7.1 9.1 10.6 8.8 9.9 9.2 8.9 9.0 1982 0.6 7.0 11.3 14.0 9.4 5.4 18.3 11.1 1.0 12.1 8.3 7.0 8.9 8.9 8.6 1983 5.8 7.3 8.1 0.7 -5.4 3.9 6.7 12.5 6.9 5.9 -1.3 0.0 5.2 7.4 6.1 1984 6.3 6.1 3.9 4.6 12.1 6.1 7.3 8.3 6.4 3.7 9.5 4.2 5.8 5.6 5.0 1985 6.1 6.3 2.8 0.6 6.7 7.0 7.1 4.2 5.2 2.8 6.5 6.5 5.1 4.6 4.7 1986 3.9 4.8 4.3 -6.2 2.1 2.5 1.5 4.8 2.9 4.9 -1.1 -9.1 1.3 3.9 2.0 1987 3.4 4.8 3.1 2.4 1.8 1.3 -2.5 2.5 1.7 2.7 -1.1 -0.7 1.8 2.4 2.2 05 0.1 2.5 0.9 4.5 9.8 1.0 1.6 1.9 0.3 1.2 3.0 10.4 3.4 1.2 2.3 06 0.0 3.4 1.0 4.5 9.4 1.5 1.9 2.2 0.5 1.0 4.3 10.1 3.5 1.4 2.4 07 -0.1 3.8 0.9 6.4 8.3 1.4 1.8 2.5 0.9 0.9 5.4 10.7 3.6 1.4 2.4 1988 08 -0.4 4.3 0.7 7.2 8.3 1.0 1.4 2.5 0.5 0.6 5.6 13.6 3.9 1.3 2.6 09 0.3 4.9 1.5 8.3 6.4 1.1 2.5 1.7 0.9 0.9 6.3 11.7 3.7 1.5 2.7 10 0.8 4.0 1.4 7.5 4.9 0.9 2.1 1.9 1.4 0.5 6.3 12.4 3.6 1.4 2.8 11 0.9 4.1 1.1 7.9 7.2 1.9 2.5 3.9 1.4 0.4 8.6 12.2 4.2 2.0 3.0
TABLE VII
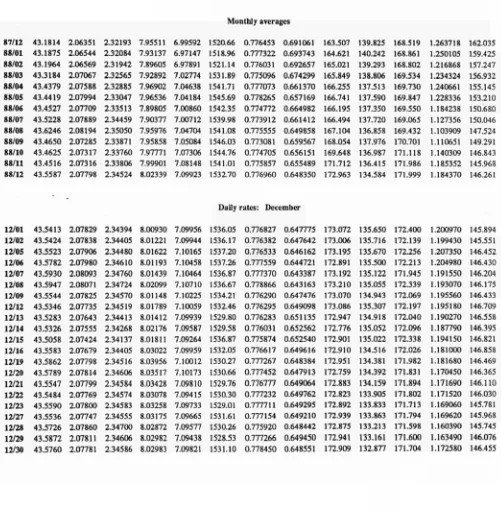
ECU EXCHANGE RATES
B/LFR DM HFL DKR FF LIT IRL UKL DRA PTA ESC USD YEN
EXPLANATORY NOTES
Ecu exchange rates.
The exchange rates for the ecu against the national currencies of the Member States of the Community, the United States (USD)
and Japan (YEN) are shown as monthly averages and daily rates for the latest available month.
The ecu basket, dating from 17 September 1984, is currently made up as follows:
DM FF HFL BFR LFR " LIT DKR IRL UKL* DRA*
lecu= 0,719+ 1,31+ 0,256+ 3,71+ 0,14+ 140+ 0,219+ 0,00871+0,0878+ 1,15
Ecu central rates since 12 January 1987
DM FF HFL B/LFR LIT DKR IRL UKL* DRA*
2,05853 6,90403 2,31943 42,4582 1483,58 7,85212 0,768411 0,739615 150,792
Weights of currencies in the ecu basket (based on new central rates from 12 January 1987), in %.
DM FF HFL B/LFR LIT DKR IRL UKL* DRA*
100= 34,93 18,97 11,04 9,07 9,44 2,79 1,13 11,87 0,76
* = Docs not participate in the exchange rate mechanism
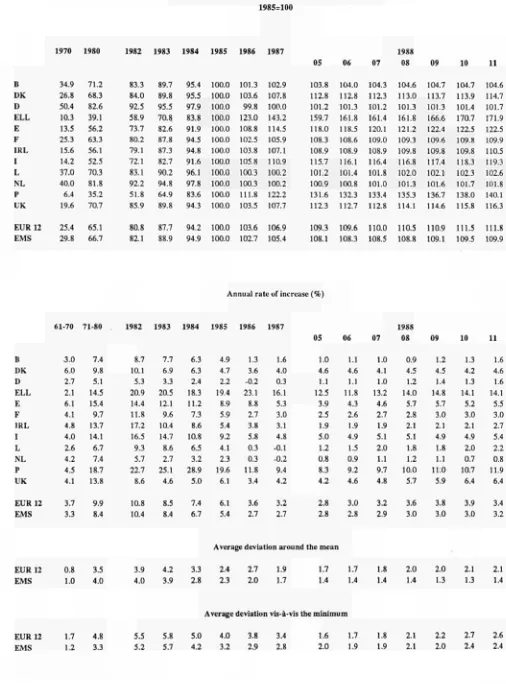
Consumer price indices in national currency
The consumer price indices in the national currency of each country measure changes in the purchasing power of one unit of
national currency spent in the country concerned.
Two composite indices are calculated, covering all the Member States of the Community (EUR 12) and the eight Member
States with currencies participating in the European Monetary System exchange rate mechanism (EMS).
These indices are calculated as weighted arithmetic means (chain indices) of the national indices, the weighting for each
Member State being its relative share in the final consumption of households of the group of countries in question (EUR 12,
EMS), expressed in purchasing power standards, at current prices and purchasing power parities.
At the foot of the table, the average weighted fluctuations around the mean and the minimum are given for the same groups
of countries, with the same weightings. (These are calculated as weighted averages of the absolute fluctuations in relation to
the mean and the minimum respectively). They show the degree to which price movements in the Member States in the
Community converge.
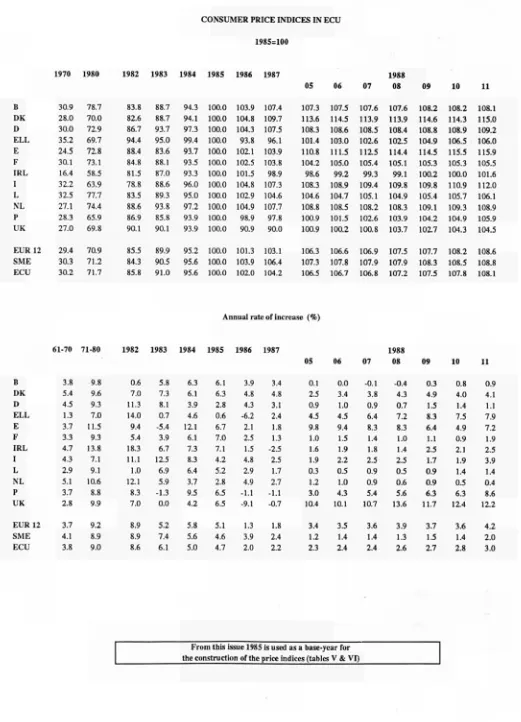
Consumer price indices in ecus
For each country the index of consumer prices in ecus is calculated by dividing the national consumer price index by the
average movement of the national currency in relation to the ecu during the month. It measures the change in the purchasing
power of one ecu in the country concerned.
Three composite indices are calculated, covering all the Member States of the Community (EUR 12), the eight Member States
participating in the European Monetary System exchange rate mechanism (EMS) and the ten Member States whose currencies
go to make up the ecu (ECU). These indices are calculated as weighted arithmetic means (chain indices) of the consumer price
indices expressed in ecus as mentioned above.
The weightings are defined as follows:
. for the EUR 12 and EMS indices, the relative share of each Member State in the final consumption of households for
the group of countries in question (EUR 12 or EMS), expressed in ecus at current prices and exchange rates (annual
weighting).
Ecu bond issues
[image:10.595.69.546.339.760.2]All
ecu-denominated bond issues, both national and international, are covered, together with ecu issues offering the option
of conversion into other currencies. Main source: International Financing Review
Table II shows, under the headings:
. Business sector and Governments: national issuers, both private and public.
. Institutions: the European Investment Bank and the Commission of the European Communities (EEC, ECSC,
Euratom).
. Organizations: the specialist institutions of the United Nations, the World Bank, the Council of Europe, etc
The issues arc recorded as at the payment date.
Interest rates and yields
on
ecu
investments
The interest rates for 1, 3 and 6 month and 1 year deposits arc calculated on the basis of the Friday London market rates
(source: Financial Times).
The bonds are classified according to three types of terms: under 5 years, from 5 to 7 years and more than 7 years. The
redemption yields of ecu bonds are calculated each Wednesday from a sample of fixed interest bonds, denominated in ecus
and listed on the Luxemburg Stock Exchange. These yields are weighted by amounts in circulation, (source: Luxembourg
Stock Exchange).
The monthly and yearly averages are the arithmetic means of these weekly interest rates and bond yields.
Venta y suscripciones · Salg og abonnement · Verkauf und* Abonnement · Πωλήσεις και συνδρομές
Sales and subscriptions · Vente et abonnements · Vendita e abbonamenti
Verkoop en abonnementen · Venda e assinaturas
BELGIQUE / BELGIË FRANCE PORTUGAL
Moniteur belge / Belgisch Staatsblad Rue de Louvain 40-42 / Leuvensestraat 40-42 1000 Bruxelles / 1000 Brussel
Tél. 512 00 26
CCP / Postrekening 000-2005502-27 Sous-dépôts / Agentschappen: Librairie européenne / Europese Boekhandel
Rue de la Loi 244 / Wetstraat 244 1040 Bruxelles / 1040 Brussel CREDOC
Rue de la Montagne 34 / Bergstraat 34 Bte 11 / Bus 11
1000 Bruxelles / 1000 Brussel
DANMARK
J . H. Schultz Information A/S EF-Publikationer
Ottiliavej 18 2500 Valby Tlf: 01 44 23 00 Telefax: 01 44 15 12 Girokonto 6 00 08 86
BR DEUTSCHLAND
Bundesanzeiger Verlag Breite Straße
Postfach 10 80 06 5000 Köln 1 Tel. (02 21)20 29-0 Fernschreiber:
ANZEIGER BONN 8 882 595 Telecopierer: 20 29 278
GREECE
G.C. Eleftheroudakis SA International Bookstore 4 Nikis Street
105 63 Athens Tel.: 322 22 55 Telex: 219410 ELEF Telefax: 3254 889
Sub-agent for Northern Greece: Molho's Bookstore
The Business Bookshop 10 Tsimiski Street Thessaloniki Tel. 275 271 Telex 412885 LIMO
ESPANA
Boletín Oficial del Estado Trafalgar 27
E-28010 Madrid Tel. (91) 446 60 00 Mundi-Prensa Libros, S.A. Castellò 37
E-28001 Madrid
Tel. (91) 431 33 99 (Libros) 431 32 22 (Suscripciones) 435 36 37 (Dirección) Télex 49370-MPLI-E
Telefax: (91) 275 39 98
Journal officiel
Service des publications des Communautés européennes 26. rue Desaix
75727 Paris Cedex 15 Tél. (1)40 58 75 00
IRELAND
Government Publications Sales Office Sun Alliance House
Molesworth Street Dublin 2
Tel. 7103 09 or by post
Government Stationery Office EEC Section
6th floor Bishop Street Dublin 8 Tel. 78 16 66
ITALIA
Licosa Spa Via Lamarmora. 45 Casella postale 552 50 121 Firenze
Tel. 57 97 51
Telex 570466 LICOSA I CCP 343 509
Subagenti:
Libreria scientifica Lucio de Biasio -AEIOU Via Meravigli, 16
20 123 Milano Tel. 80 76 79
Herder Editrice e Libreria Piazza Montecitorio, 117-120 00 186 Roma
Tel. 67 94 628/67 95 304
Libreria giuridica Via 12 Ottobre, 172/R
16 121 Genova Tel. 59 56 93
GRAND-DUCHÉ DE LUXEMBOURG ~ ~
Office des publications officielles des Communautés européennes 2, rue Mercier
L-2985 Luxembourg Tél. 49 92 81
Télex PUBOF LU 1324 b CCP 19190-81
CC bancaire BIL 8-109/6003/200 Messageries Paul Kraus 11, rue Christophe Plantin L-2339 Luxembourg Tél. 48 2131 Télex 2515 CCP 49242-63
NEDERLAND
SDU uitgeverij
Christoffel Plantijnstraat 2 Postbus 20014
2500 EA 's-Gravenhage
Tel. (070) 78 98 80 (bestellingen)
Imprensa Nacional Casa da Moeda. E.P.
Rua D. Francisco Manuel de Melo. 5 1092 Lisboa Codex
Tel. 69 34 14
Distribuidora Livros Bertrand Lda. Grupo Bertrand, SARL
Rua das Terras dos Vales. 4-A Apart. 37
2700 Amadora Codex Tel. 493 90 50 - 494 87 88 Telex 15798 BERDIS
UNITED KINGDOM
HMSO Books (PC 16) HMSO Publications Centre 51 Nine Elms Lane London SW8 5DR Tel. (01)211 77 02 Sub-agent:
Alan Armstrong £r Associates Ltd Arkwright Road
Reading, Berks RG2 OSO Tel. (0734) 75 17 69 Telex 849937 AAALTD G
TURKIYE
Dünya super veb ofset A.S. Narlibahçe Sokak No. 15 Cagaloglu
Istanbul Tel. 512 01 90 Telex: 23822 dsvo-tr.
UNITED STATES OF AMERICA
European Community Information Service
2100 M Street, NW Suite 707
Washington, DC 20037 Tel. (202) 862 9500
CANADA
Renouf Publishing Co., Ltd 61 Sparks Street
Ottawa
Ontario K1P 5R1
Tel. Toll Free 1 (800) 267 4164 Ottawa Region (613) 238 8985-6
Telex 053-4936
JAPAN
Kinokuniya Company Ltd 17-7 Shinjuku 3-Chome Shiniuku-ku
Tokyo 160-91 Tel. (03)354 0131 Journal Department PO Box 55 Chitóse Tokyo 156 Tel. (03) 439 0124
.
Price (excl. VAT) in Luxembourg: Single copy ECU 5.50 · Subscription ECU 46.50
oo
OFICINA DE PUBLICACIONES OFICIALES DE LAS COMUNIDADES EUROPEAS KONTORET FOR DE EUROPÆISKE FÆLLESSKABERS OFFICIELLE PUBLIKATIONER AMT FUR AMTLICHE VERÖFFENTLICHUNGEN DER EUROPAISCHEN GEMEINSCHAFTEN ΥΠΗΡΕΣΙΑ ΕΠΙΣΗΜΩΝ ΕΚΔΟΣΕΩΝ ΤΩΝ ΕΥΡΩΠΑΪΚΩΝ ΚΟΙΝΟΤΗΤΩΝ
OFFICE FOR OFFICIAL PUBLICATIONS OF THE EUROPEAN COMMUNITIES OFFICE DES PUBLICATIONS OFFICIELLES DES COMMUNAUTÉS EUROPÉENNES UFFICIO DELLE PUBBLICAZIONI UFFICIALI DELLE COMUNITÀ EUROPEE BUREAU VOOR OFFICIËLE PUBLIKATIES DER EUROPESE GEMEENSCHAPPEN SERVIÇO DAS PUBLICAÇÕES OFICIAIS DAS COMUNIDADES EUROPEIAS
ISSN 1011-0844