This is a repository copy of
Surviving gas expulsion with substructure
.
White Rose Research Online URL for this paper:
http://eprints.whiterose.ac.uk/106556/
Version: Accepted Version
Article:
Lee, P.L. and Goodwin, S.P. (2016) Surviving gas expulsion with substructure. Monthly
Notices of the Royal Astronomical Society, 460 (3). pp. 2997-3001. ISSN 0035-8711
https://doi.org/10.1093/mnras/stw988
[email protected]
https://eprints.whiterose.ac.uk/
Reuse
Unless indicated otherwise, fulltext items are protected by copyright with all rights reserved. The copyright
exception in section 29 of the Copyright, Designs and Patents Act 1988 allows the making of a single copy
solely for the purpose of non-commercial research or private study within the limits of fair dealing. The
publisher or other rights-holder may allow further reproduction and re-use of this version - refer to the White
Rose Research Online record for this item. Where records identify the publisher as the copyright holder,
users can verify any specific terms of use on the publisher’s website.
Takedown
If you consider content in White Rose Research Online to be in breach of UK law, please notify us by
Surviving gas expulsion with substructure
Pawe l L. Lee, Simon P. Goodwin
⋆Department of Physics and Astronomy, University of Sheffield, Sheffield, S3 7RH, UK
ABSTRACT
We investigate the reaction of clumpy stellar distributions to gas expulsion. We show that regions containing highly unbound substructures/subclusters after gas expulsion can produce a significant final bound cluster. The key quantity in determining if a
region is able to form a bound cluster is the globalvirial ratio, and so regions must
be looked at as a whole rather than by individual substructure/subclusters when determining if they might survive as a bound cluster.
Key words: stars: formation – stars: clusters
1 INTRODUCTION
Stars form from cold molecular gas, and the efficiency at which a cloud is able to convert gas to stars is thought to be only 10s of per cent (Carpenter 2000; Jørgensen 2008, Evans et al. 2009; Lada 2010; Lada, Lombardi & Alves 2010; Murray 2011). Therefore the environment in which young stars find themselves contains significant amounts of gas. However, by (at most) 10 Myr the gas has been dispersed by feedback (internal and/or external) and the stars are ‘naked’ (Lada & Lada 2003).
The loss of a significant fraction of the mass of a star forming region could potentially unbind a previously bound ‘cluster’ and disperse the stars into the field. Therefore, there has been extensive interest in the effects of gas loss on the dynamics of the stars (Tutukov 1978; Hills 1980; Lada, Mar-gulis & Dearborne 1984; Goodwin 1997; Goodwin & Bastian 2006; Baumgardt & Kroupa 2007; see Goodwin 2009 for a review).
Most previous work has assumed gas loss from a single bound cluster in which the stars and gas are in equilibrium. However, it has been pointed out that it is the exact dy-namical state of the stars at the time of gas expulsion that is crucial and that gas expulsion can be significantly more or less important depending on whether the stars are slightly ‘hot’ or ‘cold’ (Lada et al. 1984; Verschueren & David 1989; Goodwin & Bastian 2006; Goodwin 2009). Recently Smith et al. (2011a,b; 2013) have shown that gas expulsion dur-ing a period when substructure is relaxdur-ing can significantly complicate and confuse matters, and Moeckel et al. (2012) point out that low-N dynamics can mimic the effects of gas expulsion.
In this paper we examine gas expulsion from a substruc-tured region. We perform very simple N-body simulations of groups of subclusters that have each undergone
instan-⋆
E-mail: [email protected]
taneous gas expulsion. We find that significant final bound clusters can remain even when the subclusters have each been very violently destroyed. This is because even though each subcluster is destroyed, they sit in a larger global po-tential due to all of the other subclusters in which a bound final cluster can form. We find that theglobalvirial ratio is the key parameter in determining survival.
In Section 2 we describe our initial conditions, and present the results of our simulations in Section 3. We dis-cuss the implications for cluster survival and draw our con-clusions in Section 4.
2 INITIAL CONDITIONS
We perform pure N-body simulations using nbody6
(Aarseth 2003). We do not include stellar evolution or any external potentials or tidal fields. All of our stars are single initially (a small number of soft binaries may form).
We distribute stellar masses randomly according to the Maschberger (2013) IMF with his standard parameters:
α=2.3, β=1.4, µ=0.2M⊙, ml=0.01M⊙, mu=150M⊙. [The Maschberger (2013) IMF is very similar to Chabrier (2003) and Kroupa (2001).]
2.1 Subclusters in a cluster
In every simulation we distributeNsub subclusters within a larger cluster. In all simulations we have 1000 stars in total (for a total mass of∼400M⊙) which are distributed between 1 and 10 subclusters.
Initially the stars are distributed in 1, 2, 5 or 10
2
P. L. Lee & S. P. Goodwin
Each subcluster is a Plummer sphere with half-mass radius Rsub and containing N⋆(sub) stars. We either set
Rsub = 0.1 pc in all cases (constant radius subclusters), or ensure that the average density is always the same at ∼22000 stars pc−3 (constant density subclusters)1. As we shall see it makes almost no difference which of these we choose.
The virial ratio of a system isQ = T /|Ω| where T is the kinetic energy, and Ω the potential energy of the system (henceQ= 0.5 is virial equilibrium when 2T+ Ω = 0). In a system which is a mixture of stars and gas, the rapid loss of the gas results in a system of stars with a virial ratio higher than that of the previous stars plus gas system.
We have three virial ratios of interest to us in this pa-per. Each subcluster has its own, local virial ratio, Qsub. The subclusters move with bulk velocities in a region which (if we ignore internal velocity dispersions) has a large-scale virial ratio,Qreg. The combination of local subclusters with velocity dispersions moving with bulk velocities in the region gives a total, global virial ratio,Qglob.
For a single cluster with a fractionǫof its mass in stars (and the rest in gas) in which the stars and gas are initially in virial equilibrium, the virial ratio of thestarsafter instan-taneous gas expulsion will beQ= 1/2ǫ. I.e. if the cluster is a 50-50 star-gas mix (ǫ= 0.5), then the post gas expulsion virial ratio will beQ= 1.
In a single cluster in which the stars and gas are initially in global virial equilibrium, then the virial ratio after gas expulsion is directly related to the star formation efficiency (ǫis the star formation efficiency).
However, if the stars and gas are not in equilibrium with each other or globally, then the relation to the star forma-tion efficiency is non-trivial (see Goodwin & Bastian 2006; Goodwin 2009). Therefore we follow Goodwin & Bastian (2006) in referring to an effective star formation efficiency (eSFE).
We assume that very rapid (instantaneous) gas expul-sion occurred in all subclusters simultaneously. This could be an external shock rapidly over-running the region, or feedback from subclusters clearing the region rapidly from within.
We take subcluster virial ratiosQsub = 0.5,1.0,1.5,2.0 and 4.0, corresponding to eSFEs of 1.0, 0.5, 0.33, 0.25, and 0.125. We will plot eSFE≡1/2Q to aid comparisons with previous papers that tend to work in (e)SFE rather than virial ratio.
We then generate a larger Plummer sphere of half-mass radius 1 pc and virial ratio of 0.5. We replace each point in the sphere with one of the previously generated subclus-ters. The bulk velocities of the subclusters are such that the subclusters are virialised in the larger cluster. Note that the total energies are not such that the initial total (global) virial ratio is 0.5, as each subcluster contains an internal ve-locity dispersion and an internal potential energy the ratios of which are set byQsub.
There will be stochasticity due to randomly placing a small number of subclusters within the larger region. There-fore we run ensembles of 10 simulations for each set of initial
1 This rather odd density was chosen as it is the density ofR sub=
0.1 pc subclusters withN⋆(sub)= 200 stars.
conditions in which we only vary the random number seed used to generate the initial conditions.
The initial conditions are summarised in Table 1. This lists the number of subclusters, Nsub, and the number of stars in each subcluster,N⋆(sub) (= 1000/Nsub), the radius of each subcluster,Rsub, the virial ratio of each subcluster
Qsub, and the density of each subcluster,ρsub. Each set of subclusters is placed in a larger virialised cluster of radius 1 pc (except theNsub = 1 ensembles for which this would make no sense). Total system virial ratios are listed in the columnQtot, these values are averages since each system in an ensemble is slightly different.
Each simulation is followed for 10 Myr. As a guide, the crossing time of a virialised 400 M⊙cluster with a half-mass radius of 1 pc is∼0.75 Myr. The crossing time of a virialised 20 M⊙subcluster of radius 0.1 pc is ∼0.1 Myr. However, the systems evolve and change so rapidly, that these initial values of local timescales are only rough guides to the actual timescales.
2.2 Final bound fractions
We calculate the final bound fraction of stars in a simulation iteratively as the centre of the remaining stars in a bound ‘cluster’ may well not be at the centre of mass and may be moving (see Smith et al. 2013). First we calculate the number of stars bound to the centre of mass and centre of velocity of the entire system (set by us initially to both be at zero). We then use only the bound stars to calculate a new centre of mass and velocity and repeat the process until the number of bound stars changes by less than 2 (this usually happens after only 2 or 3 iterations).
2.3 Summary
Between 1 and 10 subclusters are placed in a bulk virialised 1 pc region. Each subcluster has an initial virial ratio cor-responding to an internal effective star formation efficiency varying from 100 per cent (virialised subclusters) to 12.5 per cent (highly supervirial subclusters).
These systems are evolved for 10 Myr and the fraction of stars still bound in a cluster is determined.
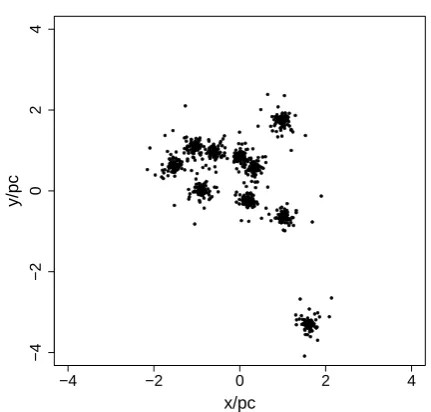
Fig. 1 shows an example of a clumpy initial conditions set produced with this method – a substructured region with 10 subclusters within a larger region. Ensembles of simula-tions are required as stochasticity will alter both the posi-tions and velocities of the subclusters in statistically ‘iden-tical’ regions.
3 RESULTS
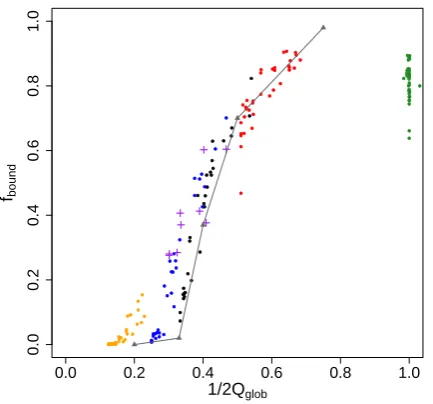
After 10 Myr the final bound fraction,fboundis determined for each simulation. Fig. 2 shows the final bound fraction against 1/2Qglob for all of the simulations in this paper: constant radius, constant density, and some complex simu-lations we will describe later. The grey triangles connected by the grey lines are the results for instantaneous gas expul-sion from a single cluster from Baumgardt & Kroupa (2007) and all of the results follow this trend.
Green points correspond to systems in which the sub-cluster virial ratios wereQsub= 0.5, red toQsub= 1.0, black
c
Table 1.Initial conditions for sub-clusters of constant radius (above the line) and constant density (below the line). Nsub
is the number of sub-clusters, N⋆(sub) is the number of stars
in a sub-cluster, Rsub is the sub-cluster half-mass radius in
pc. Qsub is the virial ratio of the sub-clusters, while Qtot is
the total virial ratio of the system.ρsubis the half-mass
num-ber density of the sub-clusters. 10 runs with different random number seeds were simulated for each set.
Nsub N⋆(sub) Rsub[pc] Qsub Qtot ρsub[stars pc−3]
1 1000 0.1 0.5 0.5 108662
1 1000 0.1 1.0 0.98 108662
1 1000 0.1 1.5 1.5 108662
1 1000 0.1 2.0 2.0 108662
1 1000 0.1 4.0 4.0 108662
2 500 0.1 0.5 0.5 54331
2 500 0.1 1.0 0.94 54331
2 500 0.1 1.5 1.41 54331
2 500 0.1 2.0 1.89 54331
2 500 0.1 4.0 3.67 54331
5 200 0.1 0.5 0.50 21733
5 200 0.1 1.0 0.85 21733
5 200 0.1 1.5 1.23 21733
5 200 0.1 2.0 1.61 21733
5 200 0.1 4.0 3.06 21733
10 100 0.1 0.5 0.50 10866
10 100 0.1 1.0 0.76 10866
10 100 0.1 1.5 1.03 10866
10 100 0.1 2.0 1.28 10866
10 100 0.1 4.0 2.49 10866
1 1000 0.17 0.5 0.50 21733
1 1000 0.17 1.0 0.99 21733
1 1000 0.17 1.5 1.51 21733
1 1000 0.17 2.0 2.0 21733
1 1000 0.17 4.0 4.0 21733
2 500 0.14 0.5 0.51 21733
2 500 0.14 1.0 0.94 21733
2 500 0.14 1.5 1.41 21733
2 500 0.14 2.0 1.87 21733
2 500 0.14 4.0 3.61 21733
5 200 0.1 0.5 0.51 21733
5 200 0.1 1.0 0.86 21733
5 200 0.1 1.5 1.25 21733
5 200 0.1 2.0 1.66 21733
5 200 0.1 4.0 3.10 21733
10 100 0.08 0.5 0.50 21733
10 100 0.08 1.0 0.79 21733
10 100 0.08 1.5 1.09 21733
10 100 0.08 2.0 1.39 21733
10 100 0.08 4.0 2.74 21733
toQsub= 1.5, blue toQsub= 2.0 and orange toQsub= 4.0. All points, no matter what the exact details of the initial conditions, follow a clear sequence from a low final bound fraction when 1/2Qglobis low, to a high final bound fraction when 1/2Qglobis high. And this relationship is very similar to that of a single cluster.
Therefore, we see that the final bound fraction depends only on the global virial ratio, and not the details or virial ratio of the substructure (except, of course, how those details set the global virial ratio).
Note that in Fig. 2 the green points at 1/2Qglob∼1 are for virialised subclusters in a virialised region. These have an eSFE of roughly unity (it is quite possible to have an
effectiveSFE of>100 per cent).
● ●● ● ● ● ● ● ● ● ● ● ● ● ● ● ● ● ● ● ● ● ● ●● ● ●● ● ●●● ●● ● ● ● ● ● ● ● ● ● ● ● ● ●● ● ● ●●●● ● ● ● ●● ● ● ● ● ● ● ● ● ● ● ● ●●● ● ● ● ● ● ● ● ● ● ● ● ●●● ● ● ● ● ● ● ● ●● ● ● ●● ● ● ●●●● ● ●●● ● ● ● ● ● ● ● ●●● ● ● ● ●●●● ● ● ● ●●● ●● ● ● ● ● ● ● ● ●● ● ●●● ● ● ● ● ● ● ● ● ● ●● ● ●● ● ●● ● ● ● ●●● ●● ● ● ● ● ●● ● ●●● ● ● ● ● ●● ● ● ● ●● ●● ● ● ● ● ● ● ●● ● ● ● ● ● ●● ● ●●●● ●●● ● ●●● ● ●●● ● ● ● ● ●● ●● ● ● ● ● ● ● ● ● ● ● ● ● ● ● ● ● ● ●●●● ● ● ● ●● ● ● ● ● ● ● ● ● ●● ● ● ● ● ●● ● ●●●●● ● ●● ● ●● ● ● ● ● ● ● ● ● ● ● ● ● ● ● ● ● ● ● ●●● ● ●● ●● ●● ● ● ● ●● ● ● ● ●●● ● ● ● ● ● ● ● ● ● ● ● ● ● ●● ● ● ● ● ● ● ● ● ● ● ● ● ● ● ● ● ● ● ● ● ● ● ● ● ● ● ● ● ●● ● ●● ●●● ● ● ●● ● ● ● ●● ● ● ● ● ● ● ● ● ● ● ● ● ● ● ● ●● ● ● ●●● ●● ● ● ● ● ● ●● ● ● ● ●● ● ● ●● ●● ● ● ● ● ●● ● ● ● ● ● ● ●●●●●● ● ● ● ● ●●●●●●● ● ● ● ●●●●●● ● ● ● ● ●●●● ● ● ●● ● ● ● ● ● ● ● ● ● ●● ●● ● ● ●● ● ● ● ● ● ● ● ● ● ● ●●● ● ●● ● ● ● ● ● ● ● ● ● ● ● ● ● ●● ● ● ● ●● ● ● ● ● ● ● ● ●●● ● ●● ● ● ● ● ● ● ●● ●● ● ● ● ● ● ● ● ●● ● ● ● ● ● ● ● ● ● ● ● ● ●●● ● ● ● ● ● ● ● ●●●●● ● ● ● ● ● ● ● ● ●● ●●● ● ● ● ● ● ● ● ● ● ● ● ● ● ● ● ● ● ●● ●●●● ●●● ● ● ● ● ● ● ●●●● ● ● ●● ● ● ● ● ● ● ●●●● ●● ● ● ●● ● ● ● ● ●● ● ●● ●●● ● ● ● ●● ●●● ●● ● ● ● ● ● ● ● ● ● ● ● ● ● ● ● ● ● ● ●●● ●●●●●●●●●● ● ● ●●●● ● ● ● ● ● ●●● ● ●●●●● ●● ●● ● ● ● ●●● ● ● ●● ●● ● ● ● ● ● ● ● ● ● ● ● ● ● ●●●● ● ● ●●●●●● ●● ● ● ● ● ● ● ● ● ● ● ● ● ● ● ●● ● ● ● ● ●● ● ● ● ● ●● ● ●●●● ●● ● ●●● ● ● ● ●● ●● ● ●●● ● ● ● ● ● ●● ● ● ● ● ● ● ● ● ● ● ● ● ● ● ●● ●● ● ● ●●● ● ● ● ●● ● ● ● ●● ● ● ● ● ● ● ● ● ● ●● ● ● ● ● ● ● ● ● ● ● ● ●●●●● ● ● ● ● ● ● ● ● ● ● ● ● ●● ● ● ●● ● ● ● ● ● ●● ● ● ● ●● ● ●●●●● ● ● ● ● ● ● ● ● ● ●●● ● ● ● ● ● ● ● ●● ● ● ● ● ● ● ● ● ● ●●●● ● ● ●● ● ● ● ● ● ●● ● ● ● ● ● ● ● ● ● ● ●● ● ●● ● ● ● ● ● ● ● ● ● ●
−4 −2 0 2 4
[image:4.595.50.287.185.613.2]−4 −2 0 2 4 x/pc y/pc
Figure 1. A projection of a ‘typical’ set of initial conditions containing 10 sub-clusters. The region is a Plummer sphere with radiusRreg=1pc and containsNsub=10, subclusters each with
Plummer radius 0.1pc and containing 100 stars.
Fig. 2 shows that if 1/2Qglob <0.2 (Qglob >2.5) the entire system is unbound after 10 Myr. This is unsurprising as the system is highly unbound.
We also see that if 1/2Qglob > 0.5 (Qglob < 1) the majority of the system remains bound. This should be of no surprise as the system is globally bound. Note that the small-N means that the relaxation time is low and signifi-cant numbers of ejections can occur. (Note that very bound distributions can collapse and eject more stars therefore re-sulting in a lower final bound fraction.)
Between 1/2Qglob = 0.2 and 0.5 there is a clear trend of increasing final bound fractions with increasing 1/2Qglob (decreasingQglob) which is exactly what would be expected. However, this is rather noisy. For 1/2Qglob ∼0.4 the final bound fraction ranges between around 0.3 and 0.7. This is due to a variety of sources of stochastic noise: in particular the exact distribution of subclusters within the region, and the distribution of the most massive stars in both real and velocity space (the stochastic loss or retention of a particu-larly large star can have significant consequences to the total mass and later evolution of the bound components).
To further test the relationship between fbound and 1/2Qglob we generated a number of ‘complex’ initial condi-tions in which we randomly sampled the number of subclus-ters (between 3 and 10), the virial ratio of each subcluster (between 0.5 and 3), the number of stars in each subclus-ter (between 100 and 300), the radius of each subclussubclus-ter (between 0.075 pc and 0.15 pc), and the virial ratio of the region (between 0.25 and 0.75).
4
P. L. Lee & S. P. Goodwin
● ● ● ● ● ●
● ●
● ● ● ●
● ●
● ● ● ● ●
● ●
● ● ●
● ● ● ●
● ●
● ● ●
●
● ● ●
0.0 0.2 0.4 0.6 0.8 1.0
0.0
0.2
0.4
0.6
0.8
1.0
1/2Qglob
fbound
● ● ●
● ● ● ● ●
● ●●
● ● ● ●● ●
● ●
● ● ● ● ● ●
● ● ● ● ●
●
● ● ● ●
● ●
●● ● ● ● ● ●
● ●
● ●
● ●
● ●
●
● ●
● ●
● ●
●
● ●
● ● ●● ● ● ●
● ●●●●
●
● ●
● ●●
● ●
● ●
●
● ● ●
● ●
●
● ●
● ● ●
●●● ●● ●● ●●●●●
● ●
● ● ●
● ● ● ●
● ●
● ● ● ● ● ● ● ●
+ +
+ + +
+
+ +
[image:5.595.45.262.120.322.2]+
Figure 2.The bound fraction,fbound, as a function of the
effec-tive star formation efficiency (≡1/2Qglob) for all simulations in
this paper. Simulations with subcluster virial ratios ofQsub= 0.5
are green points, 1 are red, 1.5 are black, 2 are yellow, and 4 are blue. Purple crosses are ‘complex’ initial conditions (see text for details). The grey triangles connected by the grey lines represent equivalent results by Baumgardt & Kroupa 2007.
Qglob we would expect a final bound fraction of around 50 per cent, and we find that the actual value is 60 per cent. A variety of complex initial conditions are shown by the pur-ple crosses which all lie on the relationship from the rather simpler initial conditions described earlier.
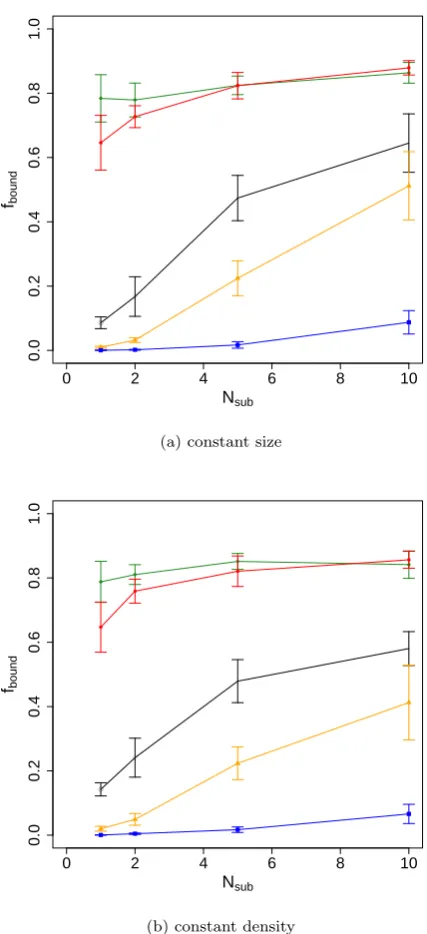
The overlap between the different initial conditions in fig. 2 shows that regions with different initial values ofQsub can result in similar final bound fractions. We investigate this further by plotting the final bound fraction against the number of subclusters in fig. 3 for the virial ratios of (from top to bottom) Qsub = 0.5 (green), 1.0 (red), 1.5 (black), 2.0 (yellow), and 4.0 (blue). The top panel of fig. 3 is for constant radius subclusters, the bottom panel for constant density subclusters.
Both the constant radius and constant density subclus-ters show very similar behaviour which is the same to within the stochastic errors. The basic trend of fig. 3 is that regions with lower-Qsub subclusters have a larger fraction of their mass retained in a final cluster. This is as expected, and the first points with only one subcluster match very well the known results for single clusters (e.g. Baumgardt & Kroupa 2007; small differences are due to the effects of the small-N
clusters we simulate). The black points haveQsub= 1.5 cor-responding to an eSFE of 33 per cent – the critical eSFE for a small cluster remaining bound (e.g. Goodwin & Bastian 2006; Baumgardt & Kroupa 2007).
What is perhaps unexpected is that in all cases the fi-nal bound fraction increases with increasing numbers of sub-clusters. This effect gives rise to the overlaps in fig. 2 and is especially pronounced for Qsub = 1.5 (black) and 2.0 (yel-low) where the final bound fraction rises from roughly zero forNsub= 1, to 0.4–0.6 whenNsub= 10. Thus, large
num-bers of highly unbound subclusters can result in a significant bound cluster.
The reason for the trend of increasing bound fraction with increasing numbers of subclusters is that the (super-virial) velocity dispersion of the subclusters decreases as their mass decreases, hence they are more bound relative to the whole system. We expect stars to remain bound if their velocity in the centre of mass/velocity frame of the whole region of size Rtot and mass Mtot is less than the escape velocity,vesc, for the whole region
vesc2 =
GMtot
Rtot
.
If the region contains Nsub subclusters each with mass
Mtot/Nsub and virial ratio Qsub, then the typical velocity,
vsub, in each subcluster will be
vsub2 =Qsub
GMtot
NsubRsub
.
Hence for larger values ofNsub we have a lower velocity for the same value ofQsub.
A subtlety is that the subclusters have a bulk motion in the global potential of the region. This means that their velocity dispersion will have a bulk component added. The conclusion is that we have to consider two ‘virial ratios’: The virial ratio of the subclusters is a measure of the local importance of gas expulsion.
The virial ratio of the subclusters within the region is a measure of the relative velocities of the subclusters to each other.
The best measure of the potential survival or destruc-tion of the whole system is the global virial ratio. The global virial ratio combines all factors into a single measure of the (un)boundness of the whole system.
4 DISCUSSION AND CONCLUSIONS
We have simulated what fraction of stars remain bound in a substructured region which has undergone instantaneous gas expulsion. We find that fundamental parameter that con-trols the future evolution of the region is the global virial ratio. The degree of substructure and local effective star formation efficiencies play no particular role other than to alter this global virial ratio.
Star forming regions clearly lose their gas in the first few Myr of their life: regions with ages less than a few Myr are still embedded, at greater ages they are naked (Lada & Lada 2003; Lada 2010). The loss of this (significant) gaseous component must have some effect on the dynamics of the stars.
Much early work concentrated on a simple, single, roughly relaxed cluster (e.g. Lada et al. 1984; Goodwin 1997; Goodwin & Bastian 2006; Baumgardt & Kroupa 2007). However, more complex (and probably realistic) ini-tial conditions add stochasticity, complex dynamics, and of-ten small-N dynamics (Moeckel & Bate 2010; Smith et al. 2011a,b; Mocekel et al. 2012; Smith et al. 2013; Farias et al. 2015).
Probably the most interesting aspect of this paper is that it suggests that there is a single parameter – the global virial ratio – that can be used as a basic indicator of the final state, no matter how complicated the initial conditions.
c
0 2 4 6 8 10
0.0
0.2
0.4
0.6
0.8
1.0
Nsub
fbound
● ●
●
●
● ●
●
●
(a) constant size
0 2 4 6 8 10
0.0
0.2
0.4
0.6
0.8
1.0
Nsub
fbound
● ●
●
●
● ●
●
●
[image:6.595.51.265.116.584.2](b) constant density
Figure 3.The bound fraction,fbound, after 10 Myr as a function
of the number of and virial ratio of sub-clusters for systems with constant sub-cluster size (top panel) and density (bottom panel). Subclusters have virial ratios from top-to-bottom ofQsub= 0.5
(green points/line), 1 (red points/line), 1.5 (black points/line), 2 (yellow points/line), and 4 (blue points/line).
In summary, no matter how complex a region is inter-nally, once gas-free whether it will form a cluster or not is governed entirely by its (stellar) global virial ratio. This means that subregions/subclusters cannot be considered in isolation from their global environment within a star form-ing region.
REFERENCES
Aarseth S. J., 2003, Gravitational N-Body Simulations. Cam-bridge University Press, November 2003
Baumgardt H. & Kroupa P., 2007, MNRAS, 380, 1589 Carpenter J. M., 2000, AJ, 120, 3139
Chabrier G., 2003, PASP, 115, 763 Evans N. J., II, et al. 2009, ApJS, 181, 321
Farias J. P., Smith R., Fellhauer M., Goodwin S., Candlish G. N., Bla˜na, M., Dominguez, R., 2015, MNRAS, 415, 2451 Goodwin S. P., 1997, MNRAS, 284, 785
Goodwin S. P., 2009, Ap&SS, 324, 259
Goodwin S. P. & Bastian N. 2006, MNRAS, 373, 752 Hills J. G., 1980, ApJ, 235, 986
Jørgensen J. K., Johnstone D.; Kirk H.; Myers P. C., Allen L. E.; Shirley Y. L., 2008, ApJ, 683, 822
Kroupa, P. 2001, MNRAS, 322, 231
Lada C. J., 2010, Phil. Trans. R. Soc. A, 368, 713 Lada C. J., Lada E. A., 2003, ARAA, 41, 75
Lada C. J., Lombardi M., Alves J. F, 2010, ApJ, 724, 687 Lada C. J., Margulis M., Dearborn D., 1984, ApJ, 285, 141 Maschberger T., 2013, MNRAS, 429, 1725
Moeckel N., Bate M. R., 2010, MNRAS, 404, 721
Moeckel N., Holland C., Clarke C. J., Bonnell I. A., 2012, MNRAS, 425, 450
Murray N., 2011, ApJ, 729, 133
Smith R., Fellhauer M., Goodwin S., Assmann P., 2011, MNRAS, 414, 3036
Smith R., Goodwin S., Fellhauer M., Assmann P., 2013, MNRAS, 428, 1303
Smith R., Slater R., Fellhauer M., Goodwin S., Assmann P., 2011, MNRAS, 416, 383
Tutukov A. V., 1978, A&A, 70, 57