This is a repository copy of When future change matters: modelling future price and
diffusion in health technology assessments of medical devices.
White Rose Research Online URL for this paper:
http://eprints.whiterose.ac.uk/102458/
Version: Accepted Version
Article:
Grimm, S.E. orcid.org/0000-0002-2175-7999, Dixon, S. and Stevens, J.W. (2016) When
future change matters: modelling future price and diffusion in health technology
assessments of medical devices. Value in Health, 19 (6). pp. 720-726. ISSN 1098-3015
https://doi.org/10.1016/j.jval.2016.06.002
Article available under the terms of the CC-BY-NC-ND licence
(https://creativecommons.org/licenses/by-nc-nd/4.0/)
eprints@whiterose.ac.uk https://eprints.whiterose.ac.uk/
Reuse
This article is distributed under the terms of the Creative Commons Attribution-NonCommercial-NoDerivs (CC BY-NC-ND) licence. This licence only allows you to download this work and share it with others as long as you credit the authors, but you can’t change the article in any way or use it commercially. More
information and the full terms of the licence here: https://creativecommons.org/licenses/
Takedown
If you consider content in White Rose Research Online to be in breach of UK law, please notify us by
1
When future change matters: modelling future price and diffusion in health technology assessments of
medical devices
Abstract
Objectives: Whilst health technology assessments (HTAs) that take account of future price change have been
examined in the literature, the important issue of price reductions that are generated by the reimbursement
decision has been ignored. Our objective is to explore the impact of future price reductions caused by
increasing uptake on HTAs and decision making for medical devices.
Methods: We demonstrate the use of a two-stage modelling approach to derive estimates of technology price as
a consequence of changes in technology uptake over future periods based on existing theory and supported by
empirical studies. We explore the impact on cost-effectiveness and expected value of information analysis in an
illustrative example based on a technology used in pre-term birth screening that is in development.
Results: The application of our approach to the case study technology generates smaller incremental
cost-effectiveness ratios (ICERs) compared to the commonly used single cohort approach. The extent of this
reduction of the ICER depends on the magnitude of the modelled price reduction, the speed of diffusion and the
length of the assumed technology-life horizon. Results of value of information analysis are affected through
changes in the expected net benefit calculation, the addition of uncertain parameters and the diffusion-adjusted
estimate of the affected patient population.
Conclusions: Since modelling future changes in price and uptake has the potential to affect HTA outcomes,
modelling techniques that can address such changes should be considered for medical devices that may
2
Introduction
Health technology assessments (HTAs) rarely take potential future reductions in price caused by increased
implementation into account in their modelling of cost-effectiveness (1). Reimbursement bodies such as the
UK’s National Institute for Health and Care Excellence (NICE) typically make assessments based on a single patient cohort and follow their costs and effects through patients’ lifetimes or through a specific time horizon. Several articles have explored how future cohorts can be incorporated into cost-effectiveness analyses. Hoyle
and Anderson (1) and Hoyle (2,3) have established future cohorts ICERs in order to reflect future drug price
reductions and the time-varying mix of prevalent and incident patients which, conditional on differing parameter
values for both groups, affect final model outputs.Philips, Claxton & Palmer (4) included future cohorts and
modelled changes in price, evidence and competition to explore how the decision time horizon in value of
information analysis should be set.
However, these analyses remain divorced from the decision making context of all reimbursement bodies. Where
future changes are independent of the reimbursement decision, such as price reductions following generic entry
(5), these can be accommodated by traditional ‘single cohort models’ through re-appraisal at future time points once these price changes occur. Up to then, the price parameter can be assumed to be constant and the single
cohort model without any price changes would be adequate for decision making. However, changes that are
dependent on the reimbursement decision, such as price changes produced by increased uptake that have been
observed in medical devices (6) and are described as experience curves, must be incorporated into the decision
or else these price changes may not be realised if the technology is rejected by the reimbursement body.
Consequently, patients will not get access to a technology that, given sufficient uptake, could be cost-effective
and provide a positive incremental net benefit.
Central to this issue is a detailed consideration of uptake, diffusion and associated price changes. Uptake is
defined, for the purposes of this paper, as the number of units of a technology purchased through the health
system relating to a specific medical indication, whilst diffusion is defined as the process of uptake growth over
time. Both uptake and diffusion can also refer to the presentation of number of adoptions as a proportion of the
number of attainable or desirable adoptions. The phenomenon of experience curves describes the impact of
3 curve literature (6,7) and came to the conclusion that experience curves and diffusion theory have not been
merged and applied to a HTA setting.
The aim of this paper is to explore the impact of diffusion and associated price changes on HTA. Because
empirical evidence of these price changes exist only for medical devices, the proposed approach will be most
relevant in this context, although it could be used in any technology for which such future price reductions are
believed to be plausible. We demonstrate the use of a two-stage modelling approach based on existing theory
and empirical evidence that includes future changes in price and uptake. We then explore the impact on
cost-effectiveness and value of information analysis results in an illustrative example.
Methods
The experience curve model
There is ample evidence for experience curves that shows how increasing uptake leads to price reductions in a
variety of different technologies as well as from a study of twenty medical devices by Brown (6). Experience
curves can be justified through a technology’s competitive situation (6). When the conditions of perfect competition and perfect information are not satisfied, pricing occurs above marginal costs, especially in R&D
intensive industries (8). The larger a market becomes, the more likely it is for competitors to enter. In the
health-care industry this would typically occur after patent expiry but also prior to that through between-patent
competition through close substitutes (8). With increasing competition, prices are likely to fall. In addition,
economies of scale that describe reductions in costs with increasing production volume may also lead to reduced
costs and prices (6,7). Whilst price reductions that are consistent with an experience curve model could in theory
be present for all health care products where the market conditions highlighted above exist, there is no evidence
on experience curves in pharmaceuticals. Price changes observed for pharmaceuticals are typically related to
patent expiry (5), rather than uptake and associated production volumes. Consequently, this work appears to be
4 Experience curves relate technology price to uptake. More specifically, it has been observed that prices of
medical devices decline to a percentage of the technology’s initial price every time initial production volume doubles (6):
(1)
Where is the cumulative uptake or sales volume up to period t, with being the price at , is the price
that was set at initial quantity which is maintained until , is the experience curve parameter or
the percentage of the technology’s initial price with , and is the number of times that the initial quantity doubled, with . Table 1 provides a definition of all parameters and the equation is
graphed with different parameter values Figure 2 and explained in the Results section.
Equation (1) implies that prices remain stable until the initial production quantity has doubled for the first time.
Furthermore, price is dependent on technology uptake through , the number of times that the initial quantity
had doubled, rather than on time. This highlights the need for another piece of information: technology uptake
over time.
The uptake model
Technology uptake is a time-dependent process that has been described in the theory of diffusion of innovations.
The theory of diffusion was given prominence by Rogers (9) who, in 1962, gave the impetus for further
diffusion research of theoretical and empirical nature. Rogers established a diffusion model that is characterised
by an s-shaped curve showing how cumulative adoptions increases over time (10). Whilst this generalisation
may not apply to all technologies, the fact that full uptake does not generally occur instantaneously is supported
by studies that highlighted that innovative health technologies, deemed cost-effective in an HTA, were not
adopted to their full potential (11,12). We are not aware of any other empirical evidence on diffusion of medical
devices and therefore assume that the s-shape of diffusion holds. We use an established parameterised diffusion
model developed by Bass (13), which is a logistic model with parameters reflecting the degree of innovation and
5
, (2)
where is the number of new adoptions in period t, with , p the coefficient of innovation,
and q the coefficient of imitation, with to ensure the s-shape(10), the total number of attainable
adoptions with , the cumulative number of adoptions up to . To our knowledge, restrictions on
p and q are not clearly defined in the diffusion curve literature. We found that the model worked best at values
of . This model is graphed in Figure 3 and explained further in the Results section.
The dynamic cost-effectiveness model
The standard measure of assessing a technology’s value is the ICER which represents the incremental
population mean costs relative to the incremental population mean quality-adjusted life-years (QALYs) of one
technology compared to another. Inferences about costs and benefits of health technologies are commonly based
on population means assumed to reflect at least one cohort of patients or mean of future cohorts (1).
(3)
Where and are the population mean costs and effects of interventions i and j, with .
Experience curves can be integrated in the cost-effectiveness framework through modelling future periods up to
a certain technology-specific time horizon and using the experience curve and uptake models in the dynamic
ICER calculation. We assume that, given a positive reimbursement decision, uptake would follow equation (2),
and given a negative reimbursement decision, no uptake of the technology would occur. Costs in period t are
now dependent on price and cumulative uptake up to period t through the experience curve model. It is
important to note that we consider future incident cohorts in the modelling of future periods. The reason we
6 periods in technologies in which consumption occurs in each period. In some cases, medical devices are
associated with one-off costs in the first period– in which case a future period equals a future cohort.
To compare cost-effectiveness in this dynamic setting with cost-effectiveness in a commonly used static setting
with only one period or cohort modelled, we propose summarising the average of costs over time up to the
technology life horizon and the average of effects over time in the average dynamic ICER (Equation (4)). For
this, knowledge of the technology life horizon is needed. This may be the time at which the technology is
anticipated to be replaced by another better technology or at which it changes due to further product
development. It may also be useful to consider the per-period dynamic ICER in which the costs and effects in
one specific period (or cohort) are used for the calculation. Contrary to other studies (1-3), we have refrained
from weighting the average dynamic ICER by uptake as weighting would lead to assessing a mix of
technologies rather than identifying the most efficient technology based on their costs and health effects. Uptake
is therefore reflected in each period’s (or cohort’s) costs, but not used to provide a weighted average of incremental costs and effects.
,
(4)
where c P is the difference in costs between interventions over all incident and prevalent cohorts in period
t, as a function of price and uptake and are effects in each period of time, both summed up over the number
of periods up to technology life horizon and discounted at a discount factor of with r as the
discount rate, with c P e t r .
The effect of the dynamic model on Value of Information analysis
Value of Information (VOI) analysis provides the value of resolving decision uncertainty, thus indicating the
potential value of further research. The expected value of perfect information (EVPI), for instance, quantifies
the expected opportunity loss associated with the overall decision uncertainty present in an appraisal. Results of
7 expected net monetary benefit that now are dependent on uptake and experience curves as well as the
technology life horizon adopted.
(5)
where is the net monetary benefit, and is the willingness-to-pay threshold with .
The EVPI is then:
(6)
Where is the expected net monetary benefit of technology j given the uncertain model input
parameters .
Furthermore, the value of the EVPI accrued over the affected patient population is commonly used to compare
the value of further research to its costs. This value is also affected by our dynamic analysis, when a technology
is not fully implemented instantly. The number of patients affected then needs to be adjusted by uptake (18,19).
This is not usually done: most VOI studies reporting the EVPI for the population use an estimate of the disease
incidence or eligible patient population as the population estimate without adjusting for uptake (18,20). If we
have knowledge of diffusion, we are able to calculate the diffusion-adjusted population EVPI (PEVPI) by
adjusting the population estimate by time-dependent uptake:
(7)
where is uptake of the recommended technology j in period t as a proportion of the desirable number of
adoptions , is the discounted affected patient population and is the VOI time horizon.
8 We illustrate future price changes through the experience curve using an illustrative example on a technology in
development for pre-term birth screening. A new screening technology (T1) is evaluated against no screening
(T0). When tested positive, high risk women will be treated which leads to a reduction in the number of women
with premature births. There are three different health outcomes associated with the duration of gestation: full
health, life-long disability and death of the baby. These health states are associated with utilities measured in
QALYs, and the health states as well as pre-term birth itself and potential hospital treatments for mother and
baby have costs linked to them.
We created a simple decision tree model that yields the ICER for one period. It is worth noting that in this case
study, because screening and treatment happen within one year, a period coincides with one cohort. In some
other technologies, such as drugs, this may not be the case, and for those, costs and effects for all prevalent
cohorts that use the technology have to be summed up for each period. The model was populated with data from
previous cost-effectiveness analyses (21, 22), and ongoing studies on technology T1 as well as some simplifying
assumptions. An extra step of modelling uptake for each period of time and the associated price for the same
period according to equations (1) and (2) is necessary. We simulated a number of future periods up to the
chosen technology life horizon and included the price changes from the previous step into the calculation of the
new cost for each period. To represent decision uncertainty, a probabilistic sensitivity analysis (PSA) with 1,000
iterations was performed and the EVPI and PEVPI calculated (population of 26,000 women screened per annum
is used) using a threshold of £30,000 per QALY. We performed partial EVPI analyses using a generalised
additive model regression method (23) to present decision uncertainty contributed by the technology life
horizon, the uptake and experience curve parameters.
Parameterising the experience curve requires both data on the experience curve parameters and data on diffusion
parameters. We obtained diffusion estimates for the new technology T1 by performing an elicitation of expert
beliefs about parameters that informed the Bass model of technology growth. Beliefs elicited from three experts
were synthesised using linear pooling. The method only required elicitation of three uncertain quantities to
generate a multi-period diffusion curve, including the total attainable number of adoptions, the number of
adoptions in the first period after technology introduction, and the time to peak number of per period adoptions.
From these, the Bass model parameters were approximated by an optimisation procedure within Excel that
9 the initial production quantity was based on the elicited number of adoptions for the first period with an
additional 50% added to it (10 devices adopted in the first year). Alternatively, a wealth of literature has shown
the fit of the Bass model with real world diffusion data across industries, with meta-analyses of the main
parameters p and q available (14) that may be useful to inform decision models in health. With respect to data
on specific health technologies, studies by Gobok et al. (15) and Sillup (16) have demonstrated the value of the
Bass model in prospective and retrospective analyses of different technologies including neurological
monitoring with biomarkers, CT scans, MRI and others with parameter values available from these reports. We
suggest basing the experience curve alpha parameter estimate based on the range reported in the empirical study
by Brown et al.(7) (we use alpha=90%), or perform expert elicitation on this. We explored the effects of
different values for diffusion parameters on the shape of the diffusion curve and of the experience curve
parameters on the format of price changes.
Results
The price of the new screening technology T1 declines after approximately 15% of the attainable uptake has
been achieved after two years (Figure 1). The short time in which price remains stable and the subsequent rather
quick price decline is a consequence of the parameter values, that cause the initial production run of the device
to end at the same time as uptake increases exponentially. With uptake exhibiting diminishing marginal growth
towards the later periods, price converges to an asymptote. More intuitively, when uptake growth becomes
slower, the reduction in technology price decreases until the lowest possible level of price is reached. Using
different values for the experience curve and diffusion parameters shows that both have a significant effect on
technology price (Figure 2). For instance, given that all else remains equal, an experience curve parameter
(alpha in Equation 1) of 80% could reduce future price to less than half of its starting value once 140 adoptions
are reached, which in the case study example is at approximately 10 years. An alpha of 95%, in contrast, would
reduce the future price to just more than 80% of its starting value. The effect of different values for diffusion
parameters p and q is shown in Figure 3: we used the minimum, maximum and mean values that resulted from
1,000 simulations inverting the elicited quantities to yield parameters p and q, and plotted resulting diffusion
curves for parameter p in Figure 3a, holding parameter q constant; and for parameter q in Figure 3b, holding
parameter p constant. Both parameters could significantly change the speed of diffusion, which would result in
10 The average dynamic ICER is shown to be lower than the commonly used static ICER (Figure 4). This is
explained by uptake and price changes affecting costs associated with T1 in such a way that they decline over
time, resulting in decreasing per-period dynamic ICERs in each future period modelled. The technology life
horizon chosen crucially determines how much lower the dynamic ICER is compared to the static ICER (Figure
4). Modelling more future periods would increase the number of periods with a low ICER and thus lower the
average dynamic ICER further. Choosing a shorter technology life horizon may mean that price changes have
not been realised and that the average dynamic ICER remains closer to the static ICER. This negative
relationship between the average dynamic ICER and technology life horizon exhibits diminishing marginal
returns, which is explained by the per-period dynamic ICER decreasing with diminishing marginal returns
(Figure 4).
Adding experience curve and diffusion parameters to the model increases the expected opportunity loss
associated with decision uncertainty, as calculated by the EVPI (£175 per person in the dynamic analysis versus
£112 in the static analysis). The uncertainty associated with the added parameters relating to uptake, the
experience curve and the time horizon has an effect on model outcomes and there is value associated with a
reduction in uncertainty, with EVPPIs of, respectively: £7.5, £0.01 and £0.06. Together, the diffusion and
experience curve parameters have a grouped EVPPI of £11 and the diffusion and technology life horizon
parameters a grouped EVPPI of £11.5. The main contributors to decision uncertainty in this example are the
parameters describing the predictive ability of T1 (i.e. the sensitivity and specificity parameters).
We show that the diffusion-adjusted PEVPI is smaller than the unadjusted PEVPI (Figure 5). This relationship
has to hold as long as uptake of the recommended technology is smaller than 100%. There is a decrease in the
unadjusted PEVPI with the VOI time horizon that exhibits diminishing marginal returns, explained by the effect
of discounting (Figure 5). The diffusion-adjusted PEVPI shows a more ambiguous relationship with time. The
low initial values for the diffusion-adjusted PEVPI are explained by low values for uptake in the first few
periods. The subsequent increase is a consequence of rapidly growing uptake that offsets the negative effect of
discounting. When uptake reaches its maximum, the diffusion-adjusted PEVPI decreases. Finally, it is
noteworthy that the difference between the two estimation methods for the PEVPI becomes smaller over time,
11
Discussion
We have shown that future changes in price and uptake affecting medical devices and a varying time horizon for
modelling future periods significantly affect cost-effectiveness and EVPI results in an illustrative example.
Technology T1 became more cost-effective when future periods and price declines with time and uptake were
modelled. PEVPI results were dependent on uptake and results of the partial EVPI analysis implied that there
was value in reducing uncertainty surrounding future change parameters in this example.
These results are in line with findings by Hoyle (3) that taking into account future price changes of drugs could
reduce ICERs by up to 46% in the author’s case studies. These findings call into question the commonly made assumption of the first cohort being representative of future periods until re-appraisal is undertaken, and the
common disregard for changes that are precipitated by the reimbursement decision itself. The proposed model is
especially useful in technologies that may be rejected at the common cost-effectiveness threshold but that may
exhibit a decline in price with increasing uptake, as cost-effectiveness could potentially fall below the threshold.
In such a setting, our framework improves analytic accuracy by explicitly modelling future price changes and
therefore enables decision makers to transparently utilise the resulting outcomes in decision-making.
Furthermore, decision-makers may want to consider the value of implementation measures to boost uptake and
increase the value of the technology to the health system. The experience curve modelling approach could be
presented as a scenario analysis in a submission, given that more evidence on these price changes is desirable. If
used in the base case, it is important to reflect uncertainty about the experience curve and diffusion parameters.
In technologies for which price does not represent a substantial part of its cost to the health care system our
approach may not affect model outcomes considerably.
The framework described in this paper ignores some of the operational details related to its use as these will be
specific to individual reimbursement systems. However, it should be noted that some of the uncertainties
included in our analysis can be reduced or potentially eliminated by reimbursement bodies. For example, NICE
Technology Appraisals are usually scheduled to be reviewed every five years. Over this time frame, any price
12 reimbursement bodies may want to consider reducing the uncertainty around price changes by making
reimbursement contingent on the establishment of price and volume contracts.
It is important to recognise that when modelling future cohorts there is a trade-off of present against future
welfare. We assumed that discounted future welfare gains of one technology could offset larger present welfare
gains of another technology. The key problem with this is the uncertainty surrounding future events. Price
changes might never materialise or another more cost-effective technology could become available. Careful
consideration of competitor technologies to be launched in the following years is therefore advisable, as was
highlighted previously in the context of causes for declining sales volumes in drugs (3). As for the uncertainty
surrounding future price changes, we advise treating the price change parameter as any other uncertain
parameter including uncertainty.
The strength of this research relates to the use of price changes via experience curve and diffusion theory in
health economic modelling. We are not aware of any other study incorporating experience curves in
cost-effectiveness and VOI analyses. Hoyle (3) investigated the effect of declining real drug prices on the ICER and
developed a life-cycle correction factor to take these into account. Incorporation of these price changes into a
cost-effectiveness analysis that supports a reimbursement process is questionable. If the price changes are
independent of the decision, then they need not be included; re-appraisal at the appropriate time point would be
an alternative approach.
Another strength of the research is that we explored the effects of uncertainty surrounding the time horizon
parameter. The choice of a technology-specific time horizon was shown crucial for the value of the dynamic
ICER. There is differing literature on the appropriate time horizon. Hoyle (2) estimated the mean drug lifetime
to be 57 years (95% confidence interval 39-79 years) and used this as a proxy to a time horizon. In contrast,
medical devices seem to have much shorter lifespans, estimated as short as 18 months (24). While the ISPOR
Good Research Practices task force (25) recommends a time horizon long enough to capture all relevant
outcomes which may result in a lifetime horizon, the interpretation of this refers to the within-cohort time
horizon rather than to the number of periods that should be modelled in the future for separate cohorts. No
matter what time horizon is chosen, it is appropriate to include this within the PSA due to uncertainty over its
13 Some limitations of this approach to modelling future price changes relate to the added complexity and data
requirements. The two-stage approach of modelling future uptake and price increases computational time and
data requirements. For diffusion and price change parameters, we recommend the use of data from
meta-analyses or analogous technologies for simplicity but alternatively and for more context-specific estimates, data
gaps can be filled using elicitation of expert opinion. This may improve the accuracy of the estimates but
probabilistic sensitivity analysis would still be recommended on uncertain parameters. When a longer
technology life horizon is adopted, it may be worth considering changes in discount rates. The complexity of
data requirements will also increase if the dynamics of the comparator technologies are considered. This would
suggest that a modified elicitation task will be required to estimate the uptake of the comparators.
We see potential in conducting further research to explore whether experience curves hold in an increased
number of medical devices, whether experience curves also apply to pharmaceuticals and to further establish
ways of obtaining data on uptake and price change. Furthermore, the addition of experience curves has
established a more complex link between implementation and value of information analysis via price changes
that could further be explored in value of implementation and information analysis studies (26, 27, 28)
In conclusion, we argue that the future price reduction need to be incorporated through modelling future periods
in cost-effectiveness analysis when these changes are precipitated by the reimbursement decision, as is the case
with experience curves in medical devices. Modelling future cohorts in the presence of changes in price that are
dependent on uptake has the potential to alter HTA outcomes and modelling techniques that address such issues
14 References
1. Hoyle M, Anderson R. Whose costs and benefits? Why economic evaluations should simulate both
prevalent and all future incident patient cohorts. Med Decis Making. 2010;30:426-37.
2. Hoyle M. Historical lifetimes of drugs in England: Application to Value of Information and
Cost-Effectiveness Analyses. Value Health. 2010;13(8):885-92.
3. Hoyle M. Accounting for the drug life cycle and future drug prices in cost-effectiveness analysis.
PharmacoEconomics. 2011;29(1):1-15.
4. Philips Z, Claxton K, Palmer S. The half-life of truth: What are appropriate time horizons for research
decisions? Med Decis Making. 2008;28:287-99.
5. Hoyle M. Future drug prices and cost-effectiveness analyses. PharmacoEconomics,
2008;26(7):589-602
6. Brown A, Meenan BJ, Young TP. Marketing Innovation: Medical Device Prices Follow the Experience
Curve. J of Med Marketing. 2007;7(3):203-12.
7. Camejo R, McGrath C, Herings R. A dynamic perspective on pharmaceutical competition, drug
development and cost effectiveness. Health Policy. 2011;100:18-24.
8. Brown A, Meenan BJ, Dixon D, Young TP, Brennan M. Application of the experience curve to price
trends in medical devices: Implications for product development and marketing strategies. J of Med Marketing:
Device, Diagnostic and Pharmaceutical Marketing. 2008;8:241-55.
9. Rogers E. Diffusion of Innovations. 5 ed. New York: Free Press; 2003.
10. Meade DJ, Islam T. Modelling and forecasting the diffusion of innovation - a 25-year review.
International J Forecasting. 2006;22:519-45.
11. Department of Health. Innovation Health and Wealth, Accelerating Adoption and Diffusion in the
NHS. Department of Health, NHS Improvement and Efficiency Directorate, Innovation and Service
Improvement, 2011.
12. Drummond M, Weatherly H. Implementing the findings of health technology assessments. If the CAT
got out of the bag, can the TAIL wag the dog? Int J Technol Assess Health Care. 2000;16(1):1-12.
15 14. Sultan F, Farley JU, Lehmann DR. A Meta-Analysis of Applications of Diffusion Models. J Marketing
Res. 1990;27(1):70-7.
15. Gobok R, Kosasih M, Lim M, Ma H. Forecasting for Biomedical Device Companies: Application of
Techniques for a New Neuromonitoring Device. San Jose State University, Engineering FotDoG; 2009.
16. Sillup G. Forecasting the adoption of new medical technology using the Bass model. J Health Care
Market. 1992;12(4):42-51.
17. Philips Z, Claxton K, Palmer S, Bojke L, Sculpher M. Priority setting for research in health care: An
application of value of information analysis to glycoprotein IIb/IIIa antagonists in non-ST elevation acute
coronary syndrome. Int J Technol Assess Health Care. 2006;22(3):379-87.
18. Meltzer D, Hoomans T, Chung J, Basu A. Minimal modelling approaches to value of information
analysis for health research. Med Decis Making. 2011;31(6):E1-E22.
19. Hoomans T, Seidenfeld J, Basu A, Meltzer D. Systematizing the use of value of information analysis in
prioritizing systematic reviews. Rockville, MD 20850: Agency for Healthcare Research and Quality, 2012.
20. Grimm S, Dixon S, Stevens JW. Are we over-estimating the value of further research? A review of
methods used to estimate uptake in population expected value of information analyses. HEDS discussion papers
[Internet]. 04 December 2013; 13(15). Available from: http://www.shef.ac.uk/polopoly_fs/1.329389!/file/1.pdf.
21. Werner E, Han C, Pettker C, Buhimschi C, Copel J, Funai E, et al. Universal cervical-length screening
to prevent preterm birth: a cost-effectiveness analysis. Ultrasound Obst Gyn. 2011;38:32-7.
22. Honest H, Forbes C, Duree K, Norman G, Duffy S, Tsourapas A, et al. Screening to prevent
spontaneous preterm birth: systematic reviews of accuracy and effectiveness literature with economic
modelling. Health Technology Assessment. 2009
23. Strong M, Oakley J, Brennan A. Estimating Multiparameter Partial Expected Value of Perfect
Information from a Probabilistic Sensitivity Analysis Sample: A Nonparametric Regression Approach. Med
Decis Making. 2014;34(3):311-26.
24. Chapman A-M, Taylor CA, Girling AJ. Are the UK Systems of Innovation and Evaluation of Medical
16 25. Caro J, Briggs AH, Siebert U, Kuntz KM. Modeling Good Research Practices—Overview: A Report of the ISPOR-SMDM Modeling Good Research Practices Task Force-1. Value Health. 2012;15:796-803.
26. Fenwick E, Claxton K, Sculpher M. The value of implementation and the value of information:
combined and uneven development. Med Decis Making. 2008;28(1):21-32.
27. Hoomans T, Fenwick E, Palmer S, Claxton K. Value of Information and Value of Implementation:
Application of an Analytic Framework to Inform Resource Allocation Decisions in Metastatic
Hormone-Refractory Prostate Cancer. Value Health. 2009;12(2):315-24.
28. Willan AR, Eckermann SB. Optimal Clinical Trial Design Using Value Of Information Methods With
17
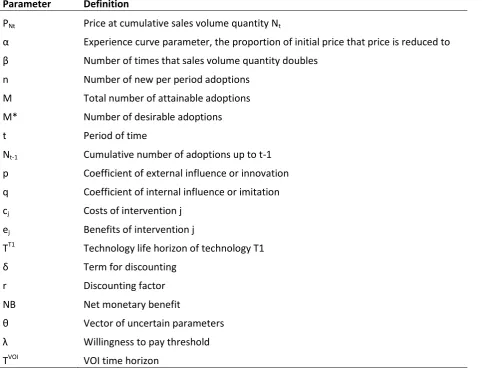
Tables
Table 1: Key parameters used in dynamic cost-effectiveness model
Parameter
Definition
P
NtPrice at cumulative sales volume quantity N
tExperience curve parameter, the proportion of initial price that price is reduced to
Number of times that sales volume quantity doubles
n
Number of new per period adoptions
M
Total number of attainable adoptions
M*
Number of desirable adoptions
t
Period of time
N
t-1Cumulative number of adoptions up to t-1
p
Coefficient of external influence or innovation
q
Coefficient of internal influence or imitation
c
jCosts of intervention j
e
jBenefits of intervention j
T
T1Technology life horizon of technology T1
Term for discounting
r
Discounting factor
NB
Net monetary benefit
Vector of uncertain parameters
Willingness to pay threshold
18
Figures
19
20
21
Figure 4: Impact of technology life horizon on dynamic ICER
[image:22.595.71.436.384.605.2]