=Ή
eurostat
Theme 2
Economy and finance
Series Β
Short-term trends
ISSN 1011-0844
ECU-EMS information
10 D 1991
Monthly
PROPOSALS MADE BY MR CHRISTOPHERSEN TO PROMOTE THE USE OF
THE ECU
An international conference entitled "Monetary and financial
instruments in ECU: statistical aspects" was organized by
Eurostat on 23 and 24 September 1991 in Luxembourg.
This conference was just one of the activities carried out by
Eurostat over the last year or so aimed at drawing up an
inventory of available statistics on the ecu, and its intention
was to cover all the different uses of the ecu.
This event brought together representatives from around
40 countries working in institutional bodies (central banks,
statistical offices, government ministries, international
organizations, etc.) and the private sector (banking,
insurance, various groups and federations, associations,
etc.). The large quantity of statistical information distributed
at the conference will soon be made public, and an
announcement will be made in this bulletin in due course
as to when this publication will appear.
In addition to the technical topics dealt with at the
conference, there were also various speeches describing
the economic and political context, and Mr Christophersen,
the Commission Vice-President responsible for economic
and statistical affairs, took this opportunity to announce a
series of proposals regarding promotion of the ecu. The
most important of these are as follows:
- designation of the ecu as the future single currency in the
new Treaty, with a range of provisions aimed at overcoming
the obstacles preventing use of the ecu and developing its
use during the intermediate stages of monetary union;
- a freeze on the composition of the basket of currencies in
the ecu before the end of stage 1 ;
- increased use of the ecu by the Community institutions,
so that all budgetary operations carried out by them
(income and expenditure) are denominated and paid in
ecus as from the beginning of stage 2;
- development of quantitative, qualitative and technical
information on the ecu, and greater emphasis on a policy
aimed at informing small and medium-sized enterprises on
the potential of the ecu;
- measures to encourage use of the ecu by various bodies
and associations, both inside and outside the Community,
and the introduction of pilot programmes on the use of the
ecu.
Eurostat recently carried out a minor revision of the
calculations of price indices in ecu given for the countries in
the exchange rate mechanism (EMS index) and for the ecu
(ECU index). While the principles behind the calculations
remained the same, changes were made in determining
the original levels (1985 monthly levels around the annual
average taken as 100) and the degree of precision used for
the calculations. The figures published for these indices in
this issue of the bulletin are, therefore, slightly different
from those published previously. The retrospective detail of
the monthly indices recalculated since 1985 will be
published in the next issue of ECU-EMS news.
Within the EMS exchange rate mechanism, the only
notable developments during the month of September
concerned the Spanish peseta and the pound sterling
which both depreciated against the other currencies, most
of which remained stable. On 17 October, the Banque de
France reduced its intervention rate by a quarter of a point
and, although the short-term rates for the French franc are
now amongst the lowest in the European Community, in
mid-October the French franc was sitting near the bottom
of its margin of fluctuation within the narrow band of the
EMS.
Outside the European Monetary System, the US dollar was
unsettled in mid-October as a result of information which
eurostat
OFICINA ESTADÍSTICA DE LAS COMUNIDADES EUROPEAS
DE EUROPÆISKE FÆLLESSKABERS STATISTISKE KONTOR
STATISTISCHES AMT DER EUROPÄISCHEN GEMEINSCHAFTEN
ΣΤΑΤΙΣΤΙΚΗ ΥΠΗΡΕΣΙΑ ΤΩΝ
ΕΥΡΩΠΑΪΚΩΝ ΚΟΙΝΟΤΗΤΩΝ
STATISTICAL OFFICE OF THE EUROPEAN COMMUNITIES
OFFICE STATISTIQUE DES COMMUNAUTÉS EUROPÉENNES
ISTITUTO STATISTICO DELLE COMUNITÀ EUROPEE
BUREAU VOOR DE STATISTIEK DER EUROPESE GEMEENSCHAPPEN
SERVIÇO DE ESTATÍSTICA DAS COMUNIDADES EUROPEIAS
L-2920 Luxembourg - Tél. 43011 - Télex: Comeur Lu 3423
B-1049 Bruxelles, bâtiment Berlaymont, rue de la Loi 200 (bureau de liaison) - Tél. 2351111
Note
For any information on
tel. 4301-4785
4301-3288
4301-4770
Fax 4301-4150
the statistics in this bulletin contact Luxembourg:
T. Mathisse
G. Thouvenin
S. Ansion
-Contents
I.
II.
III.
IV.
V.
VI.
VII.
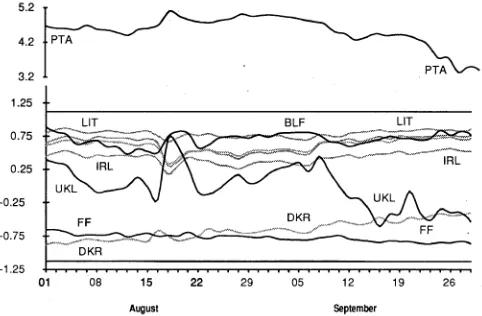
A graph of the bilateral fluctuations of the ERM currencies.
Yearly and monthly issues of ecu bonds.
EMCF rate, interest rates on ecu deposits and yields on ecu bonds.
Last month's ecu bond issues.
Consumer price indices in national currencies.
Consumer price indices in ecus.
Yearly, monthly and daily ecu exchange rates.
ECSC-EEC-EAEC, Brussels · Luxembourg, 1991
Reproduction is authorized, except for commercial purposes, provided the source is acknowledged.
TABLE I
BILATERAL FLUCTUATIONS OF THE ERM CURRENCIES
5.2 τ
August
September
CENTRAL RATES AND INTERVENTION LIMIT RATES, IN FORCE SINCE 8 OCTOBER 1990, FOR
THE CURRENCIES OF COUNTRIES PARTICIPATING IN THE EMS EXCHANGE MECHANISM.
100
100
100
100
100
1
BLF
DKR
DM
FF
HFL
IRI
1000 L
100
1
PTA
UKL
1 FOI J
+
—
.
+
- __
_
+
-+
—
.
+
.
+
_
.
+
.
+
-+
=...
-BLF
100
553.000
540.723
528.700
2109.50
2062.55
2016.55
628.970
614.977
601.295
1872.15
1830.54
1789.85
56.5115
55.2545
54.0250
28.1930
27.5661
26.9530
33.6930
31.7316
29.8850
64.6050
60.8451
57.3035
42.4032
DKR
18.9143
18.4938
18.0831
100
390.160
381.443
373.000
116.320
113.732
111.200
346.240
338.537
331.020
10.4511
10.2186
9.99130
5.21400
5.09803
4.98500
6.23100
5.86837
5.52600
11.9479
11.2526
10.5976
7.84195
DM
4.95900
4.84837
4.74000
26.8100
26.2162
25.6300
100
30.4950
29.8164
29.1500
90.7700
88.7526
86.7800
2.74000
2.67894
2.61900
1.36700
1.33651
1.30650
1.63300
1.53847
1.44900
3.13200
2.95000
2.77800
2.05586
FF
16.6310
16.2608
15.8990
89.9250
87.9257
85.9700
343.050
335.386
327.920
100
304.440
297.661
291.040
9.18900
8.98480
8.78500
4.58450
4.48247
4.38300
5.47850
5.15981
4.85950
10.50550
9.89389
9.31800
6.89509
HFL
5.58700
5.46286
5.34150
30.2100
29.5389
28.8825
115.2350
112.6730
110.1675
34.3600
33.5953
32.8475
100
3.08700
3.01848
2.95100
1.54000
1.50590
1.47250
1.84050
1.73345
1.63250
3.52950
3.32389
3.13050
2.31643
IRL
1.85100
1.80981
1.76950
10.0087
9.78604
9.56830
38.1825
37.3281
36.4964
11.3830
11.1299
10.8825
33.8868
33.1293
32.3939
1
0.510246
0.498895
0.487799
0.609772
0.574281
0.540858
1.16920
1.10118
1.03710
0.767417
LIT
3710.20
3627.64
3546.90
20062.0
19615.4
19179.0
76540.0
74821.7
73157 0
22817.0
22309.1
21813.0
67912.0
66405.3
64928.0
2050.03
2004.43
1959.84
1000
1222.30
1151.11
1084.10
2343.62
2207.25
2078.79
1538.24
PTA
334.619
315.143
296.802
1809.40
1704.05
1604.90
6901.70
6500.00
6121.70
2057.80
1938.06
1825.30
6125.30
5768.83
5433.10
184.892
174.131
163.997
92.2400
86.8726
81.8200
100
203.600
191.750
180.590
133.631
UKL
1.74510
1.64352
1.54790
9.43610
8.88687
8.36970
35.9970
33.8984
31.9280
10.7320
10.1073
9.5191
31.9450
30.0853
28.3340
0.964240
0.908116
0.855260
0.481050
0.453053
0.426690
0.553740
0.521514
0.491160
1
0.696904
TABLE II
ECU BOND ISSUES (Mio ECU) "
1985 1986 1987 1988 1989 1990
1990
1991
July Augus
I
II III IV
I
II
III
September
TOTAL
9 462 6 840 7 236 9 188 11 127 15 040
2 575 5 510 2 1 0 5 4 850
11 645 5 909 3 400 1 400 1 125
875
European C o m m u n i t y Total
5 301 4 226 4 303 5 275 6 461 10 525
1 3 7 5 3 720 1 805 3 625
9 610 5 009 1 825
150 875 800
Business sector
3 361 2 358 2 058 3 230 4 400 3 990
615 1 445
805 1 125
950 3 259 1 390
150 440 800
Govern ments
1 0 4 0 558 900 2 500 500 5 0 0 0
200 1 300 1 0 0 0 2 500
6 250 1 400
0 0 0 0
Insti tutions
900 1 310 1 345 1 8 4 5 1 5 6 1 1 535
560 975 0 0
2 4 1 0 350 435 0 435 0
Total
4 161 2 614 2 933 3 9 1 3 4 666 4 515
1 200 1 790 300 1 225
2 035 9 0 0 1 575 1 250 250
75
NonEuropea Business
sector
3 401 2 204 2 180 3 138 4 141 3 565
1 025 1 265 300 975
1 535 800 575 250 250 75
n C o m m u n i t y Govern
ments
200 3 5 0 453 575 4 2 5 550
0 3 0 0 0 250
500 0 1 000 1 000 0 0
Insti tutions
560 60 300 0 100 400
175 225 0 0
0 100 0 0 0 0
Recording based on the payment date
TABLE III
OPERATIONS RATES OF THE EMCF (CALCULATION MONTH) AND INTEREST RATES AND YIELDS OF ECU INVESTMENTS (%)
1987 1988 1989 1990
1990 September October November December 1991 January February March April May June July August September
EMCF Deposits
1 month
6.77 7.00
6.71 6.67
9.25 9.10
10.52 10.07
10.25 9.66
10.25 9.59
10.50 9.64
10.75 10.33
10.75 10.11
10.50 9.62
10.25 9.28
10.00 9.23
9.75 9.67
10.00 9.92
9.75 9.70
10.00 9.64
9.75 9.64
3 months
7.10 6.88 9.30 10.32
9.97 9.86 9.94 10.39
10.41 9.78 9.30 ■ 9.28 9.56 9.89 9.84 9.76 9.66
6 months
7.16 7.05 9.41 10.55
10.28 10.02 10.01 10.42
10.48 9.86 9.33 9.33 9.55 9.95 9.94 9.88 9.67
1 year
7.27 7.18 9.49 10.69
10.50 10.28 10.07 10.39
10.52 9.94 9.34 9.39 9.46 9.87 9.92 9.91 9.72
B o n d s < 5 years
7.85 7.70 8.86 10.83
10.86 10.90 10.69 10.66
10.55 10.04 9.70 9.63 9.51
9.64
9.77 9.82 9.56
57 years
8.24 7.89 8.70 10.42
10.46 10.42 10.20 9.97
9.99 9.30 9.20 9.07 9.00 9.12 9.24 9.23 9.03
> 7 years
8.51 8.18 8.76 10.37
10.56 10.56 10.36 10.01
TABLE IV
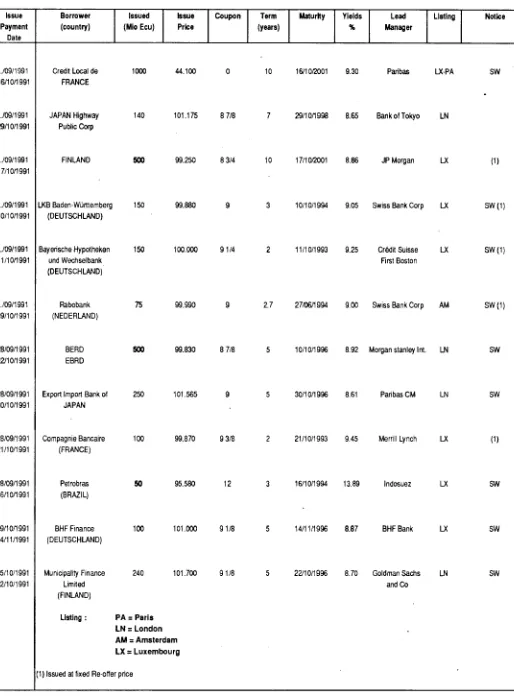
LAST MONTH'S ECU BOND ISSUES
Issue Payment
Date
.709/1991 16/10/1991
.709/1991 29/10/1991
.709/1991 17/10/1991
.709/1991 10/10/1991
.709/1991 11/10/1991
.709/1991 09/10/1991
28/09/1991 22/10/1991
28/09/1991 30/10/1991
28/09/1991 21/10/1991
28/09/1991 16/10/1991
09/10/1991 14/11/1991
05/10/1991 22/10/1991
Borrower (country)
Credit Local de FRANCE
JAPAN Highway Public Corp
FINLAND
LKB Baden-Württemberg (DEUTSCHUND)
Bayerische Hypotheken und Wechselbank (DEUTSCHLAND)
Rabobank (NEDERLAND)
BERD EBRD
Export Import Bank ot JAPAN
Compagnie Bancaire (FRANCE)
Petrabras (BRAZIL)
BHF Finance (DEUTSCHLAND)
Municipality Finance Limited (FINLAND)
Listing :
Issued (Mio Ecu)
Issue Price
1000 44.100
140 101.175
500 99.250
150 99.880
150 100.000
75 99.990
500 99.830
250 101.565
100 99.870
50 95.580
100 101.000
240 101.700
PA = Paris LN = London AM a Amsterdam LX = Luxembourg
(1) Issued at fixed Re-offer price
Coupon
0
8 7/8
8 3/4
9
91/4
9
8 7/8
9
9 3/8
12
91/8
91/8
Term (years)
10
7
10
3
2
27
5
5
2
3
5
5
Maturity
16/10/2001
29/10/1998
17/10/2001
10/10/1994
11/10/1993
27/06/1994
10/10/1996
30/10/1996
21/10/1993
16/10/1994
14/11/1996
22/10/1996
Yields
%
9.30
8.65
8.86
9.05
9.25
9.00
8.92
8.61
9.45
13.89
8.87
8.70
Lead Manager
Pari bas
Bank of Tokyo
JP Morgan
Swiss Bank Corp
Crédit Suisse First Boston
Swiss Bank Corp
Morgan Stanley Int.
Paribas CM
Merrill Lynch
Indosuez
BHF Bank
Goldman Sachs and Co
Listing
LX-PA
LN
LX
LX
LX
AM
LN
LN
LX
LX
LX
LN
Notice
SW
(1)
SW(1)
SW(1)
SW(1)
SW
SW
(1)
SW
SW
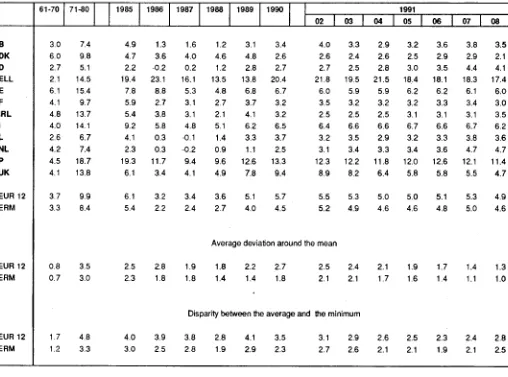
TABLE V
CONSUMER PRICE INDICES IN NATIONAL CURRENCY
1985=100
B DK D ELL E F IRL I L NL Ρ UKEUR 12 ERM 1970 34.9 26.8 50.4 10.3 13.5 25.3 15.6 14.2 37.0 40.0 6.4 19.6 25.4 29.8
1980 1985
71.2 100.0 68.3 100.0 82.6 100.0 39.1 100.0 56.2 100.0 63.3 100.0 56.1 100.0 52.5 100.0 70.3 100.0 81.8 100.0 35.2 100.0 70.7 100.0
65.3 100.0 66.7 100.0
1986 101.3 103.6 99.9 123.0 108.8 102.7 103.8 105.8 100.3 100.2 111.7 103.4 103.5 102.3 1987 102.9 107.8 100.1 143.2 114.5 105.9 107.1 110.9 100.2 99.8 122.2 107.7 106.9 104.7 1988 104.1 112.7 101.4 162.5 120.0 108.7 109.4 116.5 101.7 100.6 133.9 113.0 110.7 107.6 1989 107.3 118.1 104.2 184.9 128.2 112.7 113.9 123.7 105.1 101.7 150.8 121.8 116.4 111.9
1990 1991
02
111.0 113.8 121.2 122.8 107.0 109.1 222.6 245.3 136.8 142.0 116.3 118.6 117.6 119.6 131.8 137.5 109.0 111.4 104.2 106.1 170.9 184.6 133.3 138.4
123.0 126.9 116.9 120.7
03 113.3 123.0 109.0 249.7 142.5 118.7 119.6 138.3 111.6 106.8 185.6 138.9 127.2 120.9 04 113.4 123.3 109.5 258.3 142.8 119.1 119.6 138.8 111.2 107.2 187.1 140.7 128.0 121.0 05 113.8 124.1 109.9 259.3 143.2 119.4 120.6 139.3 111.7 107.4 189.5 151.1 128.4 121.3 06 114.3 124.4 110.5 264.3 143.6 119.7 120.6 139.8 111.9 107.5 191.1 141.7 128.9 121.6 07 114.9 124.0 111.5 264.1 145.4 120.2 120.6 140.4 112.5 109.0 191.7 141.4 129.5 122.0 08 115.3 124.3 111.5 263.5 146.0 120.4 122.2 140.8 112.8 109.4 192.9 141.7 129.8 122.8
Annual rate of increase (%)
Β DK D ELL E F IRL I L NL Ρ UK
EUR 12 ERM
EUR 12 ERM
EUR 12 ERM 61-70 3.0 6.0 2.7 2.1 6.1 4.1 4.8 4.0 2.6 4.2 4.5 4.1 3.7 3.3 0.8 0.7 1.7 1.2
71-80 1985
7.4 4.9 9.8 4.7 5.1 2.2 14.5 19.4 15.4 7.8 9.7 5.9 13.7 5.4 14.1 9.2 6.7 4.1 7.4 2.3 18.7 19.3 13.8 6.1
9.9 6.1 8.4 5.4
3.5 2.5 3.0 2.3
4.8 4.0 3.3 3.0
1986 1.3 3.6 -0.2 23.1 8.8 2.7 3.8 5.8 0.3 0.3 11.7 3.4 3.2 2.2 2.8
1.8
3.9 2.5 1987 1.6 4.0 0.2 16.1 5.3 3.1 3.1 4.8 -0.1 -0.2 9.4 4.1 3.4 2.4 1.9 1.8 Dis 3 8 2 8 1988 1.2 4.6 1.2 13.5 4.8 2.7 2.1 5.1 1.4 0 9 9.6 4.9 3.62.7
Aver<
1.8 1.4parity be
2 8 1.9 1989 3.1 4.8 2.8 13.8 6.8 3.7 4.1 6.2 3.3 1.1 12.6 7.8 5.1 4.0
ìge devi;
2.2 1.4
tween th
4.1 2.9
1990 1991
02
3.4 4.0 2.6 2.6 2.7 2.7 20.4 21.8 6.7 6.0 3.2 3.5 3.2 2.5 6.5 6.4 3.7 3.2 2.5 3.1 13.3 12.3 9.4 8.9
5.7 5.5 4.5 5.2
ition around the meai
2.7 2.5 1.8 2.1
e average and the m
3.5 3.1 2.3 2.7
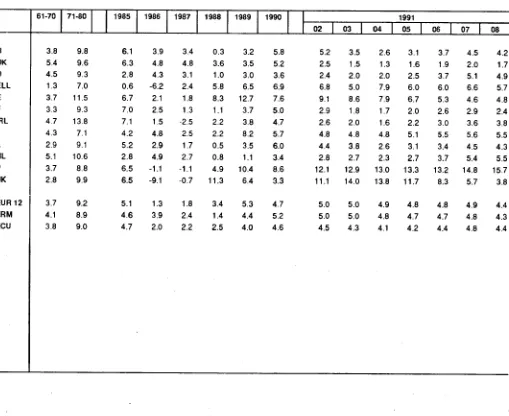
TABLE VI
CONSUMER PRICE INDICES IN ECU
1985=100
Β DK D ELL E F IRL I L NL Ρ UK EUR 12 ERM ECU 1970 30.9 28.0 30.0 35.2 24.5 30.1 16.4 32.2 32.5 27.1 28.3 27.0 29.4 30.3 30.21980 1985
78.7 100.0 70.0 100.0 72.9 100.0 69.7 100.0 72.8 100.0 73.1 100.0 58.5 100.0 63.9 100.0 77.7 100.0 74.4 100.0 65.9 100.0 69.8 100.0 70.9 100.0 71.2 100.0 71.7 100.0 1986 103.9 104.8 104.3 93.8 102.1 102.5 101.5 104.8 102.9 104.9 98.9 90.9 101.3 103.9 102.0 1987 107.4 109.7 107.5 96.1 103.9 103.8 98.9 107.3 104.6 107.7 97.8 90.0 103.1 106.4 104.2 1988 107.6 113.7 108.6 102.5 112.6 105.0 100.6 109.7 105.2 108.3 102.5 100.2 106.8 107.9 106.8 1989 111.1 117.7 112.1 107.5 126.8 108.9 104.5 118.5 108.8 109.4 112.9 106.5 112.5 112.6 111.1
1990 1991
02 117.5 121.2 123.7 124.9 116.1 118.6 114.9 116.3 136.4 142.9 114.3 115.6 109.3 110.8 125.2 129.3 115.4 118.6 113.1 115.4 122.6 133.1 110.0 115.7 117.8 121.2 118.5 121.2 116.1 120.1 03 120.4 125.2 118.3 117.4 143.9 115.5 111.1 130.6 118.6 115.9 134.6 116.8 121.6 121.5 120.3 04 120.1 125.2 118.2 120.2 144.6 116.1 110.9 131.3 117.7 115.8 135.8 119.7 122.5 122.4 120.9 05 120.7 126.3 118.8 119.8 114.9 116.3 111.2 131.8 118.5 116.3 137.5 119.5 122.8 122.7 121.3 06 121.4 126.0 119.7 122.5 144.5 116.7 112.3 132.5 118.8 116.6 138.0 119.4 123.2 123.1 121.7 07 122.1 125.2 120.8 122.3 145.7 117.1 112.3 132.5 119.4 118.3 140.4 119.5 123.8 123.7 122.5 08 122.6 125.5 121.0 121.0 146.8 117.3 112.3 132.5 119.9 118.8 142.4 119.4 124.0 123.9 122.7
Annual rate of increase (%)
Β DK D ELL E F IRL I L NL Ρ UK EUR 12 ERM ECU 61-70 3.8 5.4 4.5 1.3 3.7 3.3 4.7 4.3 2.9 5.1 3.7 2.8 3.7 4.1 3.8
71-80 1985
9.8 6.1 9.6 6.3 9.3 2.8 7.0 0.6 11.5 6.7 9.3 7.0 13.8 7.1 7.1 4.2 9.1 5.2 10.6 2.8 8.8 6.5 9.9 6.5 9.2 5.1 8.9 4.6 9.0 4.7
1986 3.9 4.8 4.3 -6.2 2.1 2.5 1 5 4.8 2.9 4.9 -1.1 -9.1 1.3 3.9 2.0 1987 3.4 4.8 3.1 2.4 1.8 1.3 -2.5 2.5 1.7 2.7 -1.1 -0.7 1.8 2.4 2.2 1988 0.3 3.6 1.0 5.8 8.3 1.1 2.2 2.2 0.5 0.8 4.9 11.3 3.4 1.4 2.5 1989 3.2 3.5 3.0 6.5 12.7 3.7 3.8 8.2 3.5 1.1 10.4 6.4 5.3 4.4 4.0
1990 1991
02 5.8 5.2 5.2 2.5 3.6 2.4 6.9 6.8 7.6 9.1 5.0 2.9 4.7 2.6 5.7 4.8 6.0 4.4 3.4 2.8 8.6 12.1 3.3 11.1 4.7 5.0 5.2 5.0 4.6 4.5
TABLE VII
ECU EXCHANGE
RATES
1982
1983
1984
1985
1986
1987
1988
1989
1990
90/09
90/10
90/11
90/12
91/01
91/02
91/03
91/04
91/05
91/06
91/07
91/08
91/09
09/02
09/03
09/04
09/05
09/06
09/09
09/10
09/11
09/12
09/13
09/16
09/17
09/18
09/19
09/20
09/23
09/24
09/25
09/26
09/27
09/30
B/LFR
44.7115
45.4380
45.4420
44.9136
43.7978
43.0392
43.4284
43.3806
42.4252
42.3865
42.4350
42.3419
42.2728
42.2126
42.1694
42.2789
42.4099
42.3492
42.2895
422887
42.2506
42.2332
42.2574
42.2627
42.2806
42.2809
42.2726
42.2811
42.2717
42.2702
42.2340
42.2209
42.2150
42.1994
42.2188
42.2211
42.2348
42.2005
42 1850
42.2116
42.1933
42.2047
42.1805
DKR
8.15687
8.13188
8.14647
8.01876
7.93565
7.88413
7.95152
8.04929
7.85644
7.87051
7.86597
7.86746
7.87305
7.88794
7.88173
7.88105
7.89459
7.87772
7.91635
7.94299
7.93522
7.91494
7.92507
7.92484
7.92653
7.92856
7.92692
7.92692
7.92234
7.91614
7.91547
7.91688
7.91455
7.90640
7.91386
7.91539
7.91204
7.90980
7.90334
7.90384
7.90349
7.90287
7.89854
DM
2.37599
2.27052
2.23811
2.22632
2.12819
2.07159
2.07440
2.07015
2.05211
2.06106
2.06127
2.05255
2.04268
2.04881
2.04840
2.05240
2.06224
2.05872
2.05469
2.05434
2.05233
2.05022
2.05414
2.05387
2.05382
2.05437
2.05395
2.05285
2.05139
2.05065
2.04929
2.04983
2.04916
2.04804
2.04911
2.04845
2.04946
2.04833
2.04757
2.04813
2.04732
2.04784
2.04708
DRA
65.342
78.088
88.340
105.739
137.425
156.220
167.576
178.840
201.412
202.542
206.895
210.260
212.611
216.831
219.449
221.353
223.536
225.165
224.548
224.787
226.514
227.467
226.894
227.002
226.908
227.003
226.924
227.167
227.400
227.258
227.432
227.494
227.694
227.798
227.456
227.602
227.635
227.943
227.815
227.913
227.747
227.715
227.997
ESC
78.007
98.689
115.680
130.252
147.088
162.581
170.059
173.413
181.108
182.933
181.817
180.696
181.072
182.484
180.193
179.069
179.032
179.018
179.925
177.334
175.956
176.076
175.853
175.868
175.658
175.697
175.669
175.898
176.307
175.777
176.024
176.028
175.823
175.936
175.864
175.797
175.875
175.878
176.352
176.436
176.623
177.200
177.035
FF
HFL
IRL
Yearly averages
6.43117
6.77078
6.87165
6.79502
6.79976
6.92848
7.03643
7.02387
6.91416
2.61390
2.53720
2.52334
2.51101
2.40089
2.33428
2.33479
2.33503
2.31214
0.689605
0.714956
0.725942
0.715167
0.733526
0.775443
0.775671
0.776818
0.767769
Monthly averages
6.90325
6.90304
691031
6.93748
6.95952
6.97249
6.98529
6.96918
697976
6.97056
6.97234
6.97441
6.97815
2.32304
2.32359
2.31507
2.30453
2.30979
2.30851
2.31348
2.32356
2.31947
2.31468
2.31441
2.31290
2.31043
0.767934
0.768583
0.766834
0.767444
0.767772
0.769838
0.770241
0.771218
0.769137
0.768074
0.767997
0.767578
0.766942
Daily rates : September
EXPLANATORY NOTES
Bilateral currency deviation (graph on page 3).
The various curves should be compared in pairs. To find the
differential between two currencies, subtract the (positive or
negative) values along the y-axis corresponding to each
currency.
The graph is drawn with the curve of the strongest currency
above that of the weakest. It shows therefore the relative position
of each currency vis-à-vis the other currencies.
When two curves intersect or merge over a period of time there
is no differential between the two currencies and their market
exchange rate equals their bilateral central rate.
The graph is drawn within a horizontal band corresponding to the
maximum 2,25% margin of fluctuation applying at any given
moment to market exchange rates and the bilateral central rates
of the ERM currencies, with the exception of the PTA and
Sterling, which have
a
maximum authorized fluctuation of 6%.
This band is divided symmetrically by a horizontal axis along
which the points would be plotted if all currencies were at their
bilateral central rate and there were therefore no fluctuations.
The daily market exchange rates of all currencies are compared
with the relevant bilateral central rates and the differentials
between the two calculated.
The maximum fluctuation between two currencies (with the
exception of the PTA and Sterling) is shown within the band,
symmetrical with the horizontal axis. The fluctuations of the other
currencies in relation to either of the two currencies in question
are shown within the maximum permissible fluctuation.
The curves are drawn by linking the daily points showing the
relative positions of each currency.
Exchange rate grid (Table I).
The intervention limit rates fixed in the official grid do not always
correspond exactly to + or - 2.25% (+ or - 6% for the peseta and
Sterling) of the central rates, since for each currency pair (whose
exchange rates are inversely proportional to one another) the
lower limit of the one corresponds to the upper limit of the other.
Ecu bond issues (Table II
&
IV).
In table II, issues are recorded as at the payment date. This
bulletin only covers international and foreign issues in ecus,
including ecu issues offering the option of conversion into other
currencies. Main source: International Financing Review
Table II shows, under the headings:
-Business sector and Governments: national issuers, both
private and public.
-Institutions: the European Investment Bank and the Commission
of the European Communities (EEC, ECSC, Euratom).
-Organizations: the specialist institutions of the United Nations,
the World Bank, the Council of Europe, etc
Table IV shows detailled information of the latest known issues,
whatever the payment date.
Interest rates and yields on ecu investments (Table III).
The interest rates for 1,3 and 6 month and 1 year deposits are
calculated on the basis of the Friday London market rates
(source: Financial Times, London Money Rates, ECU Linked
Deposit Bid).
The bonds are classified according to three types of maturities:
under 5 years, from 5 to 7 years and more than 7 years. The
redemption yields of ecu bonds are calculated each Wednesday
from a sample of fixed interest bonds, denominated in ecus and
listed on the Luxembourg Stock Exchange. These yields are
weighted by the amounts in circulation, (source: Luxembourg
Stock Exchange).
The monthly and yearly averages are the arithmetic means of
these weekly interest rates and bond yields.
Operations rates of the EMCF (Table III).
The interest rate for transactions in EMCF (European Monetary
Cooperation Fund) ecus, is the weighted average of the most
representative rates on the domestic money market of the
countries whose currencies make up the ecu basket. It is based
on the weighting of the currencies in the ecu basket as derived
from the ecu central rates in force. The rate thus calculated for a
given month applies to EMCF transactions for the following
month. In table 3, this rate relates to the month upon which the
calculations are based and not to the (following) month during
which it is used by the EMCF.
Consumer price indices in national currency (Table V).
The consumer price indices in the national currency of each
country measure changes in the purchasing power of one unit of
national currency spent in the country concerned.
Two composite indices are calculated, covering all the Member
States of the Community (EUR 12) and the ten Member States
with currencies participating in the European Monetary System
exchange rate mechanism (ERM). (Although the peseta has
been participating in the exchange rate mechanism since
19/06/89 and has been included in the calculation of the ecu
since 21/09/89, it is only taken into account in the indices relating
to the ERM which are included in this bulletin for data after
30/09/89.)
These indices are calculated as weighted arithmetic means
(chain indices) of the national indices, the weighting for each
Member State being its relative share in the final consumption of
households of the group of countries in question (EUR 12, ERM),
expressed in purchasing power standards, at current prices and
purchasing power parities.
At the foot of the table, the average weighted fluctuations around
the mean and the minimum are given for the same groups of
countries, with the same weightings. (These are calculated as
weighted averages of the absolute fluctuations in relation to the
mean and the minimum respectively). They show the degree to
which price movements in the Member States in the Community
converge.
Consumer price indices In ecus (Table VI).
For each country the index of consumer prices in ecus is
calculated by dividing the national consumer price index by the
average movement of the national currency in relation to the ecu
during the month. It measures the change in the purchasing
power of one ecu in the country concerned.
Three composite indices are calculated, covering all the Member
States of the Community (EUR 12 and ECU), the 10 Member
States participating in the European Monetary System exchange
rate mechanism (ERM). Although the peseta has been
participating in the exchange rate mechanism since 19/06/89,
and the peseta and the escudo have been included in the
calculation of the ecu since 21/09/89, these two currencies are
only taken into account in the indices contained in this bulletin for
data after 30/09/89.)
These three indices are calculated as weighted arithmetic means
(chain-indices). The weightings are defined as follows: for the
EUR 12 and ERM indices, the relative share of each Member
State in the final consumption of households for the group of
countries in question (EUR 12 or ERM), expressed in ecus at
current prices and exchange rates (annual weighting). For the
ecu index, the relative share of each Member State's currency in
the calculation of the ecu (monthly weighting).
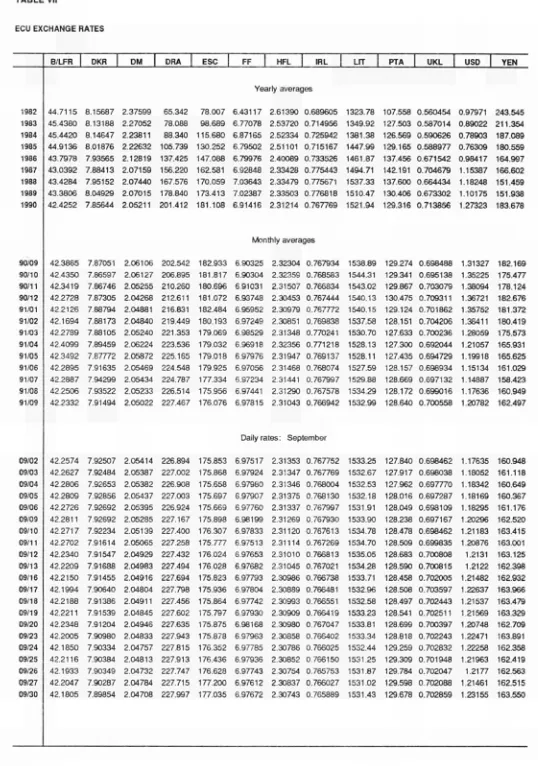
Ecu exchange rates (Table VII).
The exchange rates for the ecu against the national currencies of
the Member States of the Community, the USD and yen are
shown as annual averages, monthly averages (for the current
year), and daily rates (for the latest available month).
1 ecu = Σ
100= Σ
BFR DKR DM D R A * ESC* FF HFL IRL LFR LIT PTA
From 21/09/89 the ecu basket has been made up made as follows :
3.301 0.1976 0.6242 1.44 1.393 1.332 0.2198 0.008552 0.13 151.8 6.885
Ecu central rates from 08/10/90.
42.4032 7.84195 2.05586 205.311 178.735 6.89509 2.31643 0.767417 42.4032 1538.24 133.631
Weights of currencies on 08/10/90, calculated on the basis of current central rates, expressed in %:
7.78 2.52 30.36 0.70 0.78 19.32 9.49 1.11 0.31 9.87 5.15
UKL
0.08784
0.696904
12.60
* does not participate in the exchange rate mechanism
Venta y suscripciones · Salg og abonnement · Verkauf und Abonnement · Πωλήσεις και συνδρομές
Sales and subscriptions · Vente et abonnements · Vendita e abbonamenti
Verkoop en abonnementen · Venda e assinaturas
BELGIQUE/BELGIË FRANCE UNITED KINGDOM
M o n i t e u r belge / Belgisch Staatsblad Rue de Louvain 42 / Leuvenseweg 42 1000 Bruxelles/ 1000 Brussel
Tél. (02) 512 00 26
Fax 511 01 84
CCP / Postrekening 000200550227 Autres distributeurs / Overige verkooppunten Librairie européenne /
E u r o p e s e Boekhandel Avenue Albert Jonnart 50 / Albert Jonnartlaan 50 1200 Bruxelles/ 1200 Brussel Tél. (02) 734 02 81
Fax 735 08 60 J e a n De Lannoy
Avenue du Roi 202 /Koningslaan 202 1060 Bruxelles / 1060 Brussel Tél. (02) 538 51 69
Télex 63220 UNBOOK Β CREDOC
Rue de la Montagne 34 / Bergstraat 34 Bte 11 / Bus 11
1000 Bruxelles / 1000 Brussel
DAN MARK
J . H. Schultz Information A/S EFPublikationer
Ottiliavej 18 2500 Valby Tlf. 36 44 22 66 Fax 36 44 01 41 Girokonto 6 00 08 86
BR DEUTSCHLAND Bundesanzeiger Verlag Breite Straße
Postfach 10 80 06
5 0 0 0 Köln 1
Tel. (0221) 20 290 Fernschreiber:
ANZEIGER BONN 8 882 595 Fax 20 29 278
GREECE
G.C. Eleftheroudakis SA International Bookstore Nikis Street 4
10563 Athens Tel. (01) 322 63 23 Telex 219410 ELEF Fax 323 98 21
ESPANA
Boletín Oficial del Estado Trafalgar, 27
28010 Madrid Tel. (91) 446 60 00 MundiPrensa L i b r o s , S.A. Castellò, 37
28001 Madrid
Tel. (91) 431 33 99 (Libros) 431 32 22 (Suscripciones) 435 36 37 (Dirección) Télex 49370MPLIE
Fax (91) 275 39 98 Sucursal:
Librería Internacional AEDOS Consejo de Ciento, 391 08009 Barcelona Tel. (93) 301 86 15 Fax (93)317 01 41 Generalität de Catalunya: Llibreria Rambla deis estudie Rambla, 118 (Palau Moja)
Journal officiel
Service des publications des C o m m u n a u t é s européennes 26, rue Desalx
75727 Paris Cedex 15 Tél. (1) 40 58 75 00 Fax (1) 40 58 75 74 IRELAND
Government Publications Sales Office Sun Alliance House
Molesworth Street Dublin 2
Tel. 71 03 09 or by post
Government Stationery Office EEC Section
6th floor Bishop Street Dublin 8 Tel. 78 16 66 Fax 78 06 45 ITALIA Licosa Spa
Via Benedetto Fortini, 120/10 Casella postale 552 50125 Firenze Tel. (055) 64 54 15 Fax 64 1 2 57
Telex 570466 LICOSA I CCP 343 509
Subagenti:
Librerìa scientifica Lucio de Biasio AEIOU Via Meravigli, 16
20123 Milano Tel. (02) 80 76 79 Herder Editrice e Libreria Piazza Montecitorio, 117120 00186 Roma
Tel. (06) 679 46 28/679 53 04 Libreria giuridica
Via 12 Ottobre, 172/R 16121 Genova Tel. (010) 59 56 93
GRANDDUCHÉ DE LUXEMBOURG Abonnements seulement
Subscriptions only Nur für Abonnements Messageries Paul Kraus 11, rue Christophe Plantin 2339 Luxembourg Tél. 499 88 88 Télex 2515 CCP 4924263 NEDERLAND SDU uitgeverij
Christoffel Plantijnstraat 2 Postbus 20014
2500 EA 'sGravenhage Tel. (070) 78 98 80 (bestellingen) Fax (070) 47 63 51
PORTUGAL Imprensa Nacional Casa da Moeda, EP
Rua D. Francisco Manuel de Melo, 5 1092 Lisboa Codex
Tel. (01) 69 34 14
08002 Barcelona Tel. (93) 302 68 35
302 64 62
Distribuidora de Livros Bertrand, Grupo B e r t r a n d , SARL
Rua das Terras dos Vales, 4A Apartado 37
2700 Amadora Codex Tel. (01) 493 90 50 494 87 88 Telex 15798 BERDIS Fax 491 02 55
Ld.'
H M S O Books (PC 16) HMSO Publications Centre 51 Nine Elms Lane London SW8 5DR Tel. (01) 873 9090 Fax GP3 873 8463 Subagent:
A l a n Armstrong L t d 2 Arkwright Road Reading, Berks RG2 0SQ Tel. (0734) 75 18 55 Telex 849937 AAALTD G Fax (0734) 75 51 64
SCHWEIZ / SUISSE / SVIZZERA OSEC
Stampfenbachstraße 85 8035 Zürich
Tel. (01) 365 51 51 Fax (01) 365 52 21 ÖSTERREICH Manz'sche Verlags
u n d Universitätsbuchhandlung Kohlmarkt 16
1014 Wien Tel. (0222)531 610 Telex 11 25 00 BOX A Fax (0222) 531 6181 TURKIYE
DUnya super veb o f s e t A.S. Nariibahçe Sokak No. 15 Cagaloglu
Istanbul Tel. 512 01 90 Telex 23822 DSVOTR UNITED STATES OF AMERICA UNIPUB
4611F Assembly Drive Lanham, MD 207064391 Tel. Toll Free (800) 274 4888 Fax (301) 459 0056 Telex 7108260418 CANADA
Renouf Publishing Co., Ltd 61 Sparks Street
Ottawa Ontario K1P 5R1
Tel. Toll Free 1 (800) 267 41 64 Ottawa Region (613) 238 89 856 Telex 0534936
JAPAN
Kinokuniya Company L t d 177 Shinjuku 3Chome Shiniukuku
Tokyo 16091 Tel. (03) 354 01 31 J o u r n a l Department PO Box 55 Chitóse Tokyo 156 Tel. (03) 439 01 24 SVERIGE
BTJ
Box 200 22100 Lund Tel. (046) 18 00 00 Fax (046) 18 C1 25 AUTRES PAYS OTHER COUNTRIES ANDERE LÄNDER
Office des publications officielles d e s Communautés européennes 2, rue Mercier
L2985 Luxembourg Tél. 49 92 81
Télex PUBOF LU 1324 b Fax 48 85 73
continued from page 1
had negative shortterm effects on the performance of the
American currency.
On the international bond market, 11 issues were launched
in September, including ECU 1 billion for the Crédit Local
de France, ECU 500 million for the Republic of Finland and
an initial loan of ECU 500 million for the EBRD (European
Bank for Reconstruction and Development) cf. Table IV.
Measured on the basis of the date of receipt of the
proceeds, the total amount raised in international issues in
the third quarter of 1991 was ECU 3.4 billion, bringing the
total for the year so far to ECU 20.9 billion already a
substantial increase on 1990's 12month figure of 15 billion.
In the first nine months of 1991, the ecu was the second
most widelyused foreign currency, after the US dollar, for
international loans (source IFR).
On the domestic ecu bond markets, there were two key
dates in September: 3 September, which saw the issue of a
second tranche of the French ecu OAT (Obligation
Assimilable du Trésor) at 8.5% maturing in 2002 and
amounting to ECU 442 million, and 23 September with the
launch of an Italian CTE (Certificato del Tesoro in
Euroscudi) for a total of ECU 700 million.
On the secondary market, turnover was heavy in
September, and taking all currencies together a large
number of ecu bonds now feature prominently amongst the
most heavily traded items handled by the Cedel and
Euroclear clearing houses.
On a broader front, markets are currently awaiting the
decisions which might be taken concerning the ecu,
particularly at the next European Summit in Maastricht on 9
and 10 December 1991.
op
Price (excl. VAT) in Luxembourg: Single copy ECU 6 · Subscription ECU 56
OFICINA DE PUBLICACIONES OFICIALES DE LAS COMUNIDADES EUROPEASKONTORET FOR DE EUROPÆISKE FÆLLESSKABERS OFFICIELLE PUBLIKATIONER AMT FÜR AMTLICHE VERÖFFENTLICHUNGEN DER EUROPÄISCHEN GEMEINSCHAFTEN ΥΠΗΡΕΣΙΑ ΕΠΙΣΗΜΩΝ ΕΚΔΟΣΕΩΝ ΤΩΝ ΕΥΡΩΠΑΪΚΩΝ ΚΟΙΝΟΤΗΤΩΝ
OFFICE FOR OFFICIAL PUBLICATIONS OF THE EUROPEAN COMMUNITIES
OFFICE DES PUBLICATIONS OFFICIELLES DES COMMUNAUTES EUROPÉENNES
UFFICIO DELLE PUBBLICAZIONI UFFICIALI DELLE COMUNITÀ EUROPEE BUREAU VOOR OFFICIËLE PUBLIKATIES DER EUROPESE GEMEENSCHAPPEN SERVIÇO DAS PUBLICAÇÕES OFICIAIS DAS COMUNIDADES EUROPEIAS
ISSN 1011-0844