eurostat
Theme2
Economy
and
finance
Series B
Short-term trends
Consumer price index
11
0
1994
Monthly
S11tT07~1
ISSN 1013-3402
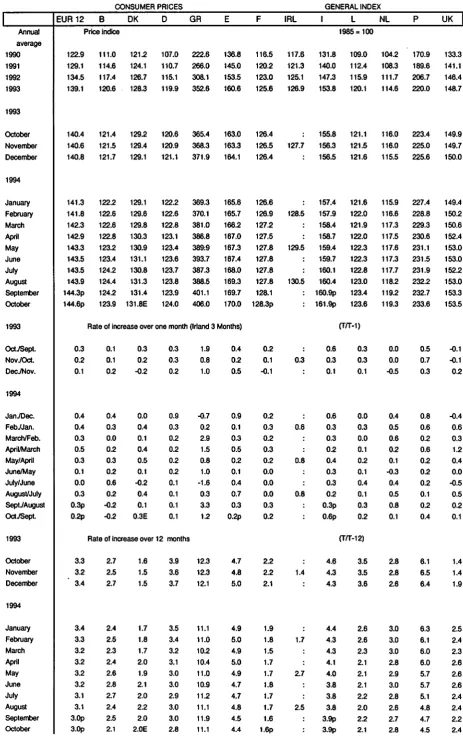
PRICES: EC annual inflation unchanged at 3.0% in October.
The annual inflation rate for the EU as measured by the CPI remained unchanged from September at 3.0 %
in October. A year ago, in October 1993, it was 3.3%.
Between September and October there was a rise of 0.2% in the monthly index for EUR 12.
Small increases were recorded in Germany, the Netherlands and the United Kingdom (O. l % ) , as well as in
France, Spain and Luxembourg (0.2%).
Higher increases were reported from Portugal (0.4%) and Italy (0.6%). The index for Greece recorded
another sharp rise of 1.2% as a result of substantial price increases for many goods and services.
For the second month running there was a decrease of 0.2% in the Belgian index, thanks to lower prices for
food, drinks and private transport.
In ascending order of current inflation the annual rates for the individual Member States for October - and
those for the corresponding period a year ago - are :
~im ~
ma
~im
Qsol2becma
October 1993
October
1992
October 1993
October 1992
France
1.6 %p
2.2%
Netherlands
2.8%
2.8%
Denmark
2.0%E
1.6%
Germany*
2.8%
3.9%
Luxembourg
2.1 %
3.5%
Italy
3.9%p
4.6%
Belgium
2.1 %
2.7%
Spain
4.4 %
4.7%
United Kingdom
2.4 %
1.4 %
Portugal
4.5%
6.1 %
Ireland**
2.5%
1.3%
Greece
11.1 %
12.3%
12
Horizontal fine indicates EU average
CPI annual %rates
10
8
6
4
2
0
F
DK
L
B
UK
IRL
NL
D
E
p
GR
The rates of inflation for eleven out of twelve Member States are within 1.5 percentage points of the EUR 12
average. The rates for the applicant Member States are : Norway l.7% (2.0%), Finland l.8% (l.6%),
Sweden 2.4% ( 4.3% ),and Austria (Sept.) 3.1 % (3.4% ). The corresponding rates for other countries are :
United States 2.6% (2.8%), Japan 0.8% (l.3%), Canada (Sept.) 0.2% (l.9%) and Switzerland 0.5% (3.4%).
*
The CPI for Federal Republic of Germany continues to reflect borders prior to 3 October 1990.
**
August 94 /August 93 and August 93 /August 92
[3?Lj
eurostat
OFICINA ESTADISTICA DE LAS COMUNIDADES EUROPEAS
DE EUROP,IEISKE F,IELLESSKABERS STATISTISKE KONTOR
STATISTISCHES AMT DER EUROPAISCHEN GEMEINSCHAFTEN
HATIHIKH YnHPEI:IA TON EYPOnA'fKON KOINOTHTON
STATISTICAL OFFICE OF THE EUROPEAN COMMUNITIES
OFFICE STATISTIQUE DES COMMUNAUTES EUROPEENNES
ISTITUTO STATISTICO DELLE COMUNITA EUROPEE
BUREAU VOOR DE STATISTIEK DER EUROPESE GEMEENSCHAPPEN
SERVlyO DE ESTATISTICA DAS COMUNIDADES EUROPEIAS
L-2920 Luxembourg -
Tel. 43 01-1 -
Telex COMEUR LU 3423
B-1049 Bruxelles, rue de la Loi 200 -
Tel. 299 11 11
The information included in this bulletin has been taken from the Crones databank, which is
accessible via the different host companies. For all information about these host companies
contact Eurostat in Luxembourg, tel. 4301-34567, fax 436404.
To obtain specifications of the principal characteristics of the series contained in this bulletin
contact Luxembourg:
Mr Nljenhuls,
tel. 4301-33202
fax
4301-34150
@
ECSC-EC-EAEC, Brussels• Luxembourg, 1994
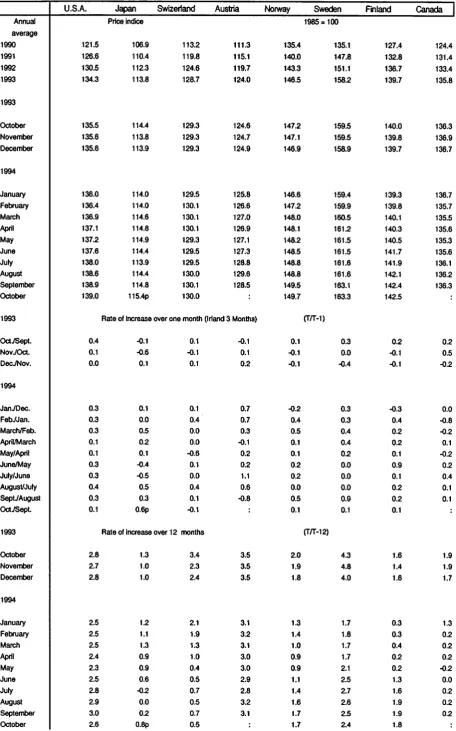
VERBRAUCHERPREISE
GESAMTINDEX
VERANDERUNG % T/T-12
BELGIQUE - BELGIE
6
5
4
3
2
0
1991 1992 1993 1994
ELLADA
25
20
15
10
5
0
1991 1992 1993 1994
IRELAND
6
5
4
3
2
0
1991 1992 1993 1994
NEDERLAND
6
5
4
3
2
0
1991 1992 1993 1994
6
5
4
3
2
1
0
7
6
5
4
3
2
0
7
6
5
4
3
2
0
14
12
10
8
6
4
2
0
CONSUMER PRICES
PRIX A LA CONSOMMATION
GENERAL INDEX
INDICE GENERAL
VARIATION% T/T-12
VARIATION% T/T-12
DANMARK
BR DEUTSCHLAND
6
5
4
3
2
0
1991 1992 1993 1994
1991 1992 1993 1994
ESPANA
FRANCE
6
5
4
3
2
0
1991 1992 1993 1994
1991 1992 1993 1994
ITALY
LUXEMBOURG
6
5
4
3
2
1
0
1991 1992 1993 1994
1991 1992 1993 1994
PORTUGAL
UNITED KINGDOM
10
8
6
4
2
0
1991 1992 1993 1994
1991 1992 1993 1994
EUR12
Annual
average
1990
1991
1992
1993
1993
October
November
December
1994
January
February
March
April
May
June
July
August
September
October
1993
Oct./Sept.
NovJOct.
Dec.JNov.
1994
JanJDec.
FebJJan.
March/Feb.
April/March
May/April
June/May
July/June
August/July
SeptJAugust
OctJSept.
1993
October
November
December
1994
January
February
March
April
May
June
July
AugustSeptember
October
TABLE I
CONSUMER PRICES
EUR 12
B
DK
D
GR
E
F
Price incfice
122.9
129.1
134.5
139.1
140.4
140.6
140.8
141.3
141.8
142.3
142.9
143.3
143.5
143.5
143.9
144.3p
144.6p
0.3
0.2
0.1
0.4
0.4
0.3
0.5
0.3
0.1
0.0
0.3
0.3p
0.2p
3.3
3.2
3.4
3.4
3.3
3.2
3.2
3.2
3.2
3.1
3.1
3.0p
3.0p
111.0
121.2
114.6
124.1
117.4
126.7
120.6
128.3
121.4
129.2
121.5
129.4
121.7
129.1
122.2
129.1
122.6
129.6
122.6
129.8
122.8
130.3
123.2
130.9
123.4
131.1
124.2
130.8
124.4
131.3
124.2
131.4
123.9
131.8E
107.0
222.6
136.8
116.5
120.2
123.0
125.6
110.7
266.0
145.0
115.1
308.1
153.5
119.9
352.6
160.6
120.6
365.4
120.9
368.3
121.1
371.9
122.2
369.3
122.6
370.1
122.8
381.0
123.1
386.8
123.4
389:9
123.6
393.7
123.7
387.3
123.8
388.5
123.9
401.1
124.0
406.0
163.0
163.3
164.1
165.6
165.7
166.2
167.0
167.3
126.4
126.5
126.4
126.6
126.9
127.2
127.5
127.8
167.4
127.8
168.0
127.8
169.3
127.8
169.7
128.1
170.0
128.3p
Rate of increase over one month (Irland 3 Months)
0.1
0.1
0.2
0.4
0.3
0.0
0.2
0.3
0.2
0.6
0.2
-0.2
-0.2
0.3
0.2
-0.2
0.0
0.4
0.1
0.4
0.5
0.1
-0.2
0.4
0.1
0.3E
0.3
0.3
0.2
0.9
0.3
0.2
0.2
0.2
0.2
0.1
0.1
0.1
0.1
Rate of increase over 12 months
2.7
2.5
2.7
2.4
2.5
2.3
2.4
2.6
2.8
2.7
2.4
2.5
2.1
1.6
1.5
1.5
1.7
1.8
1.7
2.0
1.9
2.1
2.0
2.2
2.0
2.0E
3.9
3.6
3.7
3.5
3.4
3.2
3.1
3.0
3.0
2.9
3.0
3.0
2.8
1.9
0.8
1.0
-0.7
0.2
2.9
1.5
0.8
1.0
-1.6
0.3
3.3
1.2
12.3
12.3
12.1
11.1
11.0
10.2
10.4
11.0
10.9
11.2
11.1
11.9
11.1
0.4
0.2
0.5
0.9
0.1
0.3
0.5
0.2
0.1
0.4
0.7
0.3
0.2p
4.7
4.8
5.0
4.9
5.0
4.9
5.0
4.9
4.7
4.7
4.8
4.5
4.4
0.2
0.1
-0.1
0.2
0.3
0.2
0.3
0.2
0.0
0.0
0.0
0.3
0.2
2.2
2.2
2.1
1.9
1.8
1.5
1.7
1.7
1.8
1.7
1.7
1.6
1.6p
GENERAL INDEX
IRL
I
L
NL
p
117.6
121.3
125.1
126.9
127.7
128.5
129.5
1985= 100
131.8
109.0
140.0
112.4
147.3
115.9
153.8
120.1
155.8
121.1
156.3
121.5
156.5
121.6
157.4
157.9
158.4
158.7
159.4
121.6
122.0
121.9
122.0
122.3
159.7
122.3
160.1
122.8
130.5
160.4
123.0
0.3
0.6
0.8
0.8
1.4
1.7
2.7
2.5
160.9p
123.4
161.9p
123.6
0.6
0.3
0.1
0.6
0.3
0.3
0.2
0.4
0.3
0.3
0.2
0.3p
0.6p
4.6
4.3
4.3
4.4
4.3
4.3
4.1
4.0
3.8
3.8
3.8
3.9p
3.9p
(T/T-1)
0.3
0.3
0.1
0.0
0.3
0.0
0.1
0.2
0.1
0.4
0.1
0.3
0.2
(T/T-12)
3.5
3.5
3.6
2.6
2.6
2.3
2.1
2.1
2.1
2.2
2.0
2.2
2.1
104.2
170.9
108.3
189.6
111.7
206.7
114.6
220.0
116.0
223.4
116.0
225.0
115.5
225.6
115.9
227.4
116.6
228.8
117.3
229.3
117.5
230.6
117.6
231.1
117.3
231.5
117.7
231.9
118.2
232.2
119.2
232.7
119.3
233.6
Annual
average
1990
1991
1992
1993
1993
October
November
December
1994
January
February
March
April
May
June
July
August
September
October
1993
Ocl.JSept.
NovJOct.
DecJNov.
1994
JanJDec.
FebJJan.
March/Feb.
April/March
May/April
June/May
July/June
AugusVJuly
SeptJAugust
Ocl.JSept.
1993
October
November
December
1994
January
February
March
April
May
June
July
August
September
October
U.S.A.
121.5
126.6
130.5
134.3
135.5
135.6
135.6
136.0
136.4
136.9
137.1
137.2
137.6
138.0
138.6
138.9
139.0
0.4
0.1
0.0
0.3
0.3
0.3
0.1
0.1
0.3
0.3
0.4
0.3
0.1
2.8
2.7
2.8
2.5
2.5
2.5
2.4
2.3
2.5
2.8
2.9
3.0
2.6
TABLE II
CONSUMER PRICES
Japan
Swizerland
Price
indice
106.9
110.4
112.3
113.8
114.4
113.8
113.9
114.0
114.0
114.6
114.8
114.9
114.4
113.9
114.4
114.8
115.4p
113.2
119.8
124.6
128.7
129.3
129.3
129.3
129.5
130.1
130.1
130.1
129.3
129.5
129.5
130.0
130.1
130.0
Austria
111.3
115.1
119.7
124.0
124.6
124.7
124.9
125.8
126.6
127.0
126.9
127.1
127.3
128.8
129.6
128.5
Rate of Increase over one month (Irland
3
Months)
-0.1
-0.6
0.1
0.1
0.0
0.5
0.2
0.1
-0.4
-0.5
0.5
0.3
0.6p
0.1
-0.1
0.1
0.1
0.4
0.0
0.0
-0.6
0.1
0.0
0.4
0.1
-0.1
Rate of increase over 12 months
1.3
1.0
1.0
1.2
1.1
1.3
0.9
0.9
0.6
-0.2
0.0
0.2
0.8p
3.4
2.3
2.4
2.1
1.9
1.3
1.0
0.4
0.5
0.7
0.5
0.7
0.5
-0.1
0.1
0.2
0.7
0.7
0.3
-0.1
0.2
0.2
1.1
0.6
-0.8
3.5
3.5
3.5
3.1
3.2
3.1
3.0
3.0
2.9
2.8
3.2
3.1
GENERAL INDEX
Norway
Sweden
Finland
[image:5.562.52.509.42.774.2]EXPLANATORY NOTES
METHODOLOGY
The consumer price indices given here are the national indices which have different names in
each country. As far as trends are concerned, the general index published by EUROSTAT always
corresponds to the general index published by the country. The component items of this general
index are groups of national indices aggregated according to a harmonized classification
conforming to the ESA (European System of Integrated Economic Accounts). For these groups,
the price trends correspond to the trends noted by the national indices for the same classification
field. The field covered by the general index varies according to country; as regards the
population concerned (specific income bracket, certain socio-professional categories or total
households), the geographical areas used (capital, urban areas, country as a whole, etc.) or
differences in treatments of expenditure on rent, health care, etc ... Finally, there is no uniform
method for seasonal adjustements. A fixed system is used in some countries, whereas in others a
chain system is used (variable weightings). The reference years used at national level for the
indices vary according to country. For ease of comparison, EUROSTAT has chosen 1985 as the
common year for the presentation of these indices.
THE CALCULATION OF THE EUR-12 INDEX
Venta y suscripciones • Salg og abonnement • Verkauf und Abonnement •
nw>.()am;
Kai
ouv~poµtc;
Sales and subscriptions • Vente et abonnements • Vendita e abbonamenti
Verkoop en abonnementen • Venda e assinaturas
BELGIQUE I BELGIE ITALIA SCHWEIZ I SUISSE I SVIZZERA IS RAEL
Moniteur beige I Licosa SpA OSEC
ROY International Belgisch staatsblad Via Duca di Calabria 1/1 Stampfenbachstraf3e 85
Rue de Louvain 42 I Leuvenseweg 42 Casella postale 552 8035 Zlirich PO Box 13056
1 OOO Bruxelles / 1 OOO Brussel 50125 Firenze Tel. (01) 365 54 49 41 Mishmar Hayarden Street Tel. (02) 512 00 26 Tel. (055) 64 54 15 Fax (01) 365 54 11 Te1Aviv61130
Fax (02) 511 01 84 Fax 64 12 57 Tel. 3 496108
Telex 570466 LICOSA I
BALGARIJA Fax 3 648 60 39 Jean De Lannoy
Avenue du Roi 202 I Koningslaan 202 GRAND-DUCHE DE LUXEMBOURG Europress Klassica BK
EGYPT/
1060 Bruxelles I 1060 Brussel Ltd
Tel. (02) 538 51 69 Messageries du livre
66, bd Vitosha MIDDLE EAST Telex 63220 UNBOOK B 5. rue Raiffeisen
Fax (02) 538 08 41 2411 Luxembourg Tel./Fax 2 52 74 75 1463 Sofia Middle East Observer Autres distributeurs/ Tel. 40 10 20
41 Sherif St. Overige verkooppunten: Fax 49 06 61
CESKA REPUBLIKA Cairo
Librairie europeenne/ Tel/Fax 39 39 732
Europese boekhandel NEDERLAND NISGR
Rue de la Loi 244/Wetstraat 244 SOU Overheidsinformatie Havelkova 22
1040 Bruxelles I 1040 Brussel Exteme Fondsen 130 00 Praha 3 UNITED STATES OF AMERICA I
Tel. (02) 231 04 35 Tel. (2) 24 22 94 33 CANADA
Fax (02) 735 08 60 Postbus 20014 Fax (2) 24 22 14 84 2500 EA s-Gravenhage
Tel. (070) 37 89 880 UNI PUB
DANMARK Fax (070) 37 89 783 HRVATSKA 4611-F Assembly Drive
Mediatrade Lanham. MD 20706-4391 J. H. Schultz Information A/S
PORTUGAL Tel. Toll Free (800) 274 4888
Herstedvang 10-12 P. Hatza 1 Fax (301) 459 0056
2620 Albertslund lmprensa Nacional 4100 Zagreb Tit. 4:; 63 23 00 Casa da Moeda. EP Tel. (041) 430 392
Fax (Sales) 43 63 19 69 Rua D. Francisco Manuel de Melo, 5 CANADA Fax (Management) 43 63 19 49 1092 Lisboa Codex MAGY ARORSzAG
Tel. (01) 387 30 021385 83 25 Subscriptions only DEUTSCHLAND Fax (01) 384 01 32 Euro-Info-Service Uniquement abonnements
Bundesanzeiger Verlag Distribuidora de Livros Honved Europa Haz Renouf Publishing Co. Ltd Bertrand, Ld. • Margitsziget
Breite Straf3e 78-80 1138 Budapest 1294 Algoma Road
Postfach 10 05 34 Grupo Bertrand, SA Tel./Fax 1 111 60 61 Ottawa. Ontario K1B 3W8 50445 Kain Rua das Terras dos Vales. 4-A 1111 6216 Tel. (613) 741 43 33
Tel. (02 21) 20 29-0 Apartado 37 Fax (613) 741 54 39
Fax (02 21) 202 92 78 2700 Amadora Codex POLSKA Telex 0534783 Tel. (01) 49 59 050
GREECE/EMMA Telex 15798 BERDIS Business Foundation
Fax 49 60 255 ul. Krucza 38142 AUSTRALIA
G.C. Eleftheroudakis SA 00-512 Warszawa
International Bookstore UNITED KINGDOM Tel. (2) 621 99 93. 628·28·82 Hunter Publications Nik1s Street 4 International Fax&Phone SBA Gipps Street 10563 Athens HMSO Books (Agency section) (0-39) 12-00-77
Tel. (01) 322 63 23 HMSO Pubhcat1ons Centre Collingwood Victoria 3066 Telex 219410 ELEF 51 Nine Elms Lane ROMANIA Tel. (3) 417 5361
Fax 323 98 21 London SWB SOR Fax (3) 419 7154
Tel. (071) 873 9090 Euromedia
ESPANA Fax 873 8463 65. Strada Dionisie Lupu
Telex 29 71 138 70184 Bucuresti JAPAN Boletin Oficial del Estado Tel./Fax 1-31 29 646
Trafalgar. 27-29 OSTERREICH Kinokunlya Company Ltd
28071 Madrid
Manz'sche Verlags· RUSSIA
Tel. (91) 538 22 95 17-7 Shinjuku 3-Chome
Fax (91) 538 23 49 und Universitatsbuchhandlung CCEC Shinjuku-ku Kohlmarkt 16 9,60-letiya Oktyabrya Avenue Tokyo 16D-91 Mundi·Prensa Libros, SA 10t4 Wien 117312 Moscow Tel. (03) 3439-0121 Castell6. 37 Tel. (1) 531 610 Tel./Fax (095) 135 52 27
28001 Madrid Telex 112 500 BOX A Journal Department
Tel. (91) 431 33 99 (Libros) Fax (1) 531 61-181
PO Box 55 Chitose
431 32 22 (Suscnpciones) SLOVAKIA
Tokyo 156 435 36 37 (0irecci6n) SUOMl/FINLAND
Telex 49370-MPLl·E Slovak Technical Tel. (03) 3439-0124
Fax (91) 575 39 98 Akateeminen Kirjakauppa Library
Sucursal: Keskuskatu 1 Nm. slobody 19 SOUTH-EAST ASIA
POBox218 812 23 Bratislava 1 Libreria Internacional AEDOS 00381 Helsinki Tel. (7) 5220 452
Consejo de Ciento. 391 Tel. (0) 121 41 Fax : (7) 5295 785 Legal library Services Ltd
08009 Barcelona Fax (0) 121 44 41 Orchard
Tel. (93) 488 34 92 CYPRUS PO Box 05523
Fax (93) 487 76 59 NORGE
Cyprus Chamber of Commerce and Singapore 9123 Tel. 73 04 24 1 Llibreria de la Generalitat Narvesen Info Center Industry Fax 24 32 47 9 de Catalunya
Bertrand Narvesens vei 2 Chamber Building Rambla dels Estudis. 118 (Palau Mo1a) PO Box 6125 Etterstad 38 Grivas Dh~enis Ave
08002 Barcelona 0602 Oslo6 3 Deligiorgis treet SOUTH AFRICA Tel. (93) 302 68 35 Tel. (22) 57 33 00 PO Box 1455
Tel. (93) 302 64 62 Telex 79668 NIC N Nicosia
Saito Fax (93) 302 12 99 Fax (22) 68 19 01 Tel. (2) 449500/462312
Fax(2)458630 5th Floor, Export House
FRANCE SVERIGE Cnr Maude & West Streets
Sandton 2146 MALTA
Journal officiel BTJAB Tel. (011) 883-3737
Service des publications Traktorvgen 13 Miller distributors Ltd Fax (011) 883-6569 des Communautes europeennes 22100 Lund POBox25
26. rue Desaix Tel. (046) 18 00 00 Maha International Airport
AUTRESPAYS 75727 Paris Cedex 15 Fax (046) 18 01 25 LOA05Malta
Tel. (1) 40 58 77 01/31 30 7947 Tel. 6644 88 OTHER COUNTRIES
Fax (1) 40 58 77 00 Fax 67 67 99 ANDERE LANDER
ICELAND
TURKIYE Office des publications officielles IRELAND
BO KA BUD des Communautes europeennes
Government Supplies Agency LARUSAR BLONDAL Pres AS 2. rue Mercier 4-5 Harcourt Road Sk61av6rdustig. 2 lstiklal Caddesi 469 2985 Luxembourg Dublin2 101 Reykjavik 80050 TOnel-lstanbul Tel. 499 28-1
Tel. (1) 6613111 Tel.115650 Tel. 0(212) 252 8141·251 91 96 Telex PUBOF LU 1324 b Fax (1) 47 80 645 Fax 12 55 60 Fax 0(212) 251 91 97 Fax 48 85 73148 68 17
...
... *
. !e.
. .
...
Price (excl. VAT) in Luxembourg: Single copy ECU 8 •Subscription ECU 73
OFICINA DE PUBLICACIONES OFICIALES DE LAS COMUNIDADES EUROPEAS KONTORET FOR DE EUROP~ISKE FA:LLESSKABERS OFFICIELLE PUBLIKA TIONER AMT FUR AMTLICHE VEAOFFENTLICHUNGEN DEA EUAOPAISCHEN GEMEINSCHAFTEN YnHPEIIA EnlIHMON EKAOIEON TON EYPOnAiKON KOINOTHTON
OFFICE FOR OFFICIAL PUBLICATIONS OF THE EUROPEAN COMMUNITIES OFFICE DES PUBLICATIONS OFFICIELLES DES COMMUNAUTES EUAOPEENNES UFFICIO DELLE PUBBLICAZIONI UFFICIALI DELLE COMUNITA EUAOPEE BUREAU VOOR OFFICIELE PUBLIKA TIES DEA EUAOPESE GEMEENSCHAPPEN SEAVICO DAS PUBLICAc0ES OFICIAIS OAS COMUNIDAOES EUAOPEIAS