BLUETOOTH BASED HEALTH MONITORING DEVICE
TAN KIEN LEONG
BLUETOOTH BASED HEALTH MONITORING DEVICE
TAN KIEN LEONG
This report submitted in partial fulfillment of the requirements for the award of Bachelor of Electronic Engineering (Telecommunications Electronics) With
Honours
Faculty of Electronics and Computer Engineering Universiti Teknikal Malaysia Melaka
v
DEDICATION
Special dedication to my beloved parents, Tan Sea Eng & Ooi Hor Tiew
To my supervisor
Dr Wira Hidayat Bin Mohd Saad
My friends and my fellow lecturers
vi
ACKNOWLEDGMENT
vii
ABSTRACT
viii
ABSTRAK
ix
TABLE OF CONTENTS
CHAPTER CONTENT PAGES
TITLE i
REPORT STATUS VERIFICATION FORM ii
DECLARATION iii APPROVAL iv DEDICATION v
ACKNOWLEDGMENT vi ABSTRACT vii
ABSTRAK viii
TABLE OF CONTENTS ix
LIST OF FIGURES xii
LIST OF TABLES xiv
LIST OF ABBREVIATIONS xv
LIST OF APPENDICES xvi
I INTRODUCTIONS
1.1 INTRODUCTION 1
1.2 PROJECT OBJECTIVES 2
1.3 PROBLEM STATEMENT 2
1.4 SCOPE OF WORK 3
x
II LITERATURE REVIEW
2.1 HEART RATE 4
2.2 HUMAN BODY TEMPERATURE 6
2.2.1 SPECIFIC TEMPERATURE CONCEPTS 7
2.3 HEART RATE SENSOR 7
2.4THERMISTOR 8
2.5 BLUNO MICROCONTROLLER 9
2.5.1 SPECIFICATION 10
2.6BLUETOOTH 11
2.6.1CLASSICAL BLUETOOTH 11
2.6.2 BLUETOOTH LOW ENERGY 11
2.7RELATED RESEARCH 14
III METHODOLOGY
3.1 METHODOLOGY 19
3.2 DESIGNING ALGORITHM FOR HEART RATE SENSOR 21 3.3 DESIGNING ALGORITHM FOR BODY TEMPERATURE
SENSOR 26
3.4 PROCEDURES TO ESTABLISH CONNECTION
BETWEEN BLUNO AND PC 29
3.5 DESIGNING ALGORITHM FOR BLUNO TO READ
DATA FROM SENSORS AND SEND DATA TO PC 32 3.6 DESIGNING ALGORITHM FOR DATA TRANSFER
BETWEEN WINDOWS APPS AND BLUNO 35
3.7 PROCEDURES TO DISPLAY IMAGE ON WINDOWS
APPS 39
xi
IV RESULT & DISCUSSION
4.1 HARDWARE & SOFTWARE LAYOUT 43
4.2 WINDOWS APPS DATA VERIFICATION BY USING
SERIAL MONITOR IN ARDUINO IDE 47
4.3 HEART RATE & BODY TEMPERATURE VALUES FOR
FIVE PERSONS 48
V CONCLUSION
5.1 CONCLUSION 50
5.2 SUSTAINABLE DEVELOPMENT 51
5.3 COMMERCIALIZATION 51
5.4 FUTURE WORK 51
REFERENCE 52
xii
LIST OF FIGURE
Figure 2.1: PPG waveform 5
Figure 2.2: Autonomic physiological mechanisms 6
Figure 2.3: LED and photo-detector diode position for transmission and
reflectance mode photoplethysmography (PPG) 8
Figure 2.4: Different kind of thermistor 9
Figure 2.5: Pinout of Bluno board 10
Figure 2.6: Bluetooth low energy protocol stack 13
Figure 2.7: Block diagram of button system 14
Figure 2.8: Block diagram of sensor interface 15
Figure 2.9: Block diagram of Low Cost Patient Monitoring Device 16
Figure 2.10: Block diagram of Medicare System 17
Figure 2.11: Block diagram of PIC microcontroller-based RF wireless ECG
monitoring system 17
Figure 3.1: Project workflow 21
Figure 3.2: Flow chart for designing algorithm for heart rate sensor 22 Figure 3.3: Circuit connection for heart rate sensor 23 Figure 3.4: Flow chart for designing algorithm for body temperature sensor 27 Figure 3.5: Schematic diagram for body temperature sensor circuit 27
Figure 3.6: Bluno version 1.6 29
Figure 3.7: Flow chart for update BLE firmware on Bluno 31
Figure 3.8: Layout of DFRobot blunoFWDownloader 31
xiii
Figure 3.10: Flow chart for designing algorithm for Bluno 33 Figure 3.11: Flow chart for data transfer between Windows Apps and Bluno 35
Figure 3.12: Data binding technique 39
Figure 3.13: Image control 40
Figure 3.14: Steps to import image 40
Figure 3.15: List of images stored in Assets folder 41 Figure 3.16: Select image file to be displayed on screen 41 Figure 3.17: Body temperature sensor circuit in Proteus layout 42
Figure 4.1: Health monitoring device 44
Figure 4.2: Windows Apps for health monitoring device 44
Figure 4.3: Detect Bluno board 45
Figure 4.4: Bluno is connected with Windows Apps 45
Figure 4.5: Hold the sensors 46
Figure 4.6: Body temperature sensor 46
Figure 4.7: Heart rate sensor 47
xiv
LIST OF TABLES
Table 2.1: Specifications of heart rate sensor 8
xv
LIST OF ABBREVIATIONS
ECG - Electrocardiogram
ADC - Analog to Digital Conversion
BLE - Bluetooth Low Energy
xvi
LIST OF APPENDICES
APPENDIX TITLE PAGES
A Coding For BLUNO 55
B Coding For Heart Rate Sensor 57
C Coding For Body Temperature Sensor 60
1
CHAPTER I
INTRODUCTION
1.1 Introduction
In the last decade, portable health monitoring devices have increased a lot of interest from the medical industry and the research community as it is gaining interest by the enormous research and development works [1], [3]. Due to development in sensor technology and wireless communication systems, it provides opportunities for researchers to innovate health monitoring systems which can improve quality of life for individuals [3].
2
one would accepted and used only if the monitoring system is tiny and lightweight, as this would not cause any inconvenience for the users and their daily activities [3-4]. Various types of prototypes and commercial products which are able to measure several types of body‟s vital-sign have been introduced to cater this demand. Decrease in power consumption, device dimension, and production cost, make it potential for integrating them into clothing or small apparel items which intent to providing real-time feedback information about one‟s health condition [1], [3]. These feedback information will be sent to the user himself or to a medical center through WiFi, Bluetooth or etc. so that user is being warned of potential health threatening circumstances [1].
1.2 Problem statement
A portable health monitoring device contains few sensors to monitor human body‟s vital sign. Combining various sensors into a device will increase the weight and dimension of that device. This will cause an uncomfortable feeling to the user due to its bulky size. A device interface needs to be created on computer to process and display the data sent by health monitoring device.
1.3 Objective of project
The aim of this study is to develop the portable Bluetooth based device to logging the data from several different sensors for health monitoring related application. In order to achieve this, some of the objectives need to be accomplished. 1. To design the portable devices using BLUNO microcontroller with pulse rate
sensor and thermistor.
3
1.4 Scope of project
A working prototype and device interface program will be produced at the end of this project. The health monitoring device consists of pulse sensor, body temperature sensor, and BLUNO microcontroller will be used. The device interface program will displays the heart rate (measured in beats per minute) and body temperature (measured in degree Celsius). In this study, the device interface program only been tested on Windows 8 or Window 8.1 operating platform, others operating platform like Windows phone and tablet are not tested.
1.5 Chapter Review
Chapter 1 describes the general overview of this project. This chapter presents the problem statement, objectives, scope of project and review of all chapters of this thesis. Chapter 2 discusses the previous work and sensors that been used in this project. The Bluetooth technology is also discussed in this chapter.
4
CHAPTER II
LITERATURE REVIEW
In this chapter, it describes the findings of a literature review of the project. Overall, it covers related research for health monitoring device. This chapter starts with the basic concept of heart rate and body temperature. Basic understanding on heart rate and body temperature is essential to control on how the bio-sensors measured data from the human body. Next, the basic operation of pulse rate sensor and thermistor will be discussed. Lastly, a few past related studies are presented at the end of this chapter.
2.1 Heart Rate
5
branches, and Purkinje fibre network, to the rest of the heart. This process known as the cardiac cycle will repeat itself throughout the life of an organism with a high level of efficiency [17].
[image:22.595.114.526.419.541.2]There is a pulse wave propagated along all arteries to every appendage of capillary tissue when the heart circulates blood through the human body. The pulse wave travels faster than the speed of the blood circulates in the human body. Figure 2.1 shows the PPG waveform. When there is a pulse exists, the signal will rise rapidly and then falls back down to normal point when the pulse had gone. Usually the signal settles down to background noise although sometimes the dichroic notch is more noticeable than others before the next pulse wave. The heart rate is measured by calculating the duration between each peak since it is a repeating and predictable pulse wave. Any recognizable part of the pulse wave can be chosen as a reference point and usually peak of the pulse wave is chosen. Different researchers have their own definitions to define a pulse signal that exists. Some of them claim the signal exists when the signal rises to 25% or 50% of the amplitude, and some say it occurs when the gradient is steepest during the upward rise event [18].
6
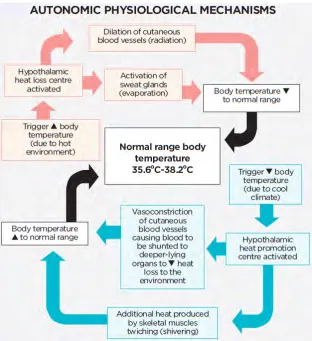
2.2 Human Body Temperature
[image:23.595.163.476.399.741.2]Normothermia or euthermia is the scientific term for normal human body temperature. It is a concept that the measurement is taken on different location of the human body and degree of activity of the person. Different parts of the human body will show different temperature value and thus there is no single number that represents a normal temperature for all people under all conditions. Skin temperature measurements are slightly lower than oral measurements, and oral measurement is fairly lower than rectal measurements [20]. The ability to detect and adjust body temperature is a key feature for human to survive. Physiological damages and fatality will occur when there is a differences of ± 3.5°C from the resting temperature of 37°C. There are few intrinsic factors that affect human body temperature, for example: ovulation, circadian rhythm, age, exercise, and thyroid hormones [22]. Figure 2.2 shows the flow chart for autonomic physiological mechanisms.
7
2.2.1 Specific temperature concepts
Hypothermia is a condition where the human body temperature decreases until to a point below that needed for bodily function and normal metabolism. This happened due to the human body over exposure to cold water or air for a long period of time. Symptoms will occur when the body temperature decreases by 1°C to 2 °C below normal temperature [20].
Fever is an increase in temperature more than 38°C and is a normal response to infectious disease, inflammation or drug treatment [22]. Afebrile or apyrexic, meaning "without fever" is a condition where an organism at optimum temperature. If the temperature is increased, but the reference point is not increased, then the consequence is hyperthermia [20].
Hyperthermia happens when a human body cannot dissipate heat that overproduces or absorbs. It is normally due to exposure to high surrounding temperatures for a long period of time. The heat-regulating mechanisms of the human body finally become unable to handle effectively with the heat, thus causing the human body temperature to rise out of control [20].
2.3 Heart Rate Sensor
![Figure 2.1: PPG waveform [18].](https://thumb-us.123doks.com/thumbv2/123dok_us/137570.14714/22.595.114.526.419.541/figure-ppg-waveform.webp)