Lithium-Oxygen Batteries
Thesis by
Dylan D. Tozier
In Partial Fulfillment of the Requirements for the
Degree of
Doctor of Philosophy
CALIFORNIA INSTITUTE OF TECHNOLOGY
Pasadena, California
2018
© 2018
Dylan D. Tozier
ORCID: 0000-0001-9489-8824
ACKNOWLEDGEMENTS
Just over seven years ago I somehow stumbled into Prof Ajayan’s lab at Rice
University. I had never even considered going to grad school, but my time in his
lab working with Akshay Mathkar sent me down the path to Caltech. Throughout
this time, I’ve met some extraordinary people, my advisor Julia being one of them.
I admire your infectious enthusiasm, and you’ve made doing research at Caltech a
wonderful experience. To the rest of the Greer Group, I am always amazed by how
you can be both so good at science and so much fun. I couldn’t have asked for better
group members. To everyone over at Liox, you have been fantastic collaborators
and like a second group to me. I’ve learned so much from you all, and I can’t
believe how lucky I was to get to work as closely with you as I did. To the many
other amazing people I have had the pleasure to work with, Betar, Carol, Nathan,
and others I’m sure I am leaving out, I appreciate how generous you were with your
time. It’s people like you who make Caltech the great place that it is. To all the
current and former members of Steuben House, thank you for the good times. It’s
been like coming home to family, and I would be hard pressed to find a better group
of people to live with. To Patricia, thanks for putting up with me all these years. I
guess this means it’s your turn to go to grad school. And finally, to my parents who
have encouraged and supported me every step of the way, it’s hard to believe that the
last time I wasn’t a student, you were making homework for me to do with Garrett
so I wouldn’t feel left out. I guess I’m finally finished. Mom and Dad, thanks for
ABSTRACT
State of the art commercial lithium ion batteries use cathodes such as lithium cobalt
oxide which rely on insertion and removal of lithium ions from a host material.
However, insertion cathode materials are limited in their capacity, and replacing
them with a cathode that employs growth and dissolution of new phases could
significantly increase a battery’s energy density. For example, oxygen and sulfur
cathodes have been widely researched to this end, with both cases involving the
growth of a lithium-rich compound on a current collector/catalyst support.
We begin by describing the effect of using a molten salt electrolyte in a
lithium-oxygen battery. In particular, we focus on how the electrochemical performance
and discharge product, lithium peroxide, differ from that of a traditional organic
electrolyte. In addition, we discuss the enhanced peroxide solubility in a molten salt
and its implications for lithium peroxide growth and coulombic efficiency. Finally,
we address the cell death of a galvanostatically cycled battery.
We then introduce a similar phase-forming conversion chemistry, whereby a molten
nitrate salt serves as both an active material and the electrolyte. Molten nitrate salts
were previously studied as an active material in a primary lithium battery where
lithium oxide irreversibly forms as nitrate reduces to nitrite. We will describe how
the use of a nanoparticle heterogeneous catalyst allows the reversible growth and
dissolution of micron-scale lithium oxide crystals in this system.
After introducing these molten salt lithium batteries, we address the effect of cathode
geometry on electrochemical performance. In particular, we note that the growth of
such large, solid phase species on the surface of the catalyst support imposes new
design restrictions when optimizing a cathode for energy density. As a proof of
concept, we design and implement an architected electrode with large pore volume
and relatively small surface area, comparing it with the more typical geometries of
PUBLISHED CONTENT AND CONTRIBUTIONS
1. Giordani, V., Tozier, D., Tan, H., Burke, C. M., Gallant, B. M., Uddin, J., Greer, J. R., McCloskey, B. D., Chase, G. V. & Addison, D. A Molten Salt Lithium-Oxygen Battery.Journal of the American Chemical Society 138,2656–2663. doi: 10.1021/jacs.5b11744 (2016).
D. Tozier assisted with battery assembly and electrochemical analysis, per-formed the ex situ characterization, and participated in the writing of the manuscript.
2. Addison, D., Tozier, D., Tan, H., Uddin, J., Gallant, B. M., McCloskey, B. D., Greer, J. R., Chase, G. V. & Giordani, V. A New Rechargeable Battery: Lithium Oxide Growth through Molten Salt Nitrate Reduction.(In Preparation). D. Tozier assisted with battery assembly and electrochemical analysis, per-formed the ex situ characterization, and wrote much of the manuscript.
3. Tozier, D., Giordani, V., Chase, G. V., Addison, D. & Greer, J. R. The Role of Battery Cathode Architecture in Conversion Reaction Chemistries.(In
Prepa-ration).
TABLE OF CONTENTS
Acknowledgements . . . iii
Abstract . . . iv
Published Content and Contributions . . . v
Table of Contents . . . vi
List of Illustrations . . . vii
List of Tables . . . ix
Chapter I: Introduction . . . 1
1.1 A Brief History of Batteries . . . 1
1.2 The Lithium-Oxygen Battery . . . 4
1.3 Thesis Overview . . . 10
Chapter II: A Molten Salt Lithium-Oxygen Battery . . . 11
2.1 Molten Salt Electrolytes . . . 12
2.2 Oxygen Electrochemistry in a Molten Salt . . . 13
2.3 Lithium Peroxide and Wulff Constructions . . . 18
2.4 Battery Cycling Performance and Cell Death . . . 26
2.5 Summary . . . 28
Chapter III: A Nitrate Reduction Battery . . . 30
3.1 Nitrate Reduction Chemistry . . . 31
3.2 Catalysis of Nitrite Oxidation . . . 33
3.3 Lithium Oxide as a Discharge Product . . . 37
3.4 Nitrate to Nitrite and Back Again . . . 42
3.5 Battery Cycling Performance . . . 45
3.6 Summary . . . 46
Chapter IV: Role of Cathode Architecture in Conversion Reaction Chemistries 48 4.1 Capacity Limitations . . . 49
4.2 Fabrication of Architected Electrodes . . . 53
4.3 Electrochemical Surface Area of Nickel Electrodes . . . 57
4.4 Performance of Architected Electrodes . . . 62
4.5 Commercial Foam Electrode Comparison . . . 66
4.6 Summary . . . 71
Chapter V: Summary and Outlook . . . 72
Bibliography . . . 74
Appendix A: Detailed Cell Construction . . . 82
Appendix B: Ion Exchange Chromatography Calibration and Calculation . . . 85
Appendix C: Nanoscribe Speed Optimization . . . 88
LIST OF ILLUSTRATIONS
Number Page
1.1 Lithium-ion battery schematic . . . 3
1.2 Lithium-oxygen battery schematic . . . 5
1.3 Typical lithium-oxygen first cycle . . . 6
1.4 Typical morphologies of Li2O2 . . . 7
1.5 Growth mechanisms of Li2O2 . . . 8
1.6 Gutmann acceptor and donor number of solvents . . . 9
2.1 Cyclic voltammetry of oxygen reduction and evolution . . . 14
2.2 Galvanostatic cycling of oxygen reduction and evolution . . . 16
2.3 Mass spectrometry of lithium-oxygen charge process . . . 18
2.4 X-ray diffraction of lithium-oxygen cathode across one cycle . . . 19
2.5 Wulff construction schematic . . . 20
2.6 Wulff construction of Li2O2 . . . 21
2.7 Morphology of oxygen cathode discharge product . . . 22
2.8 Elemental map of oxygen cathode discharge product . . . 23
2.9 Elemental map of oxygen cathode after full cycle . . . 23
2.10 Linear sweep voltammograms of Li2O2oxidation . . . 25
2.11 Cycling behavior of lithium-oxygen battery . . . 26
2.12 X-ray diffraction of cycled lithium-oxygen battery . . . 27
2.13 Scanning electron microscopy of cycled lithium-oxygen battery . . . 27
3.1 Nitrate reduction first cycle on a Super P carbon cathode . . . 32
3.2 Nitrate reduction schematic . . . 32
3.3 Catalysis comparison for nitrate reduction reversibility . . . 33
3.4 Galvanostatic intermittent titration technique of nitrate reduction . . . 34
3.5 X-ray photoelectron spectroscopy of nickel nanoparticles . . . 35
3.6 Transmission electron microscopy of nickel nanoparticles . . . 36
3.7 Lithium-doped nickel oxide as a catalyst . . . 38
3.8 X-ray diffraction of nitrate reduction cathode across one cycle . . . . 39
3.9 Transmission electron microscopy of nitrate reduction cathode . . . . 39
3.10 Morphology of nitrate reduction cathode discharge product . . . 40
3.11 Elemental map of nitrate reduction cathode discharge product . . . . 41
3.13 Charging profile of newly constructed cells preloaded with Li2O . . . 43
3.14 Ion exchange chromatography of nitrate/nitrite solution . . . 45
3.15 Cycling behavior of nitrate reduction battery . . . 46
4.1 Surface of fully discharge cathodes . . . 51
4.2 Example structured nickel electrodes . . . 52
4.3 Model of lattice electrode unit . . . 54
4.4 Fabrication of polymer lattice . . . 55
4.5 Sputtered nickel film coating a polymer lattice . . . 56
4.6 Nickel lattice electrode . . . 57
4.7 Surface electrochemistry of nickel . . . 58
4.8 Electrochemical surface area of sputtered nickel . . . 60
4.9 Electrochemical surface area of lattice electrode . . . 61
4.10 Cyclic voltammetry of nitrate reduction on different cathodes . . . . 62
4.11 Galvanostatic discharge of nitrate reduction on different cathodes . . 64
4.12 Nitrate reduction discharge product on lattice electrode . . . 64
4.13 Foam electrode morphologies . . . 67
4.14 Cyclic voltammetry of nitrate reduction on foam cathodes . . . 68
4.15 Galvanostatic discharge of nitrate reduction on foam cathodes . . . . 69
A.1 Picture of Swagelok cell . . . 83
B.1 Ion exchange chromatography nitrate calibration scans . . . 85
C.1 Nanoscribe parameter sweep . . . 89
D.1 Wettability of lattice electrode . . . 91
LIST OF TABLES
Number Page
1.1 Theoretical energy density of batteries . . . 4
2.1 Molten salt electrolyte compositions . . . 13
4.1 Acid bath for nickel surface cleaning . . . 59
4.2 Normalized discharge capacity of nitrate reduction on different cathodes 65
C h a p t e r 1
INTRODUCTION
The ability to store energy and release it as needed plays a surprisingly important
role in our lives, so much so that we often forget how integral energy storage has
become to a modern lifestyle. For instance, this thesis is written on a laptop, a
device that is only possible due to significant advancements in battery technology
over the course of decades. And as the performance of batteries has grown over
the years, so too has the range of applications where they can play a part. While
today it may seem inevitable that electric vehicles are set to replace their gasoline
counterparts as automakers announce electrified lineups and countries announce
electrification goals[1], it is easy to forget that just 10 years ago Tesla released their
first electric vehicle to a skeptical public. Such a dramatic change in perspective
is largely thanks to the precipitous drop in battery prices over that time period[2].
Along a similar vein, renewable energy sources such as wind and solar have begun to
provide a significant portion of the power in our electric grid, but their intermittency
has created a need for large scale, cheap energy storage. We are already seeing
batteries begin to play a role in this space, and the improvement of existing battery
chemistries and development of new ones will only see their part grow. Between
consumer electronics, electric vehicles, grid storage, and many more, the range of
applications for batteries, in addition to the demands on them, is only growing.
The scope of this thesis is dedicated to understanding some of these new battery
chemistries, but to fully do so, it is instructive to look back at how we got to where
we are today.
1.1 A Brief History of Batteries
For the purposes of this thesis, it is best to divide the history of batteries into
three simple categories: before, during, and after lithium-ion batteries. As this is
a brief history, many chemistries will be overlooked. A commonality across all of
these battery chemistries is that the underlying physics is the same: an electrolyte
separates two electrodes where redox reactions occur, one an oxidation and the
other a reduction, and the difference in reduction potential of the two reactions is
Before Lithium-Ion
The first true battery was invented in 1800 by Alessandro Volta, after whom the
unit Volt is named[3]. While electrochemistry was not understood at the time, his
voltaic stack was a true electrochemical cell consisting of zinc and copper electrodes
separated by a sulfuric acid electrolyte, giving the half cell reactions of Equation
1.1.
Zn+SO2−
4 → ZnSO4+2e −
(1.1a)
2H++2e− → H2 (1.1b)
Similar batteries were used through much of the 1800s until the development of the
lead-acid battery, the first rechargeable battery, in 1859[4]. The ability to reuse these
batteries led to an expanded range of applications for batteries, and the lead-acid
chemistry is still widely used today.
After the development of the lead-acid battery, many other primary and reversible
chemistries came into use, including zinc-carbon, nickel-cadmium, alkaline, and
nickel-metal hydride to name a few. However, a battery with larger energy density
was desired, and lithium became a heavily researched battery constituent due to its
low atomic mass and reduction potential. While lithium batteries were
commercial-ized as primary batteries, developing a reversible chemistry proved challenging.
The Lithium-Ion Battery
Beginning in the 1970s, several groups performed the work necessary to develop
the lithium-ion battery, with Stanley Whittingham demonstrating the reversible
intercalation of lithium[5, 6], John Goodenough the LiCoO2cathode[7], and Rachid
Yazami the reversible intercalation of lithium into a graphite anode[8]. Building
off of these works, Sony was able to commercialize the lithium-ion battery in 1991,
first with a hard carbon anode, and later a graphite one.
The operation of the lithium-ion battery is significantly different than the
recharge-able batteries that preceded it. Both electrodes employ a lithium intercalation
mechanism, a process by which lithium ions reversibly enter and exit a host crystal
structure. Typical positive electrodes are transition metal oxides such as LiCoO2
and LiFePO4[9], and the typical negative electrode is a carbon such as graphite or
amorphous carbon. Because the reduction potential of lithium insertion into these
carbons is close to that of lithium (ca. 0.2 V vs Li/Li+) and the reduction potential
Li/Li+, the cell potential is far too large to use an aqueous electrolyte. As a result,
an organic electrolyte such as a mixture of lithium hexafluorophosphate salt in an
ethylene carbonate and diethyl carbonate solution (LiPF6in EC/DEC) is used[10].
A schematic of the discharge process in such a lithium-ion battery is shown in Figure
1.1, with the lithium ions leaving the host structure of the negative electrode and
entering the host structure of the positive electrode, and the charge process sees the
reverse happen.
Figure 1.1: Lithium-ion battery schematic. Adapted from [10].
The lithium-ion chemistry makes a compelling battery for several reasons, but chief
among them is its achievable energy density. Since its implementation in 1991,
many new transition metal oxides cathodes (LMO, NMC, and NCA to name a few)
have been developed, allowing this energy density to continue to grow. The capacity
of a typical graphite anode is ca. 300 mAh/g, and that of a typical transition metal
oxide is approaching 200 mAh/g, allowing a real full cell energy density over 250
Wh/kg[11]. This is an impressive value, considering that the first Sony lithium-ion
battery in 1991 achieved an 80 Wh/kg energy density[12]. There is still plenty of
rich work being done to continue improving the lithium-ion battery, such as the
implementation of silicon anodes[13], 5 V cathodes[14], and lithium-rich transition
metal oxide cathodes[15].
Beyond Lithium-Ion
While the progress in lithium-ion batteries has been quite impressive over the last
couple decades, there is still a desire for larger energy density, cheaper, and safer
batteries. As a result, research groups have looked beyond the typical intercalation
chemistries of the lithium-ion battery. This can take many forms: replacing the
elec-trolyte with an aqueous or solid one, replacing the transition metal oxide cathode
with a conversion reaction chemistry, or moving away from lithium altogether,
re-placing it with a cheaper or multivalent ion. Each of these options is a field in
its own right. This thesis will focus on chemistries that replace the intercalation
based transition metal oxide cathode with one that does not require a host structure
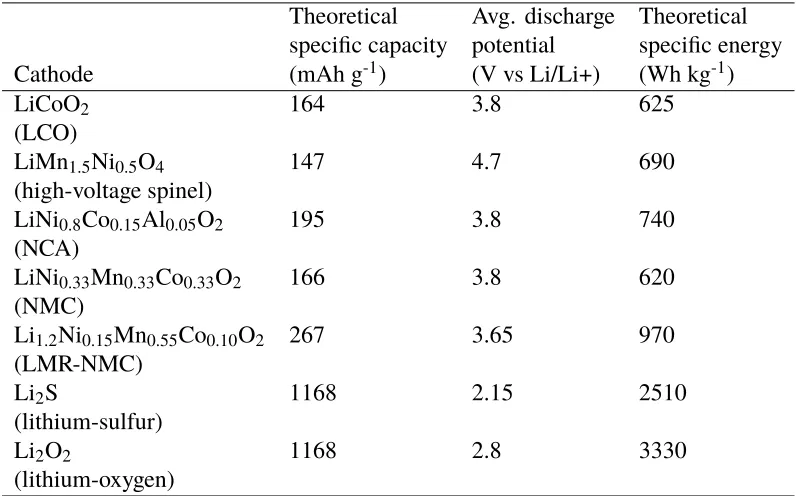
for lithium, and Table 1.1 compares the theoretical energy density of current and
future intercalation cathodes with two of the more prominent "beyond lithium-ion"
cathode chemistries. By removing the mass of the host intercalation structure, far
higher theoretical energy densities can be achieved.
Theoretical Avg. discharge Theoretical specific capacity potential specific energy
Cathode (mAh g-1) (V vs Li/Li+) (Wh kg-1)
LiCoO2 164 3.8 625
(LCO)
LiMn1.5Ni0.5O4 147 4.7 690
(high-voltage spinel)
LiNi0.8Co0.15Al0.05O2 195 3.8 740
(NCA)
LiNi0.33Mn0.33Co0.33O2 166 3.8 620
(NMC)
Li1.2Ni0.15Mn0.55Co0.10O2 267 3.65 970 (LMR-NMC)
Li2S 1168 2.15 2510
(lithium-sulfur)
Li2O2 1168 2.8 3330
[image:13.612.107.505.254.502.2](lithium-oxygen)
Table 1.1: Theoretical energy density of batteries, as paired with a lithium metal anode. Adapted from [16].
1.2 The Lithium-Oxygen Battery
The large theoretical energy density of lithium-oxygen batteries makes them an
attractive candidate for research, because if even a small fraction of that theoretical
value were practically realized, it would compete well with state of the art
lithium-ion chemistries. The first demonstratlithium-ion of the lithium-oxygen battery chemistry
was in 1996[17], and it has been well studied since, leading to a good understanding
Oxygen as a Cathode
When using oxygen as a cathode, the discharged state of the battery is less clear than
it is for a well structured intercalation one. For instance, one might imagine that
lithium oxide (Li2O) is the discharged state. And this would be a good thing, as each
mole of oxygen gas could host 4 moles of lithium. However, as suggested by Table
1.1, the discharged state is in fact lithium peroxide (Li2O2), giving 2 moles lithium
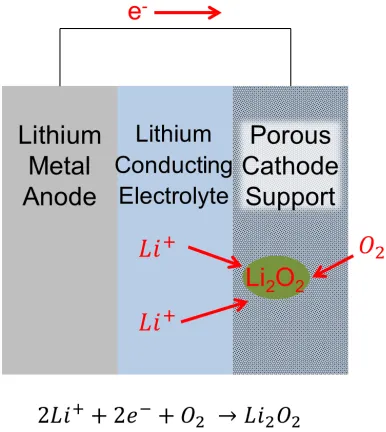
for each mole oxygen. Figure 1.2 is a simple schematic describing this discharge
process when paired with a lithium metal anode (as is typical in lithium-oxygen
[image:14.612.206.399.251.467.2]research).
Figure 1.2: Lithium-oxygen battery schematic.
Note that a porous cathodic current collector, often a high surface area carbon, must
support the growth of the discharge product while also allowing diffusion of oxygen
from the gas phase to the electrode surface. In addition, this simple schematic
obfuscates the complex process of bringing together two lithium ions and an oxygen
molecule to the surface of the electrode where a two electron redox process must
take place. Due to this complexity, the possibility of a one step reaction is untenable,
and Equation 1.2 describes the generally accepted series of reactions[18].
O2+e− →O−
2 (1.2a)
O−2 +Li+ → LiO2 (1.2b)
Unlike the three step oxygen reduction reaction (ORR) on discharge, the oxygen
evolution reaction (OER) on charge is a single step evolution of oxygen. Regardless
of the reaction steps, the thermodynamic standard potential for the overall reaction
of Equation 1.2 is 2.96 V[19]. However, when performing this chemistry in an
actual battery, there is typically a significant overpotential on both discharge and
charge. Figure 1.3 shows the first cycle of lithium-oxygen batteries with different
carbons serving as the cathodic current collector.
Figure 1.3: Typical lithium-oxygen first cycle. 0.1 mA cm-2. Adapted from [20].
This large overpotential suggests a few things: the mechanism of Li2O2growth on
discharge and dissolution on charge is probably complicated; the wide operating
potential window both reduces the round-trip energy efficiency of the battery and
lends the system to unwanted side reactions; and an effective catalyst for the reaction,
or some other mechanism of reducing the overpotential, is necessary for the
lithium-oxygen battery to be a successful secondary battery.
Lithium Peroxide Growth Mechanisms
While Equation 1.2 describes the chemistry involved in forming Li2O2, it does not
address how it is supported by the cathodic current collector. In particular, it gives
no understanding of the morphology of Li2O2as it grows, the mechanism of Li2O2
growth, or the relationship between this morphology and the performance of the
battery. There are a wide range of morphologies reported throughout literature[21–
23], and Figure 1.4 gives a few typical examples of them.
It is worth noting that Li2O2 is insulating, so one would expect the thin film
Figure 1.4: Typical morphologies of Li2O2. (A) Thin film (scale bar: 300 nm), (B) platelet (scale bar: 1 µm), and (C) toroid (scale bar: 300 nm). Adapted from [24], [25], and [26], respectively.
electrode once an insulating layer has formed. However, other morphologies are
also observed, including "toroid" structures on the scale of a micron, and the growth
of these larger particles should significantly increase the amount of Li2O2hosted by
the cathode, in turn increasing the battery’s capacity. If all the chemical reactions in
Equation 1.2 happened at the surface of the electrode, this morphology would not be
possible. This curious observation of large, electrochemically grown, yet insulating
crystals was difficult to explain until the recent development of more detailed growth
mechanisms[25, 27].
A schematic detailing the two potential growth mechanisms of Li2O2 is shown in
Figure 1.5. In the surface growth mechanism, the first two steps of Equation 1.2
occur on the surface of the electrode, with a second reduction reaction then taking
place at the electrode. Since the entire ORR takes place on the electrode surface,
electrons must tunnel through any insulating Li2O2 already present, resulting in a
film thickness no larger than about 5-10 nm[28]. In the solution mediated growth
mechanism, the first two steps of Equation 1.2 also take place on the surface of
the electrode. However, here the intermediate species, lithium superoxide (LiO2),
is at least sparingly soluble in the electrolyte, and as a result, the
disproportiona-tion reacdisproportiona-tion can take place away from the electrode surface. This allows the final
step in Equation 1.2 to occur in a location which does not have access to an
elec-tron, therefore enabling the growth of micron scale insulating particles through an
electrochemical process.
Then the Li2O2growth mechanism is dictated by the electrolyte, namely how well
the electrolyte can solvate the LiO2 intermediate species. In other words, the
Figure 1.5: Growth mechanisms of Li2O2. Adapted from [25].
mechanism occurs. A quantitative measure of this can be given by the Gutmann
acceptor and donor numbers, which essentially dictate how well a solvent can
donate or accept electrons[29]. Figure 1.6 gives the acceptor and donor numbers for
some commonly used lithium-oxygen electrolyte solvents such as dimethoxyethane
(DME) and dimethyl sulfoxide (DMSO) as well as impurities such as water. When
using DME as an electrolyte solvent, the surface growth mechanism takes place
and the capacity is poor, but when using DMSO or having a water impurity in
DME, the solution mediated growth mechanism predominates and the capacity is
far greater[27]. This suggests that finding an electrolyte with large acceptor and
donor numbers would increase the solvation of LiO2, and thus give an even larger
discharge capacity.
An interesting result of the importance of LiO2 solvation is the role that a trace
amount of water can play in the electrolyte[30]. Increasing the water content from
an anhydrous rated <4ppm concentration to 1000ppm can increase the discharge
capacity by a factor of 10[31]. While this water impurity can act as an enabler of
the solution mediated growth process, it also can serve as an example of the role
that side reactions can play in the lithium-oxygen chemistry. In a similar approach,
researchers have attempted using soluble catalysts, known as redox mediators, to
encourage solution mediated growth without requiring solvation of LiO2[32, 33].
Instability and Side Reactions
As with any secondary battery chemistry, the ability to reversibly cycle a
lithium-oxygen battery is predicated on avoiding side reactions that consume active parts of
Figure 1.6: Gutmann acceptor and donor number of solvents. Free energy of LiO2 dissolution, relative to DME. Adapted from [25].
batteries allowed the formation of a stable solid electrolyte interphase (SEI) on a
graphite anode, preventing further decomposition through exfoliation and allowing
graphite to intercalate reversibly[34]. Along a similar vein, it is important to select
the appropriate electrolyte and cathode material for a lithium-oxygen battery to cycle
reversibly.
As described above, water impurities can play a significant role in the
lithium-oxygen battery. While it can enhance the solubility of LiO2, it can also engage in a
side reaction, forming lithium hydroxide (LiOH), which is an irreversible reaction
in this system[30]. In addition to water impurities, degradation of the organic
electrolyte can lead to a wide range of irreversible decomposition products[35]. An
expansive search for organic electrolytes has yet to find one that does not suffer
from degradation[36–41]. Interestingly, it is thought that LiO2is a primary culprit,
considering the reactivity of the superoxide radical to organic species. This leads
to the unfortunate situation where increasing the capacity through the solution
mediated growth mechanism also leads to irreversibility due to superoxide attack of
the electrolyte.
In addition to electrolyte degradation, the high surface area carbons often employed
as the cathode catalyst or the support for other catalysts also suffers from side
reactions. In particular, lithium carbonate (Li2CO3) is a common side product
which is irreversible on charge[42, 43]. Searching for electrodes which are both
catalytic to ORR and OER while also being immune to these side reactions is an
The accumulation of these side products which are not removed during OER lead
to a passivation of the cathode as insulating species prevent electrons from reaching
the electrolyte. When enough of these side products have accumulated, the cell can
no longer function and the discharge capacity rapidly approaches zero in an event
called "sudden cell death"[42].
The instabilities of both the cathode and electrolyte mentioned above, in addition to a
host of other practical complications not mentioned here, demonstrate the difficulties
associated with successfully implementing a lithium-oxygen battery. This quick
review has only covered the aspects of the lithium-oxygen battery most relevant for
this thesis, and there are several excellent, thorough reviews for further reading[16,
19, 47, 48]. The complexity of the lithium-oxygen chemistry is a long way from
that first primary battery of Volta described in Equation 1.1. However, this lends it
to being a rich area of research with many problems to solve.
1.3 Thesis Overview
The aim of this thesis is to give a deeper understanding of battery cathodes that
employ a phase forming conversion reaction chemistry, and in doing so, provide
design guidelines so that one could optimize such a cathode. The first chapter of
this thesis has provided a brief introduction to the current state of battery research and
then given a detailed look into the lithium-oxygen battery. The second chapter will
probe the effects of operating a lithium-oxygen battery with a molten salt electrolyte,
noting the implications this gives for the chemistry more broadly. The third chapter
will introduce nitrate reduction chemistry, which is similar to the lithium-oxygen
battery, and demonstrate its ability to serve as a secondary battery. The fourth
chapter will use this nitrate reduction chemistry to explore the effects of cathode
structure on battery performance, drawing conclusions which can be more broadly
applied to other battery chemistries. Finally, the fifth chapter will reflect on the
C h a p t e r 2
A MOLTEN SALT LITHIUM-OXYGEN BATTERY
Adapted with permission from
1. Giordani, V., Tozier, D., Tan, H., Burke, C. M., Gallant, B. M., Uddin, J., Greer, J. R., McCloskey, B. D., Chase, G. V. & Addison, D. A Molten Salt Lithium-Oxygen Battery.Journal of the American Chemical Society138,2656–2663. doi: 10.1021/jacs.5b11744 (2016).
© 2016 American Chemical Society
Chapter Abstract
Despite the promise of extremely high theoretical capacity (2Li+O2 → Li2O2, 1675 mAh per gram of oxygen), many challenges currently impede development
of lithium-oxygen battery technology. Finding suitable electrode and electrolyte
materials remains the most elusive challenge to date. A radical new approach is
to replace volatile, unstable and air-intolerant organic electrolytes common to prior
research in the field with alkali metal nitrate molten salt electrolytes and operate
the battery above the liquidus temperature (>80 °C). In this chapter we
demon-strate an intermediate temperature lithium-oxygen battery using a lithium anode, a
molten nitrate-based electrolyte (e.g., LiNO3–KNO3eutectic) and a porous carbon
oxygen cathode with high energy efficiency (~95%) and improved rate capability
because the discharge product, lithium peroxide, is stable and moderately soluble
in the molten salt electrolyte. The results, supported by essential state-of-the-art
electrochemical and analytical techniques such as in situ pressure and gas analyses,
scanning electron microscopy, rotating disk electrode voltammetry, demonstrate that
Li2O2electrochemically forms and decomposes upon cycling with discharge/charge
overpotentials as low as 50 mV. We show that the cycle life of such batteries is
limited only by carbon reactivity and by the uncontrolled precipitation of Li2O2,
2.1 Molten Salt Electrolytes
The Introduction Chapter demonstrated both the potential of lithium-oxygen
batter-ies as a replacement for lithium-ion ones and the many challenges that must still be
overcome for them to be practically realized. In particular, finding sufficiently stable
electrolytes in the presence of the active lithium-oxygen cathode electrochemistry
has been the most elusive challenge to date. In addition, the insulating and
insol-uble nature of Li2O2passivates the cathode surface, limiting discharge capacity to
a small fraction of the large theoretical capacity provided by the lithium-oxygen
electrochemistry.
The approach described in this chapter is to replace unstable aqueous or
based electrolytes common in prior lithium-oxygen battery research with an
organic-free molten alkali metal nitrate electrolyte and operate the battery above the eutectic
melting point, typically between 80 and 200 °C[49]. Research on molten nitrate
electrolytes for lithium batteries and thermal batteries traces back to the late 1970s
when it was observed that the reaction between metallic lithium and the nitrate anion
generated a SEI composed of Li2O that was sufficiently stable for primary cells and
rechargeable cells with limited cycle life[50, 51]. However, reports on oxygen
electrode behavior in these electrolyte mixtures are somewhat lacking. Previous
works reported that equilibria between superoxide, peroxide, and oxide forms of
reduced oxygen could coexist in the molten salt electrolyte with high reversibility
at a platinum rotating disk electrode[52, 53]. Stability toward lithium, low melting
point relative to other inorganic salts, high thermal stability above 500 °C,
non-volatility, high ionic conductivity and acceptable electrochemical stability window
(typically between 2.2 and 3.8 V vs Li/Li+ on amorphous carbon black electrodes)
are attractive features that make the molten nitrate and nitrite class of electrolytes
interesting for lithium-oxygen batteries.
Furthermore, we hypothesize that LiO2 and Li2O2 discharge products will have
enhanced solubility in this electrolyte compared to room temperature organic
elec-trolytes, because previous work on molten salts as solvents have found them to have
acceptor numbers >100, a value well off the chart in Figure 1.6[54]. Together with
improved electrode kinetics at elevated temperature, we anticipate high reversibility
and higher rate capability for the oxygen electrode.
The composition and relevant material properties of molten salts used in this work
are described in Table 2.1. All salts were purchased from Sigma-Aldrich and
the eutectic composition of the described mixture. Melting point was measured by
differential scanning calorimetry (DSC), lithium cation transference number by the
Bruce and Vincent method[55], and ionic conductivity at 150 °C by using a
conduc-tivity cell of known cell constant suitable for elevated temperature measurements.
Chemical Melting Lithium Ionic
composition point transference conductivity Electrolyte (mol %) (°C) number (mS cm-1)
LiNO3– 42–58 125 0.68 88
KNO3
LiNO3– 37–39–24 90 0.28 115
KNO2– CsNO3
Table 2.1: Molten salt electrolyte compositions, with measurements of conductivity properties at 150 °C.
2.2 Oxygen Electrochemistry in a Molten Salt
A combination of cyclic voltammetry (CV) and galvanostatic cycling are used to
compare the electrochemical behavior of a traditional organic electrolyte with the
molten salt electrolytes described in Table 2.1. These experiments were performed
in Swagelok cells with known volume that are paired with a pressure sensor and
valve to allow filling the head-space with gas and connecting the cell to a mass
spectrometer. Cathodes consisted of about 5 mg of Super P carbon and PTFE binder
95:5 mass ratio pressed onto a stainless steel mesh. A glass microfiber separator
was impregnated with about 300 mg of molten salt electrolyte and vacuum dried
overnight at 200 °C. For organic electrolytes, the separator was simply wet with
purchased premixed electrolyte. Anodes were a simple lithium foil. All assembly
took place in a glovebox, then the cells were filled with oxygen after a leak test,
and finally placed in an oven to be held at the operating temperature. A detailed
description of the cell design and assembly is given in the appendix.
Cyclic Voltammetry
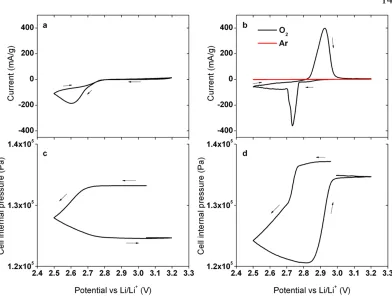
Figure 2.1 compares CVs of oxygen reduction at a Super P carbon cathode in
a conventional lithium-oxygen battery electrolyte, 0.1 M LiClO4–DMSO, and a
LiNO3–KNO3eutectic, at 30 and 150 °C, respectively. As expected, results indicate
that in the common organic electrolyte, oxygen reduction to form Li2O2is a highly
Figure 2.1: Cyclic voltammetry of oxygen reduction and evolution. (a,c) 0.1 M LiClO4–DMSO at 30 °C and (b,d) LiNO3–KNO3 eutectic at 150 °C. Working electrode: Super P porous carbon (A = 0.785 cm2), carbon loading ~5 mg/cm2. Counter and reference electrodes: lithium metal. Scan rate: 0.05 mV/s. Voltage window: 2.5–3.2 V vs Li/Li+. Current density expressed in mA per g of carbon.
current is observed in the operating potential window. Previous results have shown
that high anodic potentials (>3.8 V) are necessary to oxidize Li2O2 in
DMSO-based electrolytes, although at these potentials, a substantial fraction of the Li2O2
oxidation current results in parasitic decomposition of the electrolyte. On the other
hand, CVs performed in the oxygen-saturated LiNO3–KNO3 eutectic at 150 °C
shows high reversibility with Qa/Qc ratio of ~0.9 (anodic charge Qa and cathodic
charge Qc were obtained by integrating the “current vs time” plot derived from the
CV; Qa/Qc would ideally equal 1). To verify nitrate electrolyte electrochemical
stability in the operating voltage window, we performed the same CV experiment
under argon gas (without any oxygen present) and did not observe any faradaic
currents. Furthermore, pressure monitoring clearly demonstrates gas is consumed
upon reduction (cathodic scan) and generated upon oxidation (reverse, anodic scan).
Mass spectrometry on the head-space following the CV indicates that only oxygen,
observed during the anodic CV scan of a DMSO-based battery, as no anodic current
is observed, indicating that no product is being oxidized. The standard electrode
potential (E0) for the electrochemical formation of Li2O2(2Li++O2+2e −
Li2O2) can be calculated from the free energy of formation, and is generally considered to
be ~2.96 V vs Li/Li+ at 30 °C. However, operating the battery as 150 °C gives a
calculated potential of ~2.83 V vs Li/Li+, which agrees with the median potential,
measured from the CV.
It is important to note that quasi-reversible CVs are observed at a carbon oxygen
electrode in the molten salt eutectic, with cathodic peak to anodic peak separation
of about 200 mV. Typical CVs for conventional organic electrolytes at room
tem-perature usually display anodic peaks in the 3.4-4.5 V window, which are attributed
to side reactions (e.g., solvent decomposition) alongside direct Li2O2 oxidation.
Greater currents are obtained when using the molten salt electrolyte, which likely is
a result of less cathode passivation due to the higher solubility of intermediate LiO2
and discharge product Li2O2. The high cathodic peak potential for oxygen reduction
in the melt (~2.73 V vs Li/Li+) is likely a result of a combination of the following
effects: (i) improved electrode kinetics from elevated temperature operation, (ii)
lower internal cell resistance as a result of high ionic conductivity of the molten
salt, (iii) improved intermediate solubility (as will be conclusively shown later),
such as LiO2, which in turn reduces Li2O2 induced electrode passivation[56, 57].
Consistent with a Qa/Qc ratio of ~0.9, a slight inefficiency in the pressure profile
for the nitrate electrolyte is attributed to Li2O2 precipitating in the separator, away
from the current collector carbon, and becoming electrically disconnected. Some
dissolved Li2O2 may also have traveled across the electrolyte and been reduced to
Li2O on the lithium metal. No particular effort had been made to optimize the
porous volume and electrode architecture to date. These results constitute a
signif-icant step forward in the search for stable electrolyte materials. We anticipate that
the LiO2 or Li2O2 could react with carbon at the operating temperature of these
batteries to generate Li2CO3at the surface of carbon. This is consistent with oxygen
consumption/evolution inefficiencies observed during the CV.
Galvanostatic Cycling
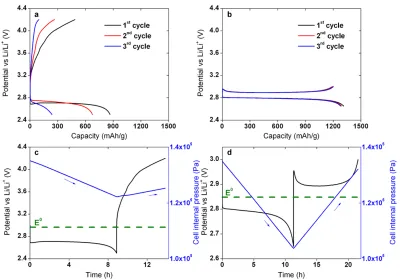
In a similar vein as the CV scans of Figure 2.1, Figure 2.2 compares galvanostatic
cycles of oxygen reduction at a Super P carbon cathode in a conventional
lithium-oxygen battery electrolyte , 0.1 M LiClO4–DMSO, and a molten salt electrolyte.
Figure 2.2: Galvanostatic cycling of oxygen reduction and evolution with pressure profiles measured in (a,c) 0.1 M LiClO4–DMSO at 30 °C between 2.5 and 4.2 V and (b,d) LiNO3–KNO2–CsNO3molten salt electrolyte at 120 °C between 2.65 and 3.0 V. Positive electrode: Super P carbon:PTFE 95:5 wt %, current: 0.25 mA (~80 mA/g carbon). Electrolyte loading: 150 µL. Carbon loading: ~4 mg/cm2. Pressure profiles depicted in (c) and (d) are for the first cycle of the battery. Battery capacity expressed in mAh per g of carbon. E0 represents the thermodynamic potential for the reaction 2Li++2e−+O2 Li2O2at 30 °C (c) and 120 °C (d)
they operate at 30 and 120 °C, respectively. The ternary mixture of nitrate/nitrite
salts has a lower melting point compared to the lithium/potassium nitrate binary
mixture, and therefore allowed the operation of the battery at a lower temperature.
The battery that uses the organic electrolyte has poor capacity retention and high
voltage hysteresis, whereas the battery using the molten nitrate/nitrite salts can be
cycled between 2.65 and 3.0 V with remarkably low voltage hysteresis (~0.1 V) and
good capacity retention. Consistent with the CV data, a ~10% irreversible capacity
loss is observed in the molten nitrate/nitrite battery. The voltage profile comparison
for the first three cycles of the batteries clearly demonstrates the superior behavior
of the molten salt lithium-oxygen battery compared to prior state of the art in terms
of (i) dramatically reduced voltage gap, (ii) excellent capacity retention, and (iii)
charge. The challenge will be to couple the molten nitrate electrolytes with stable
cathode materials to achieve long cycle life. Pressure monitoring in the organic
electrolyte battery during cycling clearly shows that only a small fraction of oxygen
consumed during discharge is evolved during charge. Side reactions govern the
electrochemistry and account for rapid capacity fade in the DMSO-based battery.
Many authors have reported high chemical instability of DMSO solvent in the
lithium-oxygen battery[36, 58].
Figure 2.2d demonstrates that oxygen can be consumed and subsequently evolved
with relatively high efficiency (∆Pcharge/∆Pdischarge≈90%) when recharging the
molten salt battery, with identical slopes of pressure variation within the battery
during discharge and charge. Enhanced LiO2/Li2O2 solubility in the melt leads to
electrical disconnection and carbon decomposition, and are thought to be responsible
for the ~10% irreversible pressure loss during cycling. We found the stoichiometry
for the battery reaction, often reported as e-/O2molar ratio in the literature, to be 2.0
by combining coulometry and gas analysis, for both discharge (ORR) and charge
(OER) half-cycles. Oxygen partial pressure, internal battery volume, and operating
temperature are all carefully controlled parameters. Molar ratios that deviate from
2.0 are indicative of parasitic processes occurring during cycling, often related to
a reaction between the electrolyte (or the electrode) and reduced forms of oxygen.
Gas analysis by mass spectrometry of the battery head-space is routinely performed
to ensure O2(mass 32) is the only gaseous species formed during cycling. Typically,
gases such as CO (28), CO2 (44), NO (30) and NO2 (46) are monitored by mass
spectrometry. These would arise from oxidation reactions of the carbon electrode
material and the electrolyte materials, namely nitrite and nitrate.
Gas Analysis of Charging Process
Figure 2.3 shows in situ gas analysis performed during a lithium-oxygen battery
charge half-cycle in LiNO3–KNO3electrolyte at 150 °C. The battery was first
dis-charged under oxygen to roughly 30% depth of discharge (~400 mAh/g). Then,
during open circuit voltage (OCV) between discharge and charge, the valve
con-necting the battery to the mass spectrometer was opened and the gases were allowed
to flow from the battery head-space directly into the mass spectrometer chamber.
The charge half-cycle was therefore carried out under a vacuum which would not be
possible with common organic electrolytes due to solvent volatility. As the electrode
begins to recharge, oxygen mass 32 signal increases and remains steady throughout
Other gases, such as carbon dioxide (mass 44) and nitric oxide (mass 30) remain at
background levels.
Figure 2.3: Mass spectrometry of lithium-oxygen charge process. Battery employed a LiNO3–KNO3molten salt electrolyte, a Super P carbon:PTFE cathode, and was charged at 150 °C, ~80 mA/g, to a 3.0 V cutoff. Capacity expressed in mAh per g of carbon.
2.3 Lithium Peroxide and Wulff Constructions
Confident in the reversibility in both the electrochemistry and gas analysis afforded
by a molten salt electrolyte, a combination of X-ray diffraction (XRD), scanning
electron microscopy (SEM), and energy-dispersive X-ray spectroscopy (EDS) are
used to characterize the discharge product grown on the cathode. Typically, the
cathode was extracted from heated batteries inside an argon-filled glovebox and
rinsed with N-Methylacetamide (NMA) solvent to remove residual nitrate and nitrite
salts.
X-ray Diffraction
After extraction from the battery following the procedure described above, carbon
electrodes were then sealed in Kapton tape for protection against air contamination.
Diffraction was performed on a PANalytical X’Pert Pro X-ray powder diffractometer
with Cu Kα1 radiation.
XRD patterns of the carbon electrode before discharge, following a ~1400 mAh/g
discharge under O2 to 2.6 V cathodic cutoff, and after a completed cycle (electrode
fully recharged to 3.0 V) are depicted in Figure 2.4. The XRD results clearly
demonstrate that crystalline Li2O2 forms on the carbon surface during discharge
Figure 2.4: X-ray diffraction of lithium-oxygen cathode across one cycle. Scans taken following an OCV period (before discharge), a single discharge to 2.6 V, and a discharge/charge cycle between 2.6 and 3.0 V, in LiNO3–KNO3 molten salt electrolyte at 150 °C with Super P carbon cathode.
presence of Li2CO3alongside Li2O2, confirming sustained reaction between carbon
and the oxygen reduction products. In addition, this Li2CO3 side product remains
after charge.
Wulff Constructions
Before analyzing the discharge product morphologies observed in this molten salt
electrolyte, it is worthwhile to give a brief review on Wulff constructions. In
particular, this section will describe the underlying theory, geometrical construction,
and necessary conditions of Wulff constructions.
A simple summary of the theory and proof for a Wulff construction is provided here.
For the detailed version of the proof on which this section is based, see [59]. The
surface energy of a crystal withiatoms (the difference between the free energy ofi atoms in an infinite crystal and the free energy of theiatoms in this crystal) is given by Gibbs[60] to be
∆Gi =
Õ
j
γjOj (2.1)
for a constant volume gives
Õ
j
γjδOj =0 (2.2)
Now choose a point inside the crystal. Drawing perpendicularshjfrom each face to this point, the volume of this crystal (assuming the crystal is convex) can be given
as
V = 1
3
Õ
j
hjOj (2.3)
Taking a small change in crystal shape at constant volume, after some algebra which
is omitted here, yields the expression
Õ
j
hjδOj =0 (2.4)
Combining Equations 2.2 and 2.4 with an arbitrary constantλgives
Õ
j
(hj −λγj)δOj = 0 (2.5)
Because the small change in crystal shape was arbitrary, so is δOj, requiring hj −
λγj = 0 for all j. Then hj = λγj, and the length of this perpendicular line is
proportional to the surface energy of the face it corresponds to, proving the idea
proposed by Wulff[61].
Figure 2.5: Wulff construction schematic. Adapted from [62].
Turning the idea of this derivation backwards, one can construct the shape of a
crystal orientation,γ(i j k). Draw a line (representing thehjof above) from the origin to each point on this plot. At this intersection, construct the plane perpendicular to
thishi j k (representing theOj of above). The crystal with minimum surface energy is then the one bounded by all of these planes. A schematic of this process in two
dimensions is shown in Figure 2.5.
While this construction represents a minimization of the surface energy, and thus
the thermodynamic equilibrium crystal shape, like many topics in materials science,
a competition between thermodynamics and kinetics determines the physically
re-alized outcome. For instance, several groups have performed Wulff constructions
of Li2O2[63, 64], and Figure 2.6 gives a representative example. By comparison
to the previously observed morphologies of Li2O2shown in Figure 1.4, it appears
that the equilibrium hexagonal structure is not achieved in a lithium-oxygen battery
for either the surface or solution mediated growth mechanisms. This suggests that
the kinetics of the system are playing a significant role in determining the crystal
[image:30.612.234.378.360.463.2]morphology.
Figure 2.6: Wulff construction of Li2O2. Adapted from [63].
Microscopy and Elemental Analysis
After extraction from the battery following the procedure described above, carbon
electrodes were briefly exposed to air (~30 seconds) as they were loaded into an
SEM vacuum chamber. SEM analysis was performed in a Versa 3D DualBeam
focused ion beam (FIB) microscope (FEI), and the elemental analysis with a ZEISS
1550VP FESEM microscope equipped with an Oxford X-Max SDD X-ray energy
dispersive spectrometer.
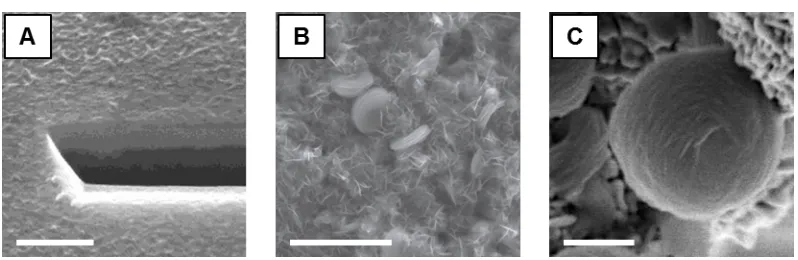
Figure 2.7 shows SEM images of the carbon electrode surface before and after
a discharge under oxygen to 2.6 V at 80 mA/g in a LiNO3–KNO3 molten salt.
Typically, large particles ranging from 500 nm to several microns were observed at
Figure 2.7: Morphology of oxygen cathode discharge product, taken with SEM. (A) Super P carbon nanoparticles before discharge (scale bar: 250 nm). (B,C) Cathode following ~1400 mAh/g discharge under oxygen to 2.6 V cutoff (scale bar: 1 µm and 500 nm, respectively).
the ones grown in past work using an organic electrolyte, such as those in Figure
1.3. In addition, the observed morphology of the discharge product, believed to
be Li2O2, consists of stacks of hexagonal layers. This morphology agrees with
theoretical predictions of the Wulff construction of Li2O2being a hexagonal prism
as shown in Figure 2.6.
The observation of these particularly large particles suggests an enhanced solubility
of the discharge products, leading to the solution mediated precipitation of Li2O2.
The increased solubility agrees with the large acceptor and donor number of
previ-ously studied molten salts described earlier. This enhanced solubility, in addition
to the elevated temperature of the battery, would reduce the kinetic restrictions on
crystal growth, allowing these Li2O2crystals to grow with equilibrium shape.
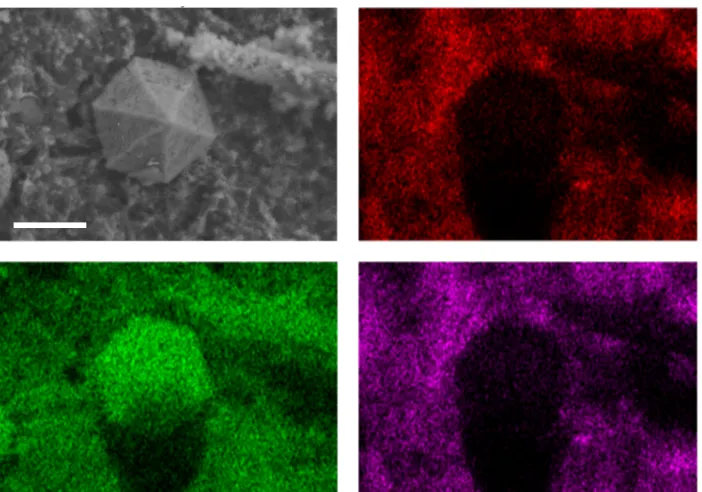
Figure 2.8 displays the elemental analysis performed on a discharged carbon cathode
and centered on a grown Li2O2 crystal. While EDS is typically unable to observe
lithium directly, we do observe only the presence of oxygen, and notably the absence
of carbon or potassium. The lack of carbon demonstrates that this crystal is not
Li2CO3or some other side product due to decomposition of the Super P carbon on
the cathode, and the lack of potassium demonstrates that this crystal is not frozen salt
or some side product due to decomposition of the electrolyte. The observed particle
is clearly crystalline as evidenced by the well defined facets, so the diffraction of
Figure 2.4 corroborates that this is in fact Li2O2.
SEM analysis of a Super P carbon electrode fully charged to 3.0 V (1st cycle)
in Figure 2.9 showed no evidence of Li2O2, and many areas of the cathode were
Figure 2.8: Elemental map of oxygen cathode discharge product, taken with EDS. (grayscale) Electron micrograph (scale bar: 2.5 µm) with (red) carbon, (green) oxy-gen, and (purple) potassium elemental maps of a Super P carbon cathode following ~1400 mAh/g discharge under oxygen to 2.6 V cutoff.
Figure 2.9: Elemental map of oxygen cathode after full cycle, taken with EDS. (grayscale) Electron micrograph (scale bar: 2 µm) with (red) carbon and (green) oxygen of a Super P carbon cathode following ~1400 mAh/g discharge and charge to 3.0 V cutoff under oxygen.
XRD data showing Li2CO3 at the end of charge, elemental analysis supports the
Lithium Peroxide Solubility
While the morphology of Li2O2shown in the previous section suggests an enhanced
solubility in the molten salt electrolyte, a more quantitative measure would help
confirm this. Li2O2 solubility and diffusivity in the molten salt electrolyte were
investigated by rotating disk electrode (RDE) measurements. Typically a
PTFE-based electrochemical cell was used inside an argon-filled glovebox. The working
electrode consisted of a platinum RDE (5.0 mm OD, 99.99% pure, mirror polished,
Pine Research), the counter electrode a platinum wire (1.0 mm OD, Sigma-Aldrich)
and the reference electrode a lithium metal rod (Sigma-Aldrich). The 3-electrode
cell was loaded with roughly 35 mL of carefully dried LiNO3–KNO3eutectic and
maintained at 150 °C by means of thermocouple and suitable beaker heating mantle.
Once reproducible CVs were obtained in the 2.8–3.3 V range, Li2O2powder (Alfa
Aesar, 95% pure) was added to the molten salt electrolyte, and using the RDE tip,
the solution was vigorously stirred for several minutes until saturation. Linear sweep
voltammograms (anodic scans from OCV to 3.3 V vs Li/Li+) were then performed
at 1 mV/s, varying the electrode rotation rate from 100 to 2500 rpm. Levich/Cottrell
analysis was used to determine bulk concentration and diffusivity of Li2O2 in the
molten salt electrolyte. The Levich equation contains the diffusivity as well as the
bulk concentration of the reacting species Li2O2, hence one of these quantities must
be known to estimate the other. For that we used the Cottrell equation derived from
transient current measurements under quiescent conditions.
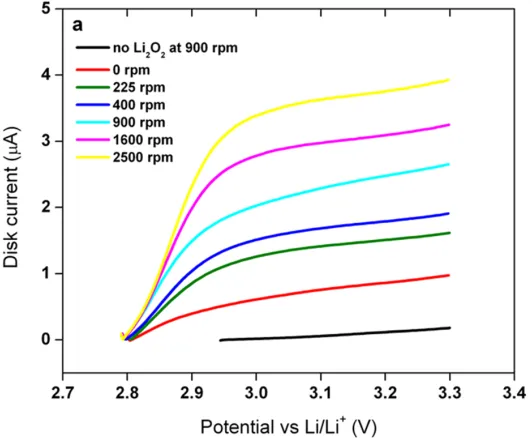
Figure 2.10 shows this linear sweep voltammetry data obtained for Li2O2 bulk
oxidation at 150 °C at a platinum RDE. Upon addition of Li2O2, the OCV of
the battery shifted to ~2.8 V vs Li/Li+ which is consistent with thermodynamic
data. Slightly sloped anodic limiting currents (i.e., mass-transport limited currents)
are due to interference with oxidation by impurities in the melt such as nitrite
and hydroxide ions (nitrite ions form when nitrate ions get chemically reduced by
the lithium reference electrode, whereas LiOH is a known impurity in LiNO3).
Consistent with fast electrode kinetics, the current observed at any given potential
along the voltammogram varies linearly with the square root of the rotation rate
and the line intercepts the vertical axis at zero. We measured the peroxide anion
concentration to be 5.2e-4mol/L, which is an order of magnitude greater than values
calculated in organic solvents such as DMSO or DMF at 30 °C (in the 10-5 M
range). For those organic solvents, lithium atomic absorption spectroscopy (AAS)
was typically performed on Li2O2-saturated samples after dilution in water[65]. It
effects between the molten salt electrolyte and the peroxide anions require further
[image:34.612.173.439.118.337.2]investigation.
Figure 2.10: Linear sweep voltammograms of Li2O2oxidation, recorded at a plat-inum RDE (A = 0.196 cm2) in a molten salt electrolyte containing Li2O2. v = 1 mV/s, from OCV to 3.3 V vs Li/Li+. RDE rotation rate increased from 0 to 2500 rpm. For comparison, a LSV scan of the molten salt electrolyte without Li2O2was performed at each rotation rate to measure the background current (plotted is the 900 rpm scan). Performed in a LiNO3–KNO3electrolyte at 150 °C with platinum wire counter electrode and lithium metal rod reference electrode.
In the LiNO3–KNO3 eutectic molten electrolyte, the rate of the electrochemical
half-reactionO22− →O2+2e −
at 150 °C is governed only by mass transport to the
electrode surface. A diffusion coefficient of 3.1e-8 cm2/s was found for the O2
2-anion, several orders of magnitude lower than typical values for O2(10-5, 10-6cm2/s
range), but consistent with the fact that peroxide has two negative charges and could
exist as an ion pair with Li+ cations. Appropriate methodology to determine the
solubility and diffusivity of oxygen in molten nitrates is being developed.
The data shown throughout this section support the reversible, solution mediated
growth of Li2O2 in a molten salt electrolyte. In particular, the solvating ability of
the molten salt, paired with the elevated temperature of the battery, enables fast
electrode kinetics, resulting in the extremely low discharge/charge overpotentials
2.4 Battery Cycling Performance and Cell Death
In order to understand the failure mechanisms of this system, the lithium-oxygen
battery depicted in Figure 2.11 was galvanostatically cycled in LiNO3–KNO3
eutec-tic at 150 °C with limited depth of discharge (2 mAh discharge, ~45% DOD). The
battery was stopped after 50 cycles (~340 h of cycling) when the discharge capacity
had significantly dropped.
Figure 2.11: Cycling behavior of lithium-oxygen battery, including voltage profile for cycle 1, 10, 20, 30, 40, and 50. Battery cycled in LiNO3–KNO3 molten salt electrolyte at 150 °C using a Super P carbon cathode, current density of ~0.64 mA/cm2 or ~160 mA/g of carbon, and carbon loading of ~4 mg/cm2. Arrows indicate increasing voltage hysteresis with cycle number.
Interestingly, if we assume that all of the coulombic inefficiency accumulated over
the life of the battery is attributed to the side reaction resulting in the formation of
Li2CO3, it would require more carbon than is present in the cathode. To explain this
apparent discrepancy, the cathode was analyzed by XRD and SEM similarly to the
previous sections.
Despite ending the cycling after a complete charging half-cycle to 3.0 V, the
diffrac-tion of Figure 2.12 reveals the presence of Li2O2 at the carbon surface, alongside
the expected Li2CO3. We believe that electrically disconnected Li2O2accumulates
away from the electrode during cycling, accounting for the rest of the coulombic
inefficiency, while Li2CO3passivates carbon and is responsible for the continuous
increase in battery polarization with cycle number.
SEM analysis of the cycled carbon cathode in Figure 2.13 further supports this
argument. First, the surface of the cathode is clearly electrically insulating, as
Figure 2.12: X-ray diffraction of cycled lithium-oxygen battery, from a cell similar to the one in Figure 2.11.
Figure 2.13: Scanning electron microscopy of cycled lithium-oxygen battery from a cell similar to the one in Figure 2.11. (A) Image charging of cathode due to electrically insulating surface (scale bar: 15 µm). (B) Li2CO3 particles covering carbon surface (scale bar: 5 µm). (C) Li2O2particles agglomerating on a separator microfiber away from electrode surface (scale bar: 10 µm).
and Li2CO3covering the carbon. A closer observation in Figure 2.13b shows large
crystals of Li2CO3 (fuzzy “needle-like” particles) which are seen throughout the
carbon surface. In addition, Figure 2.13c shows large, >10 µm, clusters of Li2O2
hexagonal prisms growing on the residual separator glass microfibers leftover on
the harvested cathode. It is noteworthy that electrochemically grown Li2O2 is
growing on the battery separator, which is insulating by design. This serves as a
direct confirmation of the solution-mediated growth process and is consistent with
uncontrolled precipitation of Li2O2during battery cycling.
for the cycle life limitation of the present batteries. Electrode passivation by Li2CO3,
often reported as “carbon corrosion”, is a known phenomenon in lithium-oxygen
batteries[42, 43]. As the number of cycles increases, the voltage hysteresis of the
battery increases, consistent with the growth in electrode impedance. The origin of
capacity fade in these systems is therefore 2-fold. First, one needs to better control
Li2O2dissolution and precipitation during discharge, and second, cathode materials
stable to oxygen reduction products need to be developed in order to achieve high
coulombic efficiency and maintain high energy efficiency.
2.5 Summary
We developed chemically stable electrolytes for the lithium-oxygen battery by
re-placing volatile, unstable, and air-intolerant aqueous or organic-based electrolytes
with an inorganic molten salt. We used eutectic binary or ternary mixtures of alkali
metal nitrate/nitrite salts and studied the oxygen electrochemistry at 120 and 150 °C.
Oxygen reduction was found to proceed based on a 2e-/O2reaction leading to the
for-mation of Li2O2. We observed the shape of deposited Li2O2to be hexagonal, which
agrees with equilibrium surface energy calculations of its Wulff construction. XRD
confirmed the reversible formation of crystalline Li2O2, and in situ gas and pressure
analyses demonstrated that oxygen could be efficiently evolved during charge at a
very low overpotential. A discharge/charge voltage gap of only ~0.1 V constitutes
the lowest value reported for a lithium-oxygen battery. Improved reversibility and
rate capability are thought to originate from enhanced solubility of the discharge
products, which alleviate the intrinsic electronic transport limitations of Li2O2
de-posited on the lithium-oxygen battery cathode. More fundamental work needs to be
done to understand solvation effects and the role of nitrate/nitrite anions in
enhanc-ing solubility of the discharge products. In the present study we used Super P carbon
as the oxygen electrode material and showed that it tends to react with oxygen
re-duction products to form Li2CO3. We also demonstrated that decomposition of the
amorphous carbon electrode causes battery failure, and therefore the identification
of suitable non-carbonaceous oxygen electrode materials will be key to success for
this chemistry. Although we found that Li2CO3is sparingly soluble in the melt and
can be bulk oxidized at about 3.5 V vs Li/Li+ at a platinum disk electrode, the side
product passivates the carbon electrode when operating the battery in the typical
voltage regime (2.6–3.0 V) and is responsible for increased polarization and capacity
loss. XRD analysis of a cycled carbon cathode revealed substantial accumulation
crystals deposited on the glass fiber separator were observed by SEM. Solubility of
Li2O2allows growth of large particles and clusters via a solution phase mechanism
which enables high areal capacity and low overpotential, but creates challenges in
achieving high coulombic efficiency. Uncontrolled diffusion and precipitation of
soluble Li2O2 is a major cause of capacity loss, and the low oxygen solubility is
a challenge for achieving high rate capability. Methods to address these issues are
C h a p t e r 3
A NITRATE REDUCTION BATTERY
Adapted from
1. Addison, D., Tozier, D., Tan, H., Uddin, J., Gallant, B. M., McCloskey, B. D., Greer, J. R., Chase, G. V. & Giordani, V. A New Rechargeable Battery: Lithium Oxide Growth through Molten Salt Nitrate Reduction.(In Preparation).
Chapter Abstract
Next generation lithium batteries, such as the lithium-oxygen battery of the previous
chapter, often employ the growth of lithium-rich phases, allowing specific capacities
much higher than typical insertion cathode materials. In this chapter we introduce
a battery chemistry along a similar vein. We demonstrate that a nanoparticle
heterogeneous catalyst allows the reversible growth and dissolution of micron scale
Li2O crystals through the effective catalysis of nitrate reduction and nitrite oxidation.
This enables a new rechargeable battery system with a full cell theoretical specific
energy of 1289 Whkg-1 where a molten nitrate salt serves as both active material
3.1 Nitrate Reduction Chemistry
The Introduction Chapter discussed the potential benefits of moving beyond the
typ-ical intercalation cathode materials of lithium-ion batteries, looking at chemistries
that employ the growth and dissolution of new phases such as oxygen and sulfur
cath-odes, both widely studied systems. The Second Chapter proposed a novel approach
to the lithium-oxygen battery, replacing the traditional organic electrolyte with a
molten salt one in hopes of overcoming some of practical challenges involved in
that system. This molten salt electrolyte also led to interesting growth mechanisms
of that systems lithium-rich phase, Li2O2.
This chapter considers a similar phase-forming conversion chemistry, whereby a
molten nitrate salt serves as both an active material and the electrolyte. Molten
nitrate salts have been previously studied as an active material in a primary lithium
battery where Li2O irreversibly forms as nitrate reduces to nitrite[50, 51, 66, 67].
The reaction and thermodynamic potential at 150 °C are given in Equation 3.1.
2Li+LiNO3 → Li2O+LiNO2 E0 =2.44V (3.1)
When using a eutectic composition LiNO3–KNO3 electrolyte (the same one as in
Chapter Two), Equation 3.1 has a theoretical capacity of 612 mAhg-1, and paired
with a lithium metal anode at the thermodynamic potential of 2.44 V, has a full
cell theoretical specific energy of 1289 Whkg-1. This is an encouraging value when
looking at Table 1.1, especially when considering the electrolyte serves as the active
material. If only a fraction of this theoretical specific energy were available, it would
still be competitive with state of the art battery chemistries.
Previous work on this chemistry as a primary battery used a high surface area
car-bon current collector, resulting in a large overpotential on discharge[67]. When
attempting to reverse the chemistry after discharge as in Figure 3.1, there is
sig-nificant overpotential accompanied by gas evolution, suggesting the irreversibility
of the reaction. However, by using a cathodic current collector which catalyzes
Equation 3.1, in particular the reverse reaction of nitrite oxidation, this chemistry
could be implemented as a secondary battery. Such a catalyst for nitrite oxidation is
important because Li2O will directly oxidize to oxygen above 2.8 V in a similar way
to Li2O2 in a lithium-oxygen battery, and this reaction contributes to the pressure
rise of Figure 3.1.
If such a catalyst were found, a secondary nitrate reduction battery could be operated
Figure 3.1: Nitrate reduction first cycle on a Super P carbon cathode, with pressure monitoring of the cell. LiNO3–KNO3electrolyte at 150 °C with carbon loading of ~4 mg/cm2.
lithium-rich phase would grow on the surface of the catalytic porous cathode support
on discharge, and it would be removed on charge. In addition, note the presence of
Li2O on the surface of the lithium anode. Interestingly, this natural SEI, which was
previously reported for lithium in molten nitrate salts[67, 68], is the same reaction
as the one occurring at the cathode, Equation 3.1, except that it occurs chemically.
While a lithium anode directly exposed to the electrolyte is not practical for extended
cycling, it is stable enough here to enable the study of this cathode chemistry.
3.2 Catalysis of Nitrite Oxidation
A combination of galvanostatic cycling and galvanostatic intermittent titration
tech-nique (GITT) are used to compare the electrochemical behavior of various catalyst
candidates and electrochemically confirm the reversibility of any promising
mate-rial. These experiments were performed in the same Swagelok cells used in Chapter
Two. Cathodes consisted of about 10-20 mg/cm2 of metal nanoparticles (or
mi-croparticles) pressed onto a stainless steel or aluminum mesh without the use of
binder. A glass microfiber separator was impregnated with about 200 mg of molten
salt electrolyte, LiNO3–KNO3unless otherwise noted, and vacuum dried overnight
at 200 °C. Anodes were a simple lithium foil. All assembly took place in a glovebox,
then the cells were filled with argon after a leak test, and finally placed in an oven
to be held at the 150 °C. A detailed description of the cell design and assembly is
given in the appendix.
Searching for a Catalyst
A single galvanostatic cycle for various metal nanoparticles (all around 30-50 nm),
including many typically used as catalysts for OER and ORR in other systems, is
[image:42.612.150.455.405.653.2]shown in Figure 3.3.
![Figure 1.5: Growth mechanisms of Li2O2. Adapted from [25].](https://thumb-us.123doks.com/thumbv2/123dok_us/15368.1110/17.612.117.500.69.238/figure-growth-mechanisms-li-o-adapted.webp)

![Figure 2.6: Wulff construction of Li2O2. Adapted from [63].](https://thumb-us.123doks.com/thumbv2/123dok_us/15368.1110/30.612.234.378.360.463/figure-wul-construction-li-o-adapted.webp)