Cytokines Elevated in HIV Elite
Controllers Reduce HIV Replication
In Vitro
and Modulate HIV Restriction
Factor Expression
Evan S. Jacobs,
aSheila M. Keating,
a,bMohamed Abdel-Mohsen,
a,cStuart L. Gibb,
aJohn W. Heitman,
aHeather C. Inglis,
aJeffrey N. Martin,
dJinbing Zhang,
fZhanna Kaidarova,
aXutao Deng,
aShiquan Wu,
aKathryn Anastos,
gHoward Crystal,
hMaria C. Villacres,
iMary Young,
jRuth M. Greenblatt,
d,e,fAlan L. Landay,
kStephen J. Gange,
fSteven G. Deeks,
dElizabeth T. Golub,
fSatish K. Pillai,
a,dPhilip J. Norris,
a,b,cthe Women’s Interagency HIV Study
Blood Systems Research Institute, San Francisco, California, USAa; Departments of Laboratory Medicine,b Medicine,cEpidemiology and Biostatistics,dand Pharmacy,eUniversity of California, San Francisco, San Francisco, California, USA; Johns Hopkins Bloomberg School of Public Health, Baltimore, Maryland, USAf; Albert Einstein College of Medicine, Bronx, New York, USAg; SUNY Downstate Medical Center, Brooklyn, New York, USAh; Keck School of Medicine of the University of Southern California, Los Angeles, California, USAi; Georgetown University Medical Center, Washington, DC, USAj; Rush University Medical Center, Chicago, Illinois, USAkABSTRACT
A subset of HIV-infected individuals termed elite controllers (ECs)
main-tain CD4
⫹T cell counts and control viral replication in the absence of antiretroviral
therapy (ART). Systemic cytokine responses may differentiate ECs from subjects with
uncontrolled viral replication or from those who require ART to suppress viral
repli-cation. We measured 87 cytokines in four groups of women: 73 ECs, 42 with
phar-macologically suppressed viremia (ART), 42 with uncontrolled viral replication
(non-controllers [NCs]), and 48 HIV-uninfected (NEG) subjects. Four cytokines were
elevated in ECs but not NCs or ART subjects: CCL14, CCL21, CCL27, and XCL1. In
ad-dition, median stromal cell-derived factor-1 (SDF-1) levels were 43% higher in ECs
than in NCs. The combination of the five cytokines suppressed R5 and X4 virus
repli-cation in resting CD4
⫹T cells, and individually SDF-1

, CCL14, and CCL27
sup-pressed R5 virus replication, while SDF-1

, CCL21, and CCL14 suppressed X4 virus
replication. Functional studies revealed that the combination of the five cytokines
upregulated CD69 and CCR5 and downregulated CXCR4 and CCR7 on CD4
⫹T cells.
The CD69 and CXCR4 effects were driven by SDF-1, while CCL21 downregulated
CCR7. The combination of the EC-associated cytokines induced expression of the
anti-HIV host restriction factors IFITM1 and IFITM2 and suppressed expression of
RNase L and SAMHD1. These results identify a set of cytokines that are elevated in
ECs and define their effects on cellular activation, HIV coreceptor expression, and
in-nate restriction factor expression. This cytokine pattern may be a signature
charac-teristic of HIV-1 elite control, potentially important for HIV therapeutic and curative
strategies.
IMPORTANCE
Approximately 1% of people infected with HIV control virus
replica-tion without taking antiviral medicareplica-tions. These subjects, termed elite controllers
(ECs), are known to have stronger immune responses targeting HIV than the typical
HIV-infected subject, but the exact mechanisms of how their immune responses
control infection are not known. In this study, we identified five soluble immune
sig-naling molecules (cytokines) in the blood that were higher in ECs than in subjects
with typical chronic HIV infection. We demonstrated that these cytokines can
acti-vate CD4
⫹T cells, the target cells for HIV infection. Furthermore, these five
EC-Received17 October 2016Accepted22
December 2016
Accepted manuscript posted online4
January 2017
CitationJacobs ES, Keating SM, Abdel-Mohsen
M, Gibb SL, Heitman JW, Inglis HC, Martin JN, Zhang J, Kaidarova Z, Deng X, Wu S, Anastos K, Crystal H, Villacres MC, Young M, Greenblatt RM, Landay AL, Gange SJ, Deeks SG, Golub ET, Pillai SK, Norris PJ, the Women's Interagency HIV Study. 2017. Cytokines elevated in HIV elite controllers reduce HIV replicationin vitroand modulate HIV restriction factor expression. J Virol 91:e02051-16.https://doi.org/10.1128/ JVI.02051-16.
EditorGuido Silvestri, Emory University
Copyright© 2017 American Society for
Microbiology.All Rights Reserved. Address correspondence to Sheila M. Keating, [email protected], or Philip J. Norris, [email protected].
E.S.J. and S.M.K. contributed equally to this article.
crossm
on November 7, 2019 by guest
http://jvi.asm.org/
associated cytokines could change expression levels of intrinsic resistance
fac-tors, or molecules inside the target cell that fight HIV infection. This study is
significant in that it identified cytokines elevated in subjects with a good
im-mune response against HIV and defined potential mechanisms as to how these
cytokines could induce resistance to the virus in target cells.
KEYWORDS
HIV, chemokine receptors, cytokines, elite control, restriction factor
I
nnate and adaptive immune responses during primary HIV infection are vital in
establishing initial host immunologic control of viral replication (1, 2). The extent of
HIV replication that persists once the host response is mature is a predictor of the
subsequent pattern of CD4
⫹T cell loss over time (3), and cellular immunity is one
important factor influencing residual viral replication (4, 5). While persistent
HIV-associated immune activation may enable the host to avoid rapid immunologic injury,
it is associated with a range of adverse immunologic and clinical outcomes (6).
Individuals with rapid disease progression are characterized by high viral load (3),
greater T cell activation and turnover (7), and increased levels of inflammatory
cyto-kines, including C-reactive protein, interleukin-6 (IL-6), and tumor necrosis factor alpha
(TNF-
␣
) (8). Combination antiretroviral therapy (ART) significantly inhibits viral
replica-tion and dampens immune activareplica-tion at the level of cellular phenotype and producreplica-tion
of inflammatory cytokines (9, 10). Determining the requirements for immune-mediated
viral control may support further improvements in HIV therapies and the development
of effective vaccines. The study of individuals who demonstrate natural
immune-mediated control of HIV replication may provide insight that will allow discrimination
between effective and pathogenic immune responses.
While HIV has likely been eliminated from one individual (11), generalizable
eradi-cation of the virus from host reservoirs is difficult if not impossible with current
therapeutic approaches. One alternative to complete eradication of the virus would be
functional cure, where replication is controlled to very low levels without the need for
continuous ART (12). Elite controllers (ECs) are a subset of individuals who maintain very
low levels of viral replication and relatively stable populations of circulating CD4
⫹T
cells without use of ART, and they show reduced immune activation compared to that
of subjects with higher viral loads (13–15). The intensive study of ECs has led to a better
understanding of effective host immune responses; however, the exact mechanisms of
control have not been elucidated fully. Early studies attributed elite control to infection
with less fit or defective viruses (16, 17) while more recent studies describe ECs infected
with virus with normal pathogenicity (18, 19). Both CD4
⫹and CD8
⫹HIV-specific T cell
responses are stronger in ECs than in subjects with progressive HIV infection (20–22).
Some reports note that CD4
⫹T cells from ECs are less susceptible to HIV infection (23,
24), while others have found decreased virion production from HIV-infected cells in ECs
(25) as well as decreased viral integration into the cellular genome (26). Moreover, the
EC phenotype is associated with specific HLA-B and -C genotypes (27). However,
genetic polymorphisms explain only 10 to 15% of the variation in the rate of HIV
disease progression in untreated hosts (28, 29). Additionally, the EC phenotype is likely
more common in women, who also demonstrate more potent host responses to a
variety of pathogens and vaccines (30). As such, it appears that the mechanism(s) of
elite control of infection are likely multifactorial.
Considering the varied host response to HIV infection, we sought to study how
cytokines contribute to the control of HIV replication. It is known that ECs have elevated
measures of inflammation compared to those of HIV-uninfected subjects, which may be
associated with HIV comorbidities such as cardiovascular disease (31), and
understand-ing which components of that inflammatory response are important for viral control
would help define effective immunotherapy approaches. To answer this question, a
panel of soluble mediators selected to include pro- and anti-inflammatory cytokines,
chemokines, growth factors, and soluble cytokine receptors was examined in four
groups of women with distinctive HIV-related phenotypes: HIV seronegative, EC,
on November 7, 2019 by guest
http://jvi.asm.org/
treated and aviremic, and off-ART viremic subjects. We identified five cytokines with
elevated expression levels in the EC group compared to those of the viremic, ART, or
HIV-negative group, and we further examined the ability of these cytokines both
individually and in combination to suppress HIV replication. In addition,
cytokine-induced modulation of the expression of multiple surface receptors on CD4
⫹T cells
was measured, including the key HIV coreceptors CCR5 and CXCR4, as well as the
activation marker CD69. Finally, cytokine-induced modulation of innate HIV restriction
factors was determined. This study builds on an extensive set of translational research
data and sheds important light on which soluble factors of the host immune response
can contribute to control of HIV in ECs.
RESULTS
Study subjects.
Subjects were classified as elite controllers (ECs;
n
⫽
73), ART
suppressed (ART;
n
⫽
42), noncontrollers (NCs;
n
⫽
42), or HIV negative (NEG;
n
⫽
48).
Table 1 and Materials and Methods describe the clinical criteria for subject assignment.
Eleven of the ECs were drawn from the University of California, San Francisco (UCSF)
SCOPE cohort, and all the remaining samples were drawn from the Women’s
Inter-agency HIV Study (WIHS) cohort. There were no significant differences among groups
in terms of median age, race, serologic evidence of hepatitis C virus (HCV) infection, or
presence of HCV viremia at the time of WIHS enrollment. CD4
⫹T cell counts were
significantly lower in the NC group than in the EC and NEG groups. A small percentage
of the EC and NC groups had received ART prior to the period that defined the group
status for this present study, which includes treatment provided during pregnancy.
Cytokines elevated in HIV infection.
Eighty-seven analytes were chosen to include
pro- and anti-inflammatory cytokines, chemokines, growth factors, and soluble cytokine
receptors, and these were measured in four HIV disease groups. Measurements were
performed using five different multiplex assay kits, and values from all the time points
tested for each subject were averaged to give a single value per subject. Twenty-three
analytes had fewer than 50% of results detectable above the lowest standard point;
these were analyzed categorically using a chi-square test to compare the proportion of
subjects with detectable cytokines in each of the clinical groups (CCL26/eotaxin-3,
IL-1
␣
, IL-1

, IL-1 receptor antagonist [IL-1Ra], IL-2R
␣
, IL-3, IL-4, IL-9, IL-12p40, IL-12p70,
IL-13, IL-15, IL-17, IL-20, IL-21, IL-28A, IL-29, IL-33, leukemia inhibitory factor [LIF],
macrophage colony-stimulating factor [M-CSF], stromal cell-derived cytokine [SCF],
TNF-

, and thymic stromal lymphopoietin [TSLP]). ECs showed a higher percentage of
subjects with detectable TSLP than ART subjects (
P
⫽
0.03), ECs had a higher
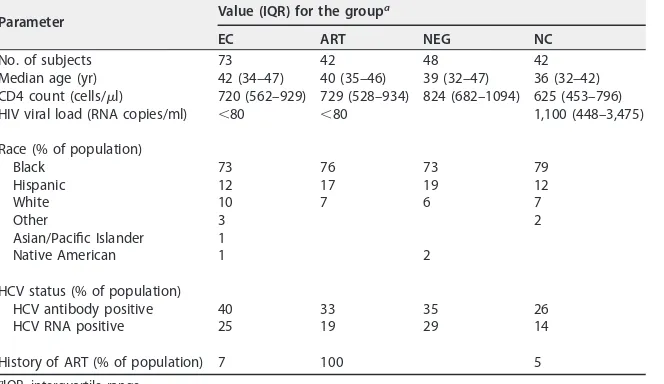
percent-TABLE 1Demographics of the study cohortParameter Value (IQR) for the group a
EC ART NEG NC
No. of subjects 73 42 48 42
Median age (yr) 42 (34–47) 40 (35–46) 39 (32–47) 36 (32–42) CD4 count (cells/l) 720 (562–929) 729 (528–934) 824 (682–1094) 625 (453–796) HIV viral load (RNA copies/ml) ⬍80 ⬍80 1,100 (448–3,475)
Race (% of population)
Black 73 76 73 79
Hispanic 12 17 19 12
White 10 7 6 7
Other 3 2
Asian/Pacific Islander 1
Native American 1 2
HCV status (% of population)
HCV antibody positive 40 33 35 26
HCV RNA positive 25 19 29 14
History of ART (% of population) 7 100 5
aIQR, interquartile range.
on November 7, 2019 by guest
http://jvi.asm.org/
[image:3.585.42.374.83.275.2]age of detectable IL-20 than NEG subjects (
P
⫽
0.03), and EC and NEG subjects had
higher percentages of detectable IL-13 than ART and NC subjects (
P
⫽
0.049). Given
that the rate of detection of these factors was less than 50% among the ECs, these
cytokines were not further studied. Of the 64 remaining analytes measured, 20
exhib-ited significant differences between the NEG group and at least one of the HIV-infected
groups (Table 2).
Elevated concentration of select cytokines in the plasma of HIV elite
control-lers.
If soluble factors played a role in immune control of HIV, we hypothesized that
they would be elevated in ECs compared to levels in HIV-uninfected individuals or
women with ART-associated viral suppression. Furthermore, the factors should be
elevated in ECs but not in viremic subjects since cytokines elevated in viremic subjects
would likely be HIV antigen driven rather than associated with viral control. We
identified four cytokines that were significantly elevated in the EC group compared to
the level in the HIV-negative or ART-suppressed group that were not elevated in the
viremic subjects (
P
⬍
0.05, false discovery rate [FDR] of
⬍
0.1) (Table 3). Hemofiltrate
CC-chemokine-1 (HCC-1, CCL14) and cutaneous T-cell attracting chemokine (CTACK,
CCL27) were significantly elevated only in ECs compared to levels in NEG subjects, while
6Ckine (CCL21) was elevated in ECs compared to levels in NEG and NC subjects and in
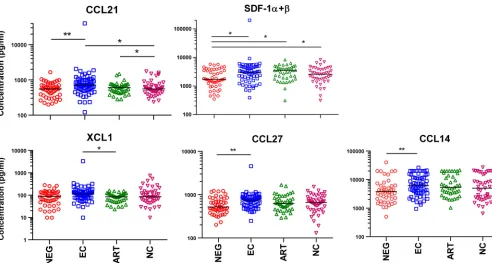
ART subjects versus levels in NC subjects (Fig. 1). Stromal cell-derived factor-1 (SDF-1,
CXCL12) was elevated in all HIV-infected groups compared to levels in NEG subjects but
was included for further study, given its known anti-HIV activity and the fact that
median levels were 43% higher in ECs than in NCs. Finally, lymphotactin (XCL1) was
elevated in EC subjects compared to levels in ART subjects (
P
⫽
0.04) though the
difference was not significant after FDR correction. Of note, soluble epidermal growth
factor receptor (sEGFR) was also uniquely elevated in ECs compared to levels in the NEG
group but was not studied further due to lack of available reagents. Of the five
cytokines selected for further
in vitro
study, CCL14 (32), SDF-1 (33, 34), and XCL1 (35)
have been previously associated with control of HIV infection.
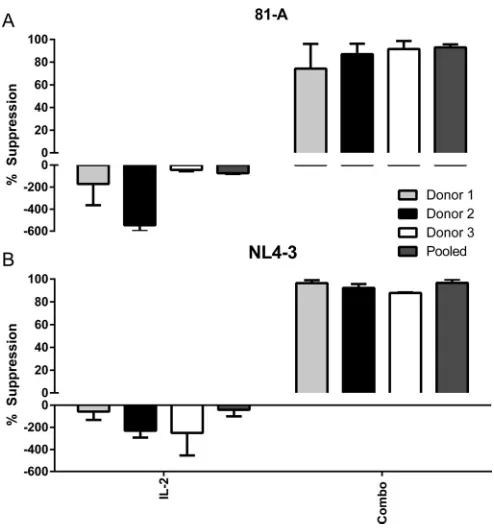
EC-associated cytokines individually and in combination suppress HIV
replica-tion.
To extend our findings that five cytokines are significantly elevated in the plasma
of elite controllers, we measured the effects of these cytokines on HIV infection and
replication. To do this, pooled CD8-depleted peripheral blood mononuclear cells
(PBMCs) from three uninfected healthy donors were infected and cultured in the
presence or absence of the cytokines of interest for 6 days as described in Materials and
Methods. To assess for productive viral infection and replication, viral p24 production
was measured by enzyme-linked immunosorbent assay (ELISA) in the culture
superna-tant on day 6. Individual cytokines were first titrated from 0.1 to 1,000 ng/ml to measure
suppression of virus, with peak suppression seen for most in the range of 100 to 1,000
ng/ml (data not shown). Given cost considerations and the manufacturers’
recom-mended concentration ranges, we tested each of the cytokines at 500 ng/ml. When
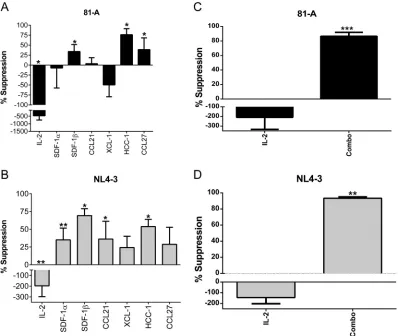
cocultured with individual cytokines, SDF-1

, CCL14, and CCL27 all significantly
sup-pressed production of p24 (33%, 76%, and 38% suppression, respectively) when cells
were infected with the CCR5-tropic strain 81-A (Fig. 2A). As expected, addition of
exogenous IL-2 enhanced production of HIV p24. Additionally, SDF-1

, CCL21, and
CCL14 significantly suppressed production of p24 (69%, 36%, and 54% suppression,
respectively) when cells were infected with the CXCR4-tropic strain NL4-3 (Fig. 2B). It is
interesting that SDF-1

and CCL14 each showed some suppression of R5 and X4 virus,
respectively, in spite of not targeting these coreceptors. Following these studies, we
sought to determine how the five cytokines affected HIV replication in combination.
The combined cytokines mediated significant suppression of HIV replication of both the
81-A and NL4-3 viruses (86% and 93% suppression, respectively) (Fig. 2C and D). These
results show that several of the individual cytokines found elevated in the serum of elite
controllers are capable of inhibiting HIV replication, and this suppression is greatest
when the cytokines are combined.
It has been previously shown that infection conditions such as exogenous activation
or high virus inoculum can influence viral replication (24, 26). Although these cultures
on November 7, 2019 by guest
http://jvi.asm.org/
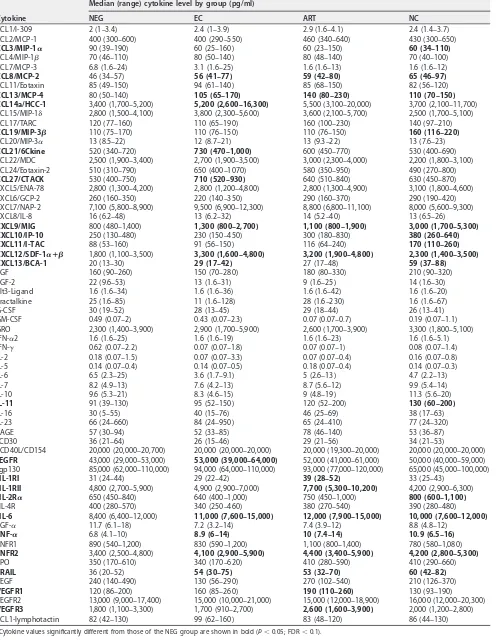
TABLE 2Cytokine levels by study groupa
Cytokine
Median (range) cytokine level by group (pg/ml)
NEG EC ART NC
CCL1/I-309 2 (1–3.4) 2.4 (1–3.9) 2.9 (1.6–4.1) 2.4 (1.4–3.7) CCL2/MCP-1 400 (300–600) 400 (290–550) 460 (340–640) 430 (300–650)
CCL3/MIP-1␣ 90 (39–190) 60 (25–160) 60 (23–150) 60 (34–110)
CCL4/MIP-1 70 (46–110) 80 (50–140) 80 (48–140) 70 (40–100) CCL7/MCP-3 6.8 (1.6–24) 3.1 (1.6–25) 1.6 (1.6–13) 1.6 (1.6–12)
CCL8/MCP-2 46 (34–57) 56 (41–77) 59 (42–80) 65 (46–97)
CCL11/Eotaxin 85 (49–150) 94 (61–140) 85 (68–150) 82 (56–120)
CCL13/MCP-4 80 (50–140) 105 (65–170) 140 (80–230) 110 (70–150)
CCL14a/HCC-1 3,400 (1,700–5,200) 5,200 (2,600–16,300) 5,500 (3,100–20,000) 3,700 (2,100–11,700)
CCL15/MIP-1␦ 2,800 (1,500–4,100) 3,800 (2,300–5,600) 3,600 (2,100–5,700) 2,500 (1,700–5,100) CCL17/TARC 120 (77–160) 110 (65–190) 160 (100–230) 140 (97–210)
CCL19/MIP-3 110 (75–170) 110 (76–150) 110 (76–150) 160 (116–220)
CCL20/MIP-3␣ 13 (8.5–22) 12 (8.7–21) 13 (9.3–22) 13 (7.6–23)
CCL21/6Ckine 520 (340–720) 730 (470–1,000) 600 (450–770) 530 (400–690)
CCL22/MDC 2,500 (1,900–3,400) 2,700 (1,900–3,500) 3,000 (2,300–4,000) 2,200 (1,800–3,100) CCL24/Eotaxin-2 510 (310–790) 650 (400–1070) 580 (350–950) 490 (270–800)
CCL27/CTACK 530 (400–750) 710 (520–930) 640 (510–840) 630 (450–870)
CXCL5/ENA-78 2,800 (1,300–4,200) 2,800 (1,200–4,800) 2,800 (1,300–4,900) 3,100 (1,800–4,600) CXCL6/GCP-2 260 (160–350) 220 (140–350) 290 (160–370) 290 (190–420) CXCL7/NAP-2 7,100 (5,800–8,900) 9,500 (6,900–12,300) 8,800 (6,800–11,100) 8,000 (5,600–9,300) CXCL8/IL-8 16 (6.2–48) 13 (6.2–32) 14 (5.2–40) 13 (6.5–26)
CXCL9/MIG 800 (480–1,400) 1,300 (800–2,700) 1,100 (800–1,900) 3,000 (1,700–5,300)
CXCL10/IP-10 250 (130–480) 230 (150–450) 300 (180–830) 380 (260–640)
CXCL11/I-TAC 88 (53–160) 91 (56–150) 116 (64–240) 170 (110–260)
CXCL12/SDF-1␣ⴙ 1,800 (1,100–3,500) 3,300 (1,600–4,800) 3,200 (1,900–4,800) 2,300 (1,400–3,500)
CXCL13/BCA-1 20 (13–30) 29 (17–42) 27 (17–48) 59 (37–88)
EGF 160 (90–260) 150 (70–280) 180 (80–330) 210 (90–320) FGF-2 22 (9.6–53) 13 (1.6–31) 9 (1.6–25) 14 (1.6–30) Flt3-Ligand 1.6 (1.6–34) 1.6 (1.6–36) 1.6 (1.6–42) 1.6 (1.6–20) Fractalkine 25 (1.6–85) 11 (1.6–128) 28 (1.6–230) 1.6 (1.6–67) G-CSF 30 (19–52) 28 (13–45) 29 (18–44) 26 (13–41) GM-CSF 0.49 (0.07–2) 0.43 (0.07–2.3) 0.07 (0.07–0.7) 0.19 (0.07–1.1) GRO 2,300 (1,400–3,900) 2,900 (1,700–5,900) 2,600 (1,700–3,900) 3,300 (1,800–5,100) IFN-␣2 1.6 (1.6–25) 1.6 (1.6–19) 1.6 (1.6–23) 1.6 (1.6–5.1) IFN-␥ 0.62 (0.07–2.2) 0.07 (0.07–1.8) 0.07 (0.07–1) 0.08 (0.07–1.4) IL-2 0.18 (0.07–1.5) 0.07 (0.07–3.3) 0.07 (0.07–0.4) 0.16 (0.07–0.8) IL-5 0.14 (0.07–0.4) 0.14 (0.07–0.5) 0.18 (0.07–0.4) 0.14 (0.07–0.3) IL-6 6.5 (2.3–25) 3.6 (1.7–9.1) 5 (2.6–13) 4.7 (2.2–13) IL-7 8.2 (4.9–13) 7.6 (4.2–13) 8.7 (5.6–12) 9.9 (5.4–14) IL-10 9.6 (5.3–21) 8.3 (4.6–15) 9 (4.8–19) 11.3 (5.6–20)
IL-11 91 (39–130) 95 (52–150) 120 (52–200) 130 (60–200)
IL-16 30 (5–55) 40 (15–76) 46 (25–69) 38 (17–63)
IL-23 66 (24–660) 84 (24–950) 65 (24–410) 77 (24–320) RAGE 57 (30–94) 52 (33–85) 78 (46–140) 53 (36–87) sCD30 36 (21–64) 26 (15–46) 29 (21–56) 34 (21–53)
SCD40L/CD154 20,000 (20,000–20,700) 20,000 (20,000–20,000) 20,000 (19,300–20,000) 20,000 (20,000–20,000)
sEGFR 43,000 (29,000–53,000) 53,000 (39,000–64,000) 52,000 (41,000–61,000) 50,000 (40,000–59,000)
sgp130 85,000 (62,000–110,000) 94,000 (64,000–110,000) 93,000 (77,000–120,000) 65,000 (45,000–100,000)
sIL-1RI 31 (24–44) 29 (22–42) 39 (28–52) 33 (25–43)
sIL-1RII 4,800 (2,700–5,900) 4,900 (2,900–7,000) 7,700 (5,300–10,200) 4,200 (2,900–6,300)
sIL-2R␣ 650 (450–840) 640 (400–1,000) 750 (450–1,000) 800 (600–1,100)
sIL-4R 400 (280–570) 340 (250–460) 380 (270–540) 390 (280–480)
sIL-6 8,400 (6,400–12,000) 11,000 (7,600–15,000) 12,000 (7,900–15,000) 10,000 (7,600–12,000)
TGF-␣ 11.7 (6.1–18) 7.2 (3.2–14) 7.4 (3.9–12) 8.8 (4.8–12)
TNF-␣ 6.8 (4.1–10) 8.9 (6–14) 10 (7.4–14) 10.9 (6.5–16)
TNFR1 890 (540–1,200) 830 (590–1,200) 1,100 (800–1,400) 780 (580–1,080)
TNFR2 3,400 (2,500–4,800) 4,100 (2,900–5,900) 4,400 (3,400–5,900) 4,200 (2,800–5,300)
TPO 350 (170–610) 340 (170–620) 410 (280–590) 410 (290–660)
TRAIL 36 (20–52) 54 (30–75) 53 (32–70) 60 (42–82)
VEGF 240 (140–490) 130 (56–290) 270 (102–540) 210 (126–370)
VEGFR1 120 (86–200) 160 (85–260) 190 (110–260) 130 (93–190)
VEGFR2 13,000 (9,000–17,400) 15,000 (10,000–21,000) 15,000 (12,000–18,900) 16,000 (12,000–20,300)
VEGFR3 1,800 (1,100–3,300) 1,700 (910–2,700) 2,600 (1,600–3,900) 2,000 (1,200–2,800)
XCL1-lymphotactin 82 (42–130) 99 (62–160) 83 (48–120) 86 (44–130)
aCytokine values significantly different from those of the NEG group are shown in bold (P⬍0.05; FDR⬍0.1).
on November 7, 2019 by guest
http://jvi.asm.org/
were not exogenously activated, there was a possibility that these results were affected
by allogeneic stimulation caused by pooling of PBMCs from three different donors. To
determine if allogeneic stimulation affected our results, we performed the infectivity
assays with three donors individually and pooled (Fig. 3). With both 81-A and NL4-3
infectivity assays, the cytokine combinations significantly suppressed HIV replication to
TABLE 3Cytokines showing significant differences between clinical groupsCytokine
Pvalue (FDR) for results of:a
NEG vs EC NEG vs ART NEG vs NC EC vs ART EC vs NC ART vs NC
CCL14a/HCC-1 0.007 (0.04)
CCL21/6Ckine 0.006 (0.04) 0.02 (0.05) 0.04 (0.08)
CCL27/CTACK 0.006 (0.04)
CXCL12/SDF-1␣ⴙ 0.046 (0.09) 0.02 (0.09) 0.03 (0.09)
XCL1/lymphotactin 0.04 (0.26)
sEGFR 0.005 (0.03)
CCL8/MCP-2 0.006 (0.02) 0.002 (0.02) 0.048 (0.07) CCL13/MCP-4 0.05 (0.09) 0.03 (0.09)
CXCL13/BCA-1 0.046 (0.07) ⬍0.001 (⬍0.001) ⬍0.001 (⬍00.01) ⬍0.001 (⬍0.001) CXCL9/MIG 0.001 (0.002) ⬍0.001 (⬍0.001) ⬍0.001 (⬍0.001) ⬍0.001 (⬍0.001) sIL-6 0.02 (0.04) 0.02 (0.04)
TNF-␣ 0.006 (0.01) ⬍0.001 (0.002) ⬍0.001 (0.002) 0.047 (0.07) TNFR2 0.02 (0.04) 0.007 (0.02)
TRAIL 0.006 (0.01) ⬍0.001 (0.003) 0.006 (0.01)
CCL19/MIP-3 0.007 (0.01) ⬍0.001 (⬍0.001) ⬍0.001 (⬍0.001) CXCL10/IP-10 ⬍0.001 (⬍0.001) 0.002 (0.004) 0.01 (0.01) CXCL11/I-TAC ⬍0.005 (⬍0.01) ⬍0.005 (⬍0.01) 0.006 (0.01) sIL-1RII ⬍0.001 (⬍0.001) ⬍0.001 (⬍0.001) ⬍0.001 (⬍0.001)
sIL-2R␣ 0.007 (0.04)
VEGFR1 0.005 (0.02)
VEGFR3 0.02 (0.07) 0.002 (0.02)
aAPvalue of⬍0.05 and an FDR of⬍0.1 were considered significant. The overallPvalues and FDR statistics for comparisons between groups were significant for each
analyte shown. Cytokines in boldface were selected for furtherin vitroanalysis of their ability to suppress HIV replication.
FIG 1Correlation of cytokines with elite control of HIV. Multiplex assays were used to measure 87 cytokines in samples from patients in the WIHS and SCOPE cohorts. Sample groups included 74 EC, 42 ART, 42 viremic, and 49 HIV-negative patients. Bars represent median values. Asterisks denote statistical significance as determined by a Mann-Whitney test. Corrections for multiple comparisons were made using the method of Benjamini-Hochberg; an FDR of⬍0.1 andPvalue of⬍0.05 were considered significant (*,P⬍0.05;**,P⬍0.01).
on November 7, 2019 by guest
http://jvi.asm.org/
[image:6.585.44.536.436.699.2]similar degrees in all three donors (74 to 92% and 89 to 96%, respectively), which was
also similar to the results using pooled PBMCs (93% and 97% suppression, respectively).
These results indicate that four of the five cytokines identified as being elevated in ECs
have significant anti-HIV activity
in vitro
and that the combination of these five
cytokines yields more potent suppression than that of any one isolated cytokine.
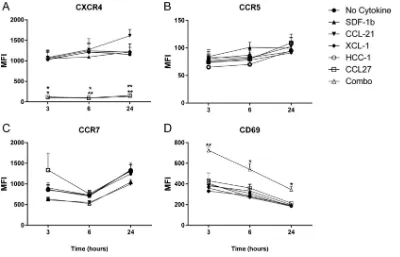
Cytokine-induced modulation of CXCR4, CCR5, CCR7, and CD69 on CD4
ⴙT
cells.
The role of aberrant immune activation in HIV pathogenesis is well documented,
and it is clear that elite controllers compared to noncontrollers are distinguished by a
lack of immune activation and a skewed cellular phenotype (36). Considering our
results that a set of cytokines could suppress HIV replication, we next tested how these
cytokines influence the phenotype and function of common targets of HIV infection.
PBMCs from individual donors were stimulated for 3, 6, and 24 h with cytokines
individually or in combination. No differences in HLA-DR and CD38 expression levels
were observed in cytokine-treated CD4
⫹T cells (data not shown). CXCR4 surface
expression was strongly suppressed (or fluorescent antibody binding was blocked) by
SDF-1

or combined-cytokine treatment at all time points (Fig. 4). There were no
significant changes in CCR5 or CCR7 expression levels at any of the time points though
CCL14 treatment decreased CCR5 expression by 20% compared to that in untreated
cells (Fig. 4B and C). Interestingly, we observed increased CD69 expression at all three
time points in CD4
⫹T cells stimulated with combined cytokines (Fig. 4D).
FIG 2In vitrosuppression of HIV by individual and combined cytokines. (A and B) Pooled CD8-depleted PBMCs from three donors (mixed-lymphocyte reaction stimulated) were infected with 81-A or NL4-3 virus at an MOI of 10⫺2and cocultured with the individual indicated cytokines. (C and D) Infections were cocultured with SDF-1␣/, CCL21, XCL1, CCL14, and CCL27 (Combo), IL-2, or medium alone. Supernatants were measured for p24 by ELISA on day 6. Data from four experiments were combined for analysis.*,P⬍0.05;**,P⬍0.01;***,P⬍0.001 (2-by-3 ANOVA of cytokine results versus those of the medium control).
on November 7, 2019 by guest
http://jvi.asm.org/
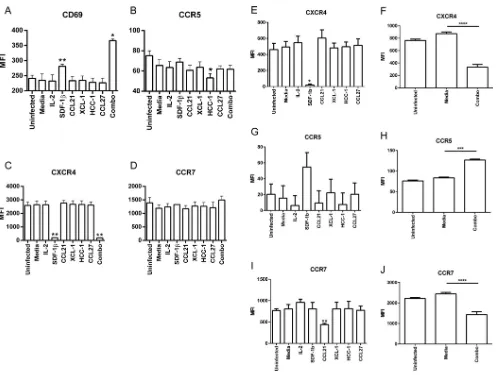
[image:7.585.41.439.71.407.2]To further explore the influence of these cytokines on T cell phenotype, similar
analyses were performed following infection with HIV. CD8-depleted PBMCs from
individual donors were infected with HIV NL4-3 in the presence of the cytokines of
interest, and then expression levels of CCR5/7, CXCR4, and CD69 were measured (Fig.
5). Following infection for 1 day, we observed significantly increased expression of
CD69 in cells incubated with SDF-1

and combined cytokines (Fig. 5A). CCR5
expres-sion was reduced by CCL14 individually but, notably, not by the combined cytokines
(Fig. 5B), and CXCR4 expression was significantly reduced when CXCR4 was incubated
with SDF-1

as well as with the combined cytokines (Fig. 5C). No significant change was
seen in CCR7 levels at 24 h (Fig. 5D). Next, we performed these analyses with
CD8-depleted PBMCs infected for 6 days. As with the single-day infections, CXCR4 was
significantly reduced when cells were incubated with SDF-1

(Fig. 5E) and combined
cytokines (Fig. 5F). In addition, combined-cytokine incubation resulted in elevated CCR5
expression (Fig. 5G and H) while CCL21 and combined-cytokine incubation resulted in
significantly reduced CCR7 expression (Fig. 5I and J). Consistent with CD69 being an
early activation marker (37), no significant changes were seen in CD69 levels at 6 days
(data not shown). It is evident from these data that the cytokines we found to be
elevated in the plasma of elite controllers can influence the phenotype of CD4
⫹T cells,
especially the markers that are indicative of activation and critical to infection by HIV.
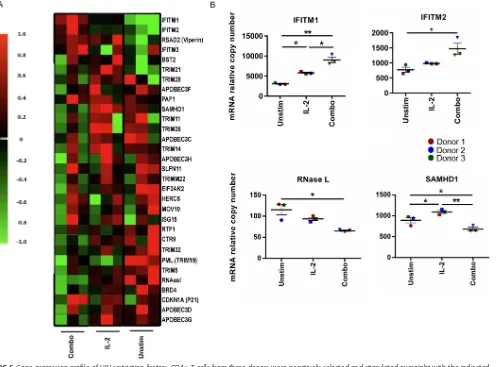
Cytokine stimulation induces IFITM1 and IFITM2 expression.
Intrinsic immunity
is an important mechanism for the immune system to fight viral infections, and there
is evidence that host restriction factors play a role in the ability of alpha interferon
(IFN-
␣
) to suppress HIV replication (38). We therefore tested whether the cytokines able
to suppress HIV replication induced expression of intrinsic restriction factors in target
cells. We utilized a customized mRNA profiling array to measure the expression of 31
different innate restriction factors (see Materials and Methods). CD4
⫹T cells were
isolated from three donors and incubated for 24 h with IL-2, combined cytokines, or
medium. Following this incubation, we measured the expression of all 31 restriction
FIG 3In vitrosuppression of HIV in individual and pooled donor PBMCs. Infections with 81-A and NL4-3 viruses were performed as previously described in pooled (mixed-lymphocyte reaction-stimulated) or nonpooled (resting) PBMCs and cocultured with combined SDF-1␣/, CCL21, XCL1, CCL14, and CCL27 (Combo), IL-2 alone, or medium alone. Culture supernatants were measured for p24 on day 6. Data were combined for analysis from two experiments.on November 7, 2019 by guest
http://jvi.asm.org/
[image:8.585.82.329.69.333.2]factors (Fig. 6A). Compared to the unstimulated condition, interferon-inducible
trans-membrane proteins 1 and 2 (IFITM1/2) had significantly elevated relative copy
num-bers, and RNase L and SAMHD1 had significantly decreased relative copy numbers after
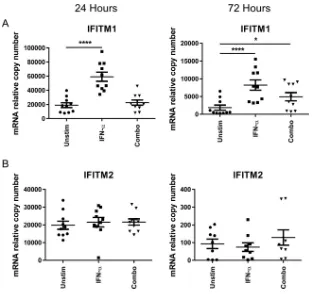
combined-cytokine treatment (Fig. 6B). To confirm the upregulation of IFITM1 and
IFITM2, we utilized quantitative PCR (qPCR) to measure the relative expression of IFITM1
and IFITM2 in the CD4
⫹T cells of 10 healthy donors. CD4
⫹T cells were stimulated for
24 h and 72 h with combined cytokines or with IFN-
␣
as a positive control. We detected
a significant elevation in mRNA expression of IFITM1 at 72 h but not at 24 h (Fig. 7A).
Additionally, we did not detect a difference in IFITM2 levels at 24 or 72 h by quantitative
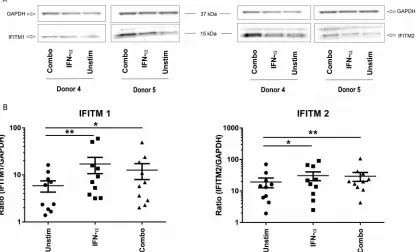
PCR (Fig. 7B). To determine if changes seen at the level of RNA expression translated to
differences in protein levels, Western blotting was performed on parallel samples
incubated for 72 h with IFN-
␣
or combined cytokines. We were able to detect
expres-sion of IFITM1 in CD4
⫹T cells, and this expression was significantly elevated in both the
IFN-
␣
-stimulated control and in the samples incubated with the combined cytokines
(Fig. 8A). We also confirmed basal expression of IFITM2 in the T cells and found a
significantly higher level of IFITM2 at the protein level when cells were stimulated with
the combined cytokines (Fig. 8B). While the induction of IFITM1/2 mRNA was modest,
at the protein level there was approximately 2-fold induction of both of these
restric-tion factors by the combined-cytokine treatment. It is clear from these data that the
combination of cytokines found elevated in ECs is able to modulate expression of
innate restriction factors.
DISCUSSION
The current study examined what cytokines from a broad panel of potentially
important mediators were elevated in women who control HIV in the absence of ART.
From a panel of 87 cytokines, 4 were found to be elevated in ECs and not elevated in
NCs or ART subjects. In addition SDF-1 was included for further analysis given its
modestly higher levels in ECs than in NCs and its known anti-HIV properties. Identified
cytokines included factors previously associated with HIV control, including CCL14,
FIG 4Cytokine stimulation of PBMCs increases CD69 and decreases CCR7 and CXCR4 expression. PBMCs from three donors were separately stimulated with individual cytokines or combined SDF-1␣/, CCL21, XCL1, CCL14, and CCL27 (Combo) for the indicated times. Following incubation, surface expression of CXCR4, CCR5, CCR7, and CD69, as indicated, was measured by flow cytometry. Means and standard errors of the means for three donors are shown.*,P⬍0.05;**,P⬍0.01 (2-by-3 ANOVA of cytokine results versus those of the unstimulated condition). MFI, mean fluorescence intensity.
on November 7, 2019 by guest
http://jvi.asm.org/
[image:9.585.40.440.70.327.2]SDF-1, and XCL1. In addition, we noted that CCL21 and CCL27 levels were elevated in
ECs, and to our knowledge this is the first report demonstrating that CCL27 is elevated
in elite controllers and can suppress virus replication
in vitro
. We further showed that
the combination of the five cytokines resulted in upregulation of CD4
⫹T cell CD69
surface expression and downregulation of CXCR4 at 24 h and in downregulation of
CCR5 and CCR7 expression at 6 days. The CD69 and CXCR4 effects were driven by
SDF-1, while CCR7 downregulation was induced by CCL21. We also demonstrated that
the combination of the five EC-associated cytokines induced expression of IFITM1
mRNA and induced expression of both IFITM1 and -2 at the protein level. These results
identify a set of cytokines that are elevated in EC subjects and define its effects on
cellular activation, HIV coreceptor expression, and innate restriction.
Multiple studies have measured levels of circulating cytokines in HIV-infected
sub-jects (reviewed in reference 39), with many measuring a correlation between HIV load
and cytokines. In prior work we found that CXCL10 correlated with HIV load, while IL-17,
CCL22, CXCL9, and fractalkine (CX3CL1) all showed inverse correlations with viral load
(10). IL-21 has also been shown to inversely correlate with viral load (40). IL-10, IL-18,
and soluble CD30 (sCD30) correlated positively with viral load in a cohort of subjects
with low viral load (
⬍
1,000 RNA copies/ml) and noncontrollers (41). Very few studies
FIG 5HIV-infected cultures cocultured with cytokines increases CD69 and decreases CXCR4 and CCR7 expression. Resting CD8-depleted PBMCs from three donors were infected with HIV NL4-3 and cocultured with the indicated cytokines. Combo indicates coculture with SDF-1␣/, CCL21, XCL1, CCL14, and CCL27. (A to D) Following infection for 1 day cells were measured by flow cytometry for expression of CD69, CCR5, CXCR4, and CCR7. (E to J) Cells from 6-day infections were measured by flow cytometry for expression of CXCR4, CCR5, and CCR7, as indicated. Individual and combined cytokine experiments were performed separately. Means and standard errors of the means for three donors are shown.*,P⬍0.05;**,P⬍0.01;***,P⬍0.001;****,P⬍0.0001 (2-by-3 ANOVA of cytokine results versus those of the medium control).
on November 7, 2019 by guest
http://jvi.asm.org/
[image:10.585.42.541.66.441.2]have examined systemic cytokine levels in ECs. A recent study by Platten et al. of ECs
and viremic controllers (with viral load between 50 and 6,000 RNA copies/ml) found
that, of 25 cytokines measured, 3 showed lower levels in ECs: CXCL10, CXCL9, and CCL4
(42). In our current study the median level of CXCL10 was 40% lower in ECs, CXCL9 was
57% lower in ECs, and CCL4 was 13% higher in ECs than in NCs. The results of our study
recapitulated those of Platten et al. with the exception of the results for CCL4. It has
been shown that a subset of ECs contain CD4
⫹T cells that produce high levels of CCL4,
rendering these cells resistant to R5 virus infection (43). In total, our identification of
cytokines elevated in ECs but not in NCs or ART subjects revealed cytokines not
previously associated with control of HIV infection, and our findings were largely
consistent with the few prior comparative observations made in ECs.
Advantages of the current study include the large panel of analytes measured in a
large enough cohort to observe the population distribution of cytokines. There are also
limitations of the study worth mentioning. By including CD4 count in the propensity
matching score with ECs, the resulting NC group of women had relatively low viral
loads (median 1,100 RNA copies/ml), and including women with a higher viral load may
have allowed better differentiation between the EC and NC women. In addition, XCL1
was included in the
in vitro
analyses in spite of failing the FDR correction for significant
elevation in ECs compared to levels in the ART group. In an original analysis XCL1 was
FIG 6Gene expression profile of HIV restriction factors. CD4⫹T cells from three donors were negatively selected and stimulated overnight with the indicated cytokines. Combo indicates SDF-1␣/, CCL21, XCL1, CCL14, and CCL27. (A) Thirty-one HIV innate restriction factors were measured on a custom qPCR array and normalized to values for the housekeeping genes. (B) Elevated expression of IFITM1 and IFITM2 mRNA (top) and decreased expression of RNase L and SAMHD1 mRNA (bottom). Fold induction was determined using theCTmethod. Means and standard errors of the means of three donors are shown, and conditions were compared using repeated-measures ANOVA.*,P⬍0.05;**,P⬍0. 01. Unstim, unstimulated.
on November 7, 2019 by guest
http://jvi.asm.org/
[image:11.585.45.541.74.441.2]significantly elevated, so it was included in
in vitro
studies. It was later discovered that
a subject had been misclassified, and on reanalysis of the data XCL1 failed the FDR test
for significance. It should also be noted that the concentration of cytokines used in the
virus culture assays (500 ng/ml) is approximately 2 logs higher than that found in the
plasma of elite controllers. We assume, but have not proven, that cytokine
concentra-tions would be higher in the local environment of the lymph node or other close
intercellular signaling environments. Finally, two well-characterized laboratory-adapted
X4 and R5 HIV strains were examined and yielded reproducible results, but multiple X4
or R5 strains or primary isolate viruses were not tested.
To the best of our knowledge there has been very little reported evidence linking
CCL27 to HIV infection: just one report of elevated CCL27 in HIV-infected subjects with
eosinophilic dermatitis compared to the level in HIV-infected subjects without
eosino-philic dermatitis (44). CCL27 binds to T cells expressing CCR10 and is thought to be
important in attracting these cells to the skin during inflammatory responses (45). It is
possible that CCL27 is associated with more vigorous HIV-specific immune responses in
ECs (15) as vaccination studies using CCL27 plasmid DNA as an adjuvant demonstrated
enhanced T cell and antibody responses, including at mucosal sites (46, 47).
Our data showed higher levels of CCL21 in EC and ART subjects than in NC subjects,
which is in contrast to a prior report showing decreased levels of CCL21 after initiation
of ART and a correlation of CCL21 with viral load in a cross-sectional analysis (48). In
viremic subjects, stimulation of PBMCs with CCL21 increased TNF-
␣
secretion, while the
same effect was not seen in HIV-uninfected subjects or in those with low viral load (49).
Incubation of resting CD4
⫹T cells with CCL21 does not cause activation of the cells
(50), consistent with our data. However, CCL21-treated cells incorporated more HIV
DNA after
in vitro
infection, showing a potential role for the chemokine in promoting
FIG 7Elevated mRNA expression of IFITM1 and IFITM2. CD4⫹T cells from 10 donors were negatively selected and stimulated for 24 or 72 h with IFN-␣, combined cytokines (SDF-1␣/, CCL21, XCL1, CCL14, and CCL27), or medium (Unstim, unstimulated) alone. Lysates were then measured by qPCR for IFITM1 and IFITM2, as indicated. Means and standard errors of the means are shown, with comparisons between groups made using repeated-measures ANOVA.*,P⬍0.05;****,P⬍0.0001.on November 7, 2019 by guest
http://jvi.asm.org/
[image:12.585.47.359.68.362.2]HIV latency (50). In contrast to our data showing inhibition of X4 virus replication by
CCL21 in resting, CD8-depleted CD4
⫹T cells, a prior report showed enhanced HIV
replication of R5 and X4 viruses in previously activated PBMCs (51). One limitation of
our study is that we measured cytokine levels in peripheral blood, but these factors
likely exert many of their effects in the microenvironment of lymph node and gut
lymphoid tissues. It was recently shown that CCL21 expression is decreased in the
lymph nodes in both acute and chronic HIV infection (52). Finally, the kinetics of CCL21
interaction with CD4
⫹T cells might be important as CCR7 was downregulated on the
surface of CCL21-treated cells after 6 days but not by 24 h (Fig. 5D and I).
In spite of being elevated in ECs, XCL1 did not show HIV-suppressive activity,
irrespective of the virus coreceptor usage in our assays. These data are consistent with
findings published after our experiments were performed, showing that an alternative
all-

conformation of XCL1 forms a dimer, binds glycosaminoglycans, and suppresses
HIV replication via blockade of attachment and entry into cells and that this form of the
protein lacks chemotactic activity (35). The protein supplied by R&D Systems is tested
to demonstrate chemotactic activity, so we conclude that the version of XCL1 used in
our experiments was in the classic XCL1 conformation and would not be expected to
suppress HIV replication. In fact, the R&D Systems XCL1 was tested recently and was
shown to have only modest suppressive activity compared to that of other preparations
(53). If XCL1 were to be utilized for anti-HIV therapy, it would need to be formulated in
the

-dimer form, and a variant with a disulfide bond that stabilizes the all-

confor-mation has been engineered (54).
CCL14 has been reported to suppress R5 but not X4 virus replication (32), while the
current study showed significant suppression of both R5 and X4 viruses. In addition, the
ability of CCL14 to suppress CCR5 expression was modest at day 1 and not detected at
day 6 (Fig. 5), implying that the ligand may have had relatively low affinity for CCR5. The
commercial preparation of CCL14 used for the current study contained amino acids 2
FIG 8Cytokine-induced protein expression of IFITM1 and IFITM2. CD4⫹T cells were negatively selected and stimulated with IFN-␣, combined cytokines (SDF-1␣/, CCL21, XCL1, CCL14, and CCL27), or medium (Unstim) alone for 72 h. (A) Total cell lysates were transferred to PVDF membranes and probed for expression of IFITM1 (left) or IFITM2 (right). GAPDH was used as a loading control. Images from two representative experiments are shown. (B) Plots summarize the expression ratio as a percentage of IFITM1 or IFITM2 compared to GAPDH expression after each treatment. Means and standard errors of the means from 10 donors are shown; comparisons were made using repeated-measures ANOVA of log-transformed data.*,P⬍0.05;**,P⬍0.01.
on November 7, 2019 by guest
http://jvi.asm.org/
[image:13.585.45.461.77.329.2]to 74 of the complete peptide while peak suppression of R5 virus was found to reside
in a truncated protein spanning residues 9 to 74 of the sequence, with a peptide
spanning residues 6 to 74 of CCL14 unable to suppress HIV replication (55). It is unclear
whether or not the longer peptide used in the current study underwent proteolytic
processing
in vitro
to gain activity or whether the commercial peptide acted in a fashion
independently of CCR5 blocking activity.
Interestingly, in the current study SDF-1

, which blocks HIV entry via the CXCR4
receptor, caused activation of CD4
⫹T cells
in vitro
. The anti-HIV effects of this molecule
may in fact drive some of the residual immune activation seen in EC subjects. SDF-1
exists in two predominant forms in humans, SDF-1
␣
and SDF-1

, which is identical to
SDF-1
␣
but possesses four additional C-terminal residues (56). The original articles
describing suppression of HIV replication of X4 but not R5 virus used SDF-1
␣
(33, 34).
SDF-1

is about twice as potent as SDF-1
␣
in suppressing HIV replication, consistent
with our results shown in Fig. 2A and B, in spite of the fact that the CXCR4 binding
domain resides in the N terminus of the protein (57). Subsequent work showed that the
peptides from the C terminus of SDF-1

but not SDF-1
␣
can suppress X4 HIV
replica-tion, independently of binding CXCR4. Our results showing suppression of R5 virus by
SDF-1

but not by SDF-1
␣
are consistent with the concept that the C-terminal portion
of SDF-1

possesses HIV-suppressive activity independent of CXCR4 blockade. The
differential ability of the SDF-1 isoforms to suppress HIV does not appear to be linked
to activation of the target cells as SDF-1
␣
and -1

induced similar degrees of CD69
upregulation on CD4
⫹T cells at 24 h (data not shown). Taken together, our results
support the notion that SDF-1

has the ability to suppress HIV replication through
CXCR4-dependent and -independent mechanisms.
The correlative data showing higher levels of a subset of cytokines in ECs but not in
NCs could point to cytokines that contribute to the EC phenotype or, alternatively, are
merely markers for the phenotype. Our
in vitro
data suggest that these cytokines play
a role in suppression of HIV replication. The mechanism for some cytokines such as
CCL14 and SDF-1 is at least partially mediated through blocking of HIV coreceptors. We
also found that the combination of cytokines we identified increased CD69 expression
and decreased CXCR4 expression at 24 h post-HIV infection and increased CCR5 and
decreased CXCR4 and CCR7 expression at 6 days postinfection
in vitro
. Decreased
CXCR4 expression would protect against infection with X4 virus, consistent with an
anti-HIV effect of the combined cytokines. The early upregulation of CD69 and later
upregulation of CCR5 imply activation of host CD4
⫹T cells in response to the cytokines,
which is typically thought to make cells more susceptible to HIV infection (58).
However, if this activation were associated with enhanced cell-intrinsic immunity, the
deleterious effects of cellular activation could be balanced by intracellular blockade of
viral replication. Finally, the later downregulation of CCR7 could affect T cell migration
to lymph nodes. Given the fact that residual viral replication in ECs appears to be
concentrated in lymph node CD4
⫹T follicular helper and memory cells (59), the
interaction between CCL21 and CCR7 could be important in maintaining the EC
phenotype.
We found that the combination of cytokines studied increased expression of the
restriction factors IFITM1 and IFITM2 while it decreased expression of RNase L and
SAMHD1. Our
in vitro
infection data point to increased resistance of cells to HIV
infection after exposure to the combination of cytokines studied though it is not clear
what the relative effects of increasing some restriction factors and decreasing others
would have
in vivo
. The interferon-induced transmembrane proteins were recently
shown to suppress HIV replication (60). IFITM2, but not IFITM1, impedes HIV entry into
cells, and neither protein affects cell proliferation or CD4 cell surface expression though
the intracellular moiety of IFITM1 is required for anti-HIV activity (60). More recently it
has been shown that IFITMs, particularly IFITM2 and IFITM3, colocalize with Env and
Gag proteins and can be incorporated into nascent virions, which can impair fusion to
target cells (61, 62). IFITMs have relatively modest HIV-suppressive activity, and it is
hypothesized that these proteins act in part by interfering with viral protein production
on November 7, 2019 by guest
http://jvi.asm.org/
(63). The NL4-3 strain of HIV has been reported to be resistant to inhibition by
full-length but not C-terminally truncated IFITM1, potentially due to differential cellular
localization of the two IFITM1 protein species (64). HIV can mutate Vpu and Env genes
to increase cell-to-cell transmission and avoid IFITM1 restriction (65). Finally, IFITM1
expression has been shown to be elevated in CD4
⫹T cells from HIV-infected subjects,
and the percentage of activated CD4
⫹CD38
⫹HLA-DR
⫹T cells from elite controllers
correlates strongly with IFITM1 expression (66). How IFITMs mediate HIV suppression is
an area of active research, and the combination of cytokines elevated in ECs provides
a second mechanism in addition to IFN-
␣
for induction of these HIV restriction factors.
In conclusion, the current study identified four cytokines elevated in ECs but not
NCs, in addition to SDF-1, which was elevated in ECs compared to levels in NCs. These
cytokines can modulate CD4
⫹T cell activation, HIV coreceptor expression, and
expres-sion of the HIV restriction factors IFITM1, IFITM2, RNase L, and SAMHD1. Of note,
incubation of target cells with the combination of cytokines studied resulted in more
potent suppression of HIV replication than incubation with individual cytokines at
the same doses. The data presented here provide a rationale for preclinical testing of
these cytokines in animal models of HIV, particularly for studying combinations of
cytokine therapies. Understanding the cytokine profile associated with control of HIV
could be critical to establishing post-ART suppression of viral replication in designing
a functional cure for HIV. Furthermore, the cytokine profile we identified has
implica-tions for evaluation of responses induced by preventive and therapeutic HIV vaccines.
MATERIALS AND METHODS
Sample selection. Two or more serum samples for each subject were tested, with the samples chosen near the beginning and end of the period of clinical interest (i.e., during the period of elite control for the EC group, during the period of undetectable viremia for the ART group, and during a period of the highest-level viremia for the NC group). Study participants for each clinical group were drawn from the 1994-1995 and 2001-2002 enrollment waves of the Women’s Interagency HIV Study (WIHS), a multisite cohort study of HIV among U.S. women. Participants for the current study were chosen from a total of 3,766 WIHS participants to match the three study groups with regard to ethnicity, age, body mass index, HCV antibody status at study entry, and duration of follow-up in the cohort (within 1 year). HIV noncontrollers ([NCs]n⫽42; median of 3 time points/subject) were antiretroviral therapy naive and had a viral load of⬎2,000 RNA copies/ml for at least one of two time points separated by 6 months. Elite controllers ([ECs],n⫽73; median of 7 time points/subject) had undetectable HIV RNA (ⱕ80 copies/ml) for at least 2 years, were clinically AIDS free, had minimal prior exposure to ART, and had no more than one viral load blip of 80 to 1,000 copies/ml allowed per episode, but not at either of the two end visits of the suppression episode. There were five ECs who were pregnant during eight time points during the study; there were no differences between values for the pregnant and nonpregnant time points. Patients with ART-suppressed HIV ([ART]n⫽42; median of 3 time points/subject) had an undetectable viral load (⬍80 RNA copies/ml) for at least 12 months while on a potent combination antiretroviral regimen. HIV-uninfected women ([NEG]n⫽48; median of 3 time points/subject) in the WIHS underwent the same follow-up procedures as the HIV-infected women and had HIV serology performed every 6 months. Finally, a sample was analyzed from 11 additional female ECs from the SCOPE cohort at UCSF. All participants provided informed consent for study participation per human subject protection protocols approved by all participating institutions.
Multiplex cytokine and chemokine analysis.Serum samples were assayed using a high-sensitivity MilliPlex kit (Millipore, Billerica, MA) for interleukin-1(IL-1), IL-2, IL-4, IL-5, IL-6, IL-7, IL-8, IL-10, IL-12p70, IL-13, IFN-␥, granulocyte-macrophage colony-stimulating factor (GM-CSF), and TNF-␣. A standard-sensitivity Milliplex Map kit (Millipore) was used to test endothelial growth factor (EGF), fibroblast growth factor 2 (FGF-2), fractalkine, IL-1␣, IL-1 receptor antagonist (IL-1Ra), IL-9, IL-12p40, IL-15, IL-17, interferon induced protein 10 (IP-10), monocyte chemotactic protein 1 (MCP-1), MCP-3, monocyte-derived chemo-kine (MDC), macrophage inflammatory protein 1␣, (MIP-1␣), MIP-1, soluble IL-2 receptor alpha (sIL-2R␣), tumor necrosis factor beta (TNF-), and vascular endothelial growth factor (VEGF). A standard-sensitivity Panel II kit (Millipore) was used to test CCL8/MCP-2, CCL13/MCP-4, CXCL5/human neutrophil-activating peptide (ENA-78), CXCL12/stromal-derived factor 1␣/(SDF-1␣/), CXCL13/B-cell attracting chemokine 1 (BCA-1), CCL1/I-309, IL-16, CCL15/MIP-1␦, CCL17/thymus and activation-regulated chemokine (TARC), CCL21/6Ckine, CCL24/eotaxin-2, CCL26/eotaxin-3, CCL27/cutaneous T cell attracting chemokine (CTACK), IL-23, leukemia inhibitory factor (LIF), thrombopoiesis stimulating factor (TPO), TNF-related apoptosis-inducing ligand (TRAIL), stromal cell-derived cytokine (SCF), thymic stromal lymphopoietin (TSLP), IL-20, IL-21, IL-28A, and IL-33. A standard-sensitivity Panel III kit (Millipore) was used to test macrophage colony-stimulating factor (M-CSF), CXCL9/monokine induced by gamma (MIG), neutrophil attractant protein (NAP), CXCL6/granulocyte chemotactic protein 2 (GCP-2), CXCL11/interferon-inducible T cell alpha chemoattractant (I-TAC), CCL14/hemofiltrate CC-chemokine 1 (HCC-1), CXCL19/MIP-3, CCL20, MIP-3␣, CL1/lymphotactin, IL-11, and IL-29/IFN-1. Soluble receptors were sCD30, sVEGF-R3, sVEGF-R2, sVEGF-R1, sTNFRII, sTNFRI, sRAGE (soluble receptor for advanced glycation end products), sIL-6R, sIL-4R,
on November 7, 2019 by guest
http://jvi.asm.org/
sIL-2R␣, sIL-1RII, sIL-1RI, sgp130, and sEGFR. Standards and samples were tested in duplicate. Beads were acquired on a Labscan analyzer (Luminex) using Bio-Plex manager, version 6.1, software (Bio-Rad). Values that were determined to be out of range (OOR) low were assigned a value 1/2 the lowest standard. Values that were determined to be OOR high were assigned a value 2 times the highest standard. Values that were extrapolated beyond the standard curve were assigned the determined value.
Viruses, cells, and reagents.Clonal virus stocks were generated by transfection of 4⫻106293T cells with 10g of plasmid DNA from HIV molecular clones NL4-3 and 81.A. Transfections were carried out using Fugene 6 (Roche) at a ratio of 1.5l of Fugene per 1g of DNA according to the manufacturer’s directions. Culture supernatants were harvested at 48 h postinfection, centrifuged to remove cell debris, aliquoted, and stored at⫺80°C until use. The 50% tissue culture infective dose (TCID50) of each virus stock was determined in MT-2 cells expressing high levels of CCR5 (MT-2-CCR5hi). MT-2-CCR5hicells were maintained at log phase in RPMI 1640 medium (UCSF-Cell Culture Facility [CCF]) supplemented with 20% heat-inactivated fetal calf serum (HyClone), 12 mM HEPES (UCSF-CCF), and penicillin-streptomycin (UCSF-CCF) (R20). Apheresis filters from three donors were purchased from Blood Centers of the Pacific (BCP), and PBMCs were isolated, frozen, and maintained in liquid N2. The cytokines SDF-1, CCL21, XCL1, CCL27 (R&D Systems), and CCL14 (Peprotech) were resuspended at 100g/ml in phosphate-buffered saline (PBS) with carrier protein, aliquoted for single use, and stored at⫺80°C until use. Cytokines were used in assays at a 0.5-g/ml final concentration based on the manufacturer’s recommended concen-tration and/or on ticoncen-tration data for suppression of HIV replication.
Infection and virus culture assay.PBMCs from donors were depleted of CD8⫹T cells via CD8 positive-selection kits (Stem Cell Technologies), pooled, and infected with X4 (pNL4-3) or R5 (81-A) at a multiplicity of infection (MOI) of 10⫺2for 2 h. Following infection, cells were washed and seeded into 96-well culture dishes at 1⫻106cell/ml in R20 medium with 50 IU/ml recombinant human IL-2 (rhIL-2) and incubated in the presence or absence of the cytokines of interest (0.5g/ml). On day 3, cells were washed and replenished with fresh medium and the cytokines of interest without IL-2 (for IL-2 treatment, 200 IU/ml rhIL-2 was used). Following culture, cell viability was determined with acridine orange and propidium iodide labeling using an Auto X4 cell counter (Nexcelom Bioscience). Supernatants were harvested and maintained at⫺80°C until analysis for HIV p24 by ELISA. Infection supernatants were measured for p24 using the HIV-1 p24 antigen capture ELISA (Applied Bioscience Laboratories) according to the manufacturer’s instructions.
Immunophenotyping.For immunophenotyping, PBMCs were cultured at 2⫻106cells/ml with the cytokines of interest for 3, 6, and 24 h. Following incubation, cells were washed with PBS and pelleted. Cells were first labeled with Aqua Amine viability dye (Invitrogen) for 30 min and then subsequently labeled with CD3-phycoerythrin (PE), CD4-AF700, CD8-allophycocyanin (APC)-Cy7, CCR5-AF647, CCR7-PE-Cy7, CXCR4-peridinin chlorophyll protein (PerCP) Cy5.5, CD38-BV421, HLA-DR-fluorescein isothiocya-nate (FITC) (all from Biolegend), and CD69-PE-CF594 (BD Biosciences) for 20 min. Cells were fixed in stabilizing fixative (BD Biosciences), acquired on an LSRII instrument (BD Biosciences), and analyzed with FlowJo software (TreeStar). Alternatively, cells were infected as described above and cultured for 1 or 6 days prior to immunophenotyping.
Restriction factor qPCR array.CD4⫹T cells from cryopreserved donor PBMCs were isolated using EasySep human CD4⫹T cell negative-selection kits (Stem Cell Technologies) according to the manufac-turer’s instructions. CD4⫹T cells were cultured overnight with cytokines of interest. Total RNA was extracted from cells using Qiazol reagent from an miRNeasy minikit (Qiagen) with an on-column DNase treatment option using a Qiagen RNase-Free DNase Set. DNase-treated clean RNA was transcribed into cDNA using random primers and a SuperScript VILO cDNA synthesis kit (Invitrogen) according to the manufacturer’s instructions. A custom-made TaqMan low-density array (TLDA) from Applied Biosystems was implemented to measure the mRNA expression of a comprehensive panel of 35 restriction factors with published, direct evidence of inhibitory activity against HIV-1in vitro. Thermal cycling was per-formed using an ABI ViiA 7 real-time PCR system. Up to 450 ng of cDNA in 200l of Applied Biosystems TaqMan Universal PCR master mix with uracylN-glycosylase (UNG) was loaded onto the designated ports of the TLDA plates. Data were analyzed using the Applied Biosystems ViiA 7 software. A panel of six housekeeping genes was included in the TLDA plates (glyceraldehyde-3-phosphate dehydrogenase [GAPDH], 18S, ACTB, PPIA, RPLP0, and UBC). RPLP0 (60S acidic ribosomal protein P0) was identified as the most stably expressed gene from the six housekeeping genes among all samples using the GeNorm algorithm (67). Therefore, raw cycle threshold (CT) numbers of amplified gene products were normalized to the value for the housekeeping gene RPLP0 to control for cDNA input amounts. Fold induction was determined using the comparativeCTmethod (67).
Quantitative PCR measurement of IFITM1 and IFITM2 mRNA expression.CD4⫹T cells from 12 cryopreserved donor PBMCs were isolated as above and cultured for 24 h with IFN-␣(5 IU/ml; R&D Systems) or combined cytokines (0.5g/ml). Following culture, cells were lysed, and total RNAs were extracted from the cells using an Allprep DNA/RNA/miRNA universal kit (Qiagen) with on-column DNase treatment (RNase-Free DNase Set; Qiagen). RNA was transcribed into cDNA using a SuperScript VILO cDNA Synthesis kit (Invitrogen). Quantitative real-time PCR measuring interferon-inducible transmem-brane protein 1 (IFITM1) and -2 using TaqMan real-time PCR was performed using the ABI ViiA 7 real-time PCR system. Fold induction was determined using the comparativeCTmethod as indicated above.
Western blotting.CD4⫹T cells from cryopreserved PBMCs were isolated by negative selection (Stem Cell Technologies) and then cultured for 72 h with IFN-␣, single cytokines, or combined cytokines. Following culture, cell lysates were prepared using radioimmunoprecipitation assay (RIPA) buffer (ThermoFisher Scientific) supplemented with Complete protease inhibitor (ThermoFisher Scientific). Lysates were homogenized by sonication using a Branson Sonifier 150 (Branson Ultrasonics Corp.), and
on November 7, 2019 by guest
http://jvi.asm.org/
protein was quantified by a Pierce bicinchoninic acid (BCA) protein assay kit (ThermoFisher Scientific). In brief, lysates were resolved on bis-Tris minigels and transferred overnight at 4°C onto Immobilon-FL polyvinylidene difluoride (PVDF) membranes (EMD Millipore) using an X-Cell Sure-Lock Western blot system (Life Technologies). Blocking and antibody incubation steps were performed using Odyssey blocking buffer (Li-Cor). IFITM1 and -2 (catalog numbers 13126 and 13530, respectively; Cell Signaling Technologies) primary antibodies were incubated for 2 h at 25°C. After membranes were washed in PBS plus 0.1% Tween 20 (PBS-T), they were incubated with Li-Cor infrared secondary antibodies for 45 min at 25°C. After further washing steps, images were obtained using a Li-Cor Odyssey scanner and quantified using Li-Cor Image Studio software. Where stripping steps were necessary, membranes were incubated for 5 min with Li-Cor Newblot PVDF stripping buffer.
Statistical analysis.For participants with data available from two or more time points (all but the three of the ART subjects noted above), median cytokine levels were calculated for the time points for analysis to minimize the effect of sample-to-sample variation on the association of cytokine levels with clinical group. For analyses of cytokine level correlations with viral load or CD4⫹T cell count, the observations from each subject were not averaged. Cytokine and viral load values were log transformed prior to analysis due to nonnormal distribution of the data. Differences in subject characteristics between groups were evaluated by analysis of variance (ANOVA) for continuous variables (Kruskal-Wallis/Mann-Whitney U).Pvalues were adjusted by FDR (false discovery rates) by the Benjamini-Hochberg controlling procedure, a commonly used method for analysis of large sets of biological data (68). Statistical significance was defined as a Pvalue of⬍0.05 and FDR of⬍0.1. Linear regression analysis was performed, and correlations were determined by Spearman and adjusted by FDR. R/Bioconductor software was utilized for analyses. For cytokines detected in fewer than 50% of subjects, comparisons across clinical groups were performed using the chi-square test using GraphPad Prism software. For viral infectivity and immunophenotyping, significant differences were determined by 2-by-3 ANOVA of results versus medium control and unstimulated values, respectively. For mRNA expression of IFITM1/2, significant differences were determined by repeated-measures ANOVA with Bonferroni’s multiple-comparison test.
ACKNOWLEDGMENTS
We thank the participants of the Women’s Interagency HIV Study (WIHS) and SCOPE
cohorts for their continued contributions to these studies. Data in the manuscript were
collected by the WIHS.
The contents of this publication are solely the responsibility of the authors and do
not represent the official views of the National Institutes of Health (NIH).
REFERENCES
1. Roberts L, Passmore JA, Williamson C, Little F, Bebell LM, Mlisana K, Burgers WA, van Loggerenberg F, Walzl G, Siawaya JF, Karim QA, Karim SS. 2010. Plasma cytokine levels during acute HIV-1 infection predict HIV disease progression. AIDS 24:819 – 831. https://doi.org/10.1097/ QAD.0b013e3283367836.
2. Schieffer M, Jessen HK, Oster AF, Pissani F, Soghoian DZ, Lu R, Jessen AB, Zedlack C, Schultz BT, Davis I, Ranasinghe S, Rosenberg ES, Alter G, Schumann RR, Streeck H. 2014. Induction of Gag-specific CD4 T cell responses during acute HIV infection is associated with improved viral control. J Virol 88:7357–7366.https://doi.org/10.1128/JVI.00728-14. 3. Schnittman SM, Greenhouse JJ, Psallidopoulos MC, Baseler M, Salzman
NP, Fauci AS, Lane HC. 1990. Increasing viral burden in CD4⫹T cells from patients with human immunodeficiency virus (HIV) infection reflects rapidly progressive immunosuppression and clinical disease. Ann Intern Med 113:438 – 443.https://doi.org/10.7326/0003-4819-113-6-438. 4. Borrow P, Lewicki H, Hahn BH, Shaw GM, Oldstone MB. 1994.
Virus-specific CD8⫹cytotoxic T-lymphocyte activity associated with control of viremia in primary human immunodeficiency virus type 1 infection. J Virol 68:6103– 6110.
5. Koup RA, Safrit JT, Cao Y, Andrews CA, McLeod G, Borkowsky W, Farthing C, Ho DD. 1994. Temporal association of cellular immune responses with the initial control of viremia in primary human immunodeficiency virus type 1 syndrome. J Virol 68:4650 – 4655.
6. Giorgi JV, Hultin LE, McKeating JA, Johnson TD, Owens B, Jacobson LP, Shih R, Lewis J, Wiley DJ, Phair JP, Wolinsky SM, Detels R. 1999. Shorter survival in advanced human immunodeficiency virus type 1 infection is more closely associated with T lymphocyte activation than with plasma virus burden or virus chemokine coreceptor usage. J Infect Dis 179: 859 – 870.https://doi.org/10.1086/314660.
7. Bofill M, Mocroft A, Lipman M, Medina E, Borthwick NJ, Sabin CA, Timms A, Winter M, Baptista L, Johnson MA, Lee CA, Phillips AN, Janossy G. 1996. Increased numbers of primed activated CD8⫹CD38⫹CD45RO⫹T
cells predict the decline of CD4⫹T cells in HIV-1-infected patients. AIDS 10:827– 834.https://doi.org/10.1097/00002030-199607000-00005. 8. Kuller LH, Tracy R, Belloso W, De Wit S, Drummond F, Lane HC,
Led-ergerber B, Lundgren J, Neuhaus J, Nixon D, Paton NI, Neaton JD. 2008. Inflammatory and coagulation biomarkers and mortality in patients with HIV infection. PLoS Med 5:e203. https://doi.org/10.1371/journal .pmed.0050203.
9. Bisset LR, Cone RW, Huber W, Battegay M, Vernazza PL, Weber R, Grob PJ, Opravil M. 1998. Highly active antiretroviral therapy during early HIV infection reverses T-cell activation and maturation abnormalities. Swiss HIV Cohort Study. AIDS 12:2115–2123.
10. Keating SM, Golub ET, Nowicki M, Young M, Anastos K, Crystal H, Cohen MH, Zhang J, Greenblatt RM, Desai S, Wu S, Landay AL, Gange SJ, Norris PJ. 2011. The effect of HIV infection and HAART on inflammatory bio-markers in a population-based cohort of women. AIDS 25:1823–1832.
https://doi.org/10.1097/QAD.0b013e3283489d1f.
11. Allers K, Hutter G, Hofmann J, Loddenkemper C, Rieger K, Thiel E, Schneider T. 2011. Evidence for the cure of HIV infection by CCR5Δ32/ Δ32 stem cell transplantation. Blood 117:2791–2799.https://doi.org/ 10.1182/blood-2010-09-309591.
12. Cockerham LR, Hatano H, Deeks SG. 2016. Post-treatment controllers: role in HIV “cure” research. Curr HIV/AIDS Rep 13:1–9.https://doi.org/ 10.1007/s11904-016-0296-x.
13. Barker E, Mackewicz CE, Reyes-Teran G, Sato A, Stranford SA, Fujimura SH, Christopherson C, Chang SY, Levy JA. 1998. Virological and immu-nological features of long-term human immunodeficiency virus-infected individuals who have remained asymptomatic compared with those who have progressed to acquired immunodeficiency syndrome. Blood 92:3105–3114.
14. Hatano H, Delwart EL, Norris PJ, Lee TH, Dunn-Williams J, Hunt PW, Hoh R, Stramer SL, Linnen JM, McCune JM, Martin JN, Busch MP, Deeks SG. 2009. Evidence for persistent low-level viremia in individuals who
on November 7, 2019 by guest
http://jvi.asm.org/
trol human immunodeficiency virus in the absence of antiretroviral therapy. J Virol 83:329 –335.https://doi.org/10.1128/JVI.01763-08. 15. Owen RE, Heitman JW, Hirschkorn DF, Lanteri MC, Biswas HH, Martin
JN, Krone MR, Deeks SG, Norris PJ. 2010. HIV⫹elite controllers have low HIV-specific T-cell activation yet maintain strong, polyfunctional T-cell responses. AIDS 24:1095–1105. https://doi.org/10.1097/ QAD.0b013e3283377a1e.
16. Iversen AK, Shpaer EG, Rodrigo AG, Hirsch MS, Walker BD, Sheppard HW, Merigan TC, Mullins JI. 1995. Persistence of attenuated rev genes in a human immunodeficiency virus type 1-infected asymptomatic individ-ual. J Virol 69:5743–5753.
17. Michael NL, Chang G, d’Arcy LA, Ehrenberg PK, Mariani R, Busch MP, Birx DL, Schwartz DH. 1995. Defective accessory genes in a human immu-nodeficiency virus type 1-infected long-term survivor lacking recover-able virus. J Virol 69:4228 – 4236.
18. Blankson JN, Bailey JR, Thayil S, Yang HC, Lassen K, Lai J, Gandhi SK, Siliciano JD, Williams TM, Siliciano RF. 2007. Isolation and characteriza-tion of replicacharacteriza-tion-competent human immunodeficiency virus type 1 from a subset of elite suppressors. J Virol 81:2508 –2518.https://doi.org/ 10.1128/JVI.02165-06.
19. Bailey JR, O’Connell K, Yang H-C, Han Y, Xu J, Jilek B, Williams TM, Ray SC