NS1 Protein Mutation I64T Affects Interferon Responses and
Virulence of Circulating H3N2 Human Influenza A Viruses
Marta L. DeDiego,a,bAitor Nogales,bKris Lambert-Emo,a,bLuis Martinez-Sobrido,b David J. Tophama,b
David H. Smith Center for Vaccine Biology and Immunologyaand Department of Microbiology and Immunology,bUniversity of Rochester, Rochester, New York, USA
ABSTRACT
Influenza NS1 protein is the main viral protein counteracting host innate immune responses, allowing the virus to efficiently
replicate in interferon (IFN)-competent systems. In this study, we analyzed NS1 protein variability within influenza A (IAV)
H3N2 viruses infecting humans during the 2012-2013 season. We also evaluated the impact of the mutations on the ability of
NS1 proteins to inhibit host innate immune responses and general gene expression. Surprisingly, a previously unidentified
mu-tation in the double-stranded RNA (dsRNA)-binding domain (I64T) decreased NS1-mediated general inhibition of host protein
synthesis by decreasing its interaction with cleavage and polyadenylation specificity factor 30 (CPSF30), leading to increased
innate immune responses after viral infection. Notably, a recombinant A/Puerto Rico/8/34 H1N1 virus encoding the H3N2
NS1-T64 protein was highly attenuated in mice, most likely because of its ability to induce higher antiviral IFN responses at early
times after infection and because this virus is highly sensitive to the IFN-induced antiviral state. Interestingly, using peripheral
blood mononuclear cells (PBMCs) collected at the acute visit (2 to 3 days after infection), we show that the subject infected with
the NS1-T64 attenuated virus has diminished responses to interferon and to interferon induction, suggesting why this subject
could be infected with this highly IFN-sensitive virus. These data demonstrate the importance of influenza virus surveillance in
identifying new mutations in the NS1 protein, affecting its ability to inhibit innate immune responses and, as a consequence, the
pathogenicity of the virus.
IMPORTANCE
Influenza A and B viruses are one of the most common causes of respiratory infections in humans, causing 1 billion infections
and between 300,000 and 500,000 deaths annually. Influenza virus surveillance to identify new mutations in the NS1 protein
af-fecting innate immune responses and, as a consequence, the pathogenicity of the circulating viruses is highly relevant. Here, we
analyzed amino acid variability in the NS1 proteins from human seasonal viruses and the effect of the mutations in innate
im-mune responses and virus pathogenesis. A previously unidentified mutation in the dsRNA-binding domain decreased
NS1-me-diated general inhibition of host protein synthesis and the interaction of the protein with CPSF30. This mutation led to
in-creased innate immune responses after viral infection, augmented IFN sensitivity, and virus attenuation in mice. Interestingly,
using PBMCs, the subject infected with the virus encoding the attenuating mutation induced decreased antiviral responses,
sug-gesting why this subject could be infected with this virus.
I
nfluenza A (IAV) and B (IBV) viruses are members of the
Orthomyxoviridae
family responsible for seasonal epidemics and
occasional pandemics, being one of the most common causes of
respiratory infections in humans (
1
). IAVs are further classified in
different subtypes according to the two major surface
glycopro-teins, hemagglutinin (HA; 1 to 17) and neuraminidase (NA; 1 to
9). In humans, the most frequent seasonal subtypes of IAVs are
H3N2 and H1N1, and there are two lineages (Yamagata and
Vic-toria) of IBVs. Seasonal IAV H1N1 and H3N2 have been
cocircu-lating since 1977 (
1
). Despite comprehensive vaccination
pro-grams, the WHO estimates that the global disease burden from
seasonal influenza results in 1 billion infections, with 3 to 5 million
cases of severe disease and between 300,000 and 500,000 deaths
annually (
2
).
The defense mechanisms provided by the innate immune
sys-tem restrict influenza virus replication (
3
). Virus-specific patterns
(pathogen-associated molecular patterns [PAMPs]) are
recog-nized in infected cells by pattern recognition receptors (PRRs),
which initiate signaling pathways leading to the production of
type I and III interferons (IFNs) and proinflammatory cytokines
(
3
). Influenza virus is recognized by the membrane-associated
PRR Toll-like receptors (TLRs) 3 (double-stranded RNA
[dsRNA]), 7, and 8 (single-stranded RNA [ssRNA]) and by the
cytoplasmic PRR retinoic acid-inducible gene I (RIG-I) and the
NOD-like receptor family member LRR and pyrin domain
con-taining-3 (NLRP3) (
3
). The consequence of these downstream
signaling pathways is the activation of transcription factors, such
as interferon-regulatory factor 3 (IRF3), NF-
B, and activating
transcription factor (ATF)-2/c-Jun, which are responsible for the
Received26 May 2016Accepted7 August 2016
Accepted manuscript posted online17 August 2016
CitationDeDiego ML, Nogales A, Lambert-Emo K, Martinez-Sobrido L, Topham DJ. 2016. NS1 protein mutation I64T affects interferon responses and virulence of circulating H3N2 human influenza A viruses. J Virol 90:9693–9711. doi:10.1128/JVI.01039-16.
Editor:S. Schultz-Cherry, St. Jude Children’s Research Hospital
Address correspondence to David J. Topham, [email protected].
Supplemental material for this article may be found athttp://dx.doi.org/10.1128 /JVI.01039-16.
Copyright © 2016 DeDiego et al. This is an open-access article distributed under the terms of theCreative Commons Attribution 4.0 International license.
on November 7, 2019 by guest
http://jvi.asm.org/
transcription of type I (IFN-
␣
and IFN-

) and type III (IFN-
)
IFNs (
3–5
). Secreted type I and III IFNs act in a paracrine and/or
autocrine fashion and induce the expression of hundreds of
IFN-stimulated genes (ISGs), many of which possess antiviral activity
(
3
,
5
,
6
).
Influenza virus NS1 protein allows the virus to replicate
effi-ciently by suppressing the host innate immune responses by a
variety of mechanisms (reviewed in reference
7
). Accordingly,
in-fluenza viruses lacking the NS1 protein or expressing reduced
lev-els or truncated forms of the NS1 protein are severely impaired in
growth in type I IFN-competent cells and only show pathogenicity
in mice lacking key components of the type I IFN pathway (
8–11
).
These results indicate that influenza NS1 protein is the main viral
protein involved in type I IFN antagonism.
Mechanisms involved in the NS1 protein’s ability to counteract
innate immune responses include the inhibition of cellular
tran-scription elongation, blocking posttrantran-scriptional RNA
process-ing and nuclear export, decreasprocess-ing retinoic acid-inducible gene 1
(RIG-I) activation through sequestration of this RNA helicase and
its activating ligand (
12–14
) or through inhibition of tripartite
motif family 25 (TRIM25)-mediated RIG-I ubiquitination (
15
),
interfering with IFN signaling, and directly inhibiting specific
ISGs, such as protein kinase R (PKR) and RNase L, by binding to
dsRNA and PKR directly (reviewed in reference
7
). In addition,
NS1 proteins from some human IAVs bind to the 30-kDa subunit
of cleavage and polyadenylation specificity factor 30 (CPSF30),
blocking the processing of cellular mRNAs (
16–19
). The IAV NS1
binding site for CPSF30 is centered around amino acid 186. In
addition, amino acid residues 103 and 106 (
16
,
17
,
20
,
21
) as well
as 108, 125, and 189 (
22
) are important for NS1 binding. IAV NS1
protein also binds to the poly(A)-binding protein II (PABPII),
inhibiting the ability of PABPII to stimulate the synthesis of long
poly(A) tails (
23
). These two mechanisms block pre-mRNA
pro-cessing and the nuclear export of mRNAs (
24
), leading to a general
inhibition of host gene expression.
While much is known about the anti-type I IFN function of
NS1 proteins derived from avian and some pandemic IAVs (
17
,
21
,
22
,
25
), less is known about the diversity of NS1 in seasonal
human influenza viruses and its possible contribution to disease
severity. In this paper, we analyzed the NS1 protein sequences of
IAV circulating within the 2012-2013 season in the Rochester
(NY) area using nasal washes/swabs of different enrolled subjects.
The effect of the mutations found (E26K, I64T, and R224K) on the
ability of the NS1 protein to inhibit the type I IFN responses and
host gene expression was analyzed. A mutation at position 64
affected the ability of NS1 to inhibit host gene expression. The lack
of inhibition of host gene expression was due at least in part to the
lack of interaction with CPSF30. Moreover, I64T substitution in
NS1 affected virus growth, the ability to inhibit induction of type
I IFN
in vitro
and
in vivo
, the sensitivity of the virus to the antiviral
effect of type I IFN, and virus pathogenesis in mice. This is, to our
knowledge, the first time that a mutation in the dsRNA binding
domain of IAV NS1 affects CPSF30 binding and host protein
ex-pression, including the antiviral action of type I IFN. Moreover, a
virus containing the I64T mutation resulted in an attenuated
phe-notype in mice. Furthermore, PBMCs isolated from the subject
infected with the H3N2 IAV encoding the T64-NS1 protein
showed evidence of a defect in the induction of innate antiviral
responses. This deficiency in the ability to mount an effective
an-tiviral response may account for the ability of the IFN-deficient
virus to efficiently replicate in this and possibly other similar
sub-jects.
MATERIALS AND METHODS
Cells.Human embryonic kidney (293T; ATCC CRL-11268), human lung epithelial carcinoma (A549; ATCC CCL-185), African green monkey kid-ney epithelial (Vero; ATCC CCL-81), and canine kidkid-ney epithelial (MDCK; ATCC CCL-34) cells were grown at 37°C in air enriched with 5% CO2using Dulbecco’s modified Eagle’s medium (DMEM; Gibco) supple-mented with 10% fetal bovine serum (Gibco), 100 U/ml penicillin, 0.1 mg/ml streptomycin, and 50g/ml gentamicin (Gibco).
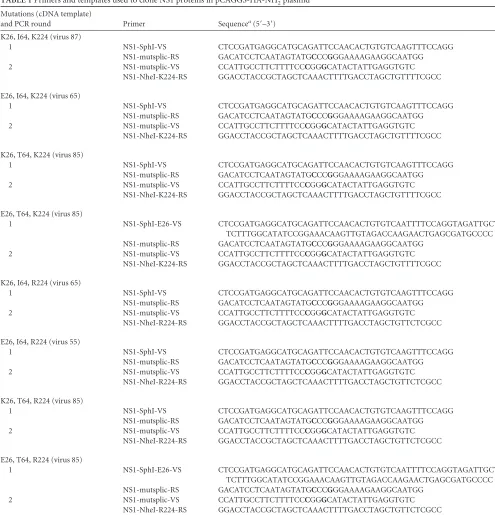
Plasmids.Polymerase II expression pCAGGS plasmids (26) contain-ing NS1 sequences fused to an HA epitope tag (YPYDVPDYA) at the N terminus (13) were obtained using the oligonucleotides indicated inTable 1. To abolish NS mRNA splicing, two silent mutations were introduced at nucleotides (nt) 501 and 504 of NS1 (highlighted in boldface inTable 1). RNAs were extracted from nasal washes/swabs from patients 54FUR0055 (designated 55), 54FUR0065 (65), 54FUR0085 (85), and 54FUR0087 (87). Reverse transcription (RT) reactions were performed at 37°C for 2 h using the high-capacity cDNA transcription kit (Applied Biosystems) and an oligo(dT) primer to obtain the complementary DNAs (cDNAs). Over-lapping PCRs using the Pfx polymerase (Invitrogen) and primers and template cDNAs described inTable 1were used to amplify the viral NS1 protein. PCR products were cloned in the pCAGGS-HA NH2 expression plasmid (13) using SphI and NheI restriction enzymes. Plasmids (pCAGGS) encoding the NS1 proteins of influenza A/PuertoRico/8/34 (PR8) and influenza A/BrevigMission/01/1918 (1918) H1N1 viruses were previously described (13,17).
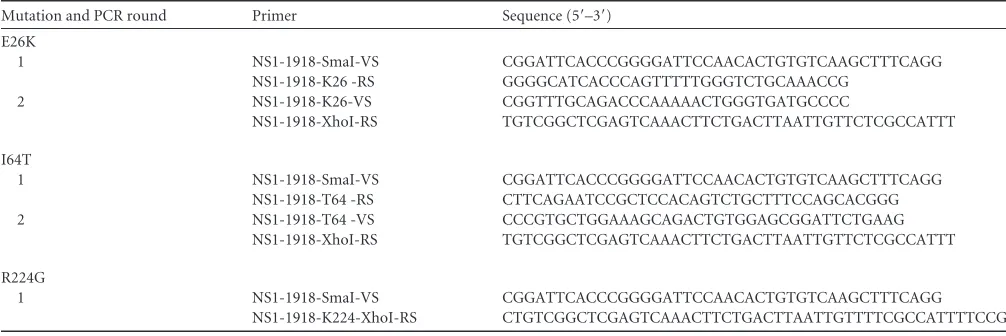
To introduce mutations E26K, I64T, and R224K into the NS1 protein of 1918 NS1, overlapping PCRs were performed using the primers de-scribed inTable 2, using as the template the pCAGGS-HA NH2 NS1-1918 plasmid (17). PCR products were digested with SmaI and XhoI and cloned into pCAGGS-HA NH2 (13). The integrity of the amplified PCR product was confirmed by sequencing (Genewiz).
Plasmids encoding NS1 variants under the control of the phage T7 polymerase were obtained by subcloning NS1 from the pCAGGS-HA NH2 plasmids into pcDNA3 plasmid using EcoRI and XbaI restriction enzymes. pcDNA3 plasmids encoding PR8 and 1918 NS1 proteins have been described previously (17).
The NS1 genes of IAV H3N2 85 and 87 were cloned in the previously described pDZ plasmid encoding nonoverlapping NS1 and NEP open reading frames (ORFs) (pDZ-NSs) (27). NS1 ORFs were amplified by PCR using primers NS1-EcoRI-H3N2-VS (5=-GGCTGAATTCGAGCTC GGTACCCGGGGATCCTCTAGACCGGAGTACTGGTCGACCTCCG AAGTTGGGGGGGAGCAAAAGCAGGGTGACAAAGACATAATGGA TTCCAACACTGTGTCAAGC-3=, containing an EcoRI restriction site, the 5=end of pDZ plasmid, the 5=noncoding region [NCR], and first 24 nt of the NS1 ORF) and NS1-BsmBI-H3N2-RS (5=-CGCGCCGCTGCC AGAGACGCCAACTTCTGACCTAGCTGTTTTCGCC-3=, containing a BsmBI restriction site, the last 25 nt of the NS1 ORF, excluding the stop codon, and 18 nt of the porcine teschovirus [PTV] 2A autoproteolytic site). pCAGGS-HA NH2 plasmids encoding the different NS1 variants were used as templates. PCR products were digested with EcoRI and BsmBI restriction enzymes and cloned into the pDZ-NSs plasmid (27).
Virus titrations.IAV were titrated by immunofocus assay (fluores-cent focus units [FFU] per milliliter) in MDCK cells. Briefly, confluent plates of MDCK cells (96-well format; 5⫻104cells/well) were infected with 10-fold serial dilutions of tissue culture supernatants (TCS). At 8 h postinfection (hpi), cells were fixed and permeabilized using 4% formal-dehyde, 0.5% Triton X-100 in phosphate-buffered saline (PBS) for 20 min at room temperature. After washing with PBS, cells were incubated in blocking solution (2.5% bovine serum albumin [BSA] in PBS) for 1 h at room temperature, washed with PBS, and incubated with the IAV NP monoclonal antibody (MAb) NR 4282 (BEI Resources) diluted in 1% BSA for 2 h at 37°C. After washing with PBS, cells were incubated with a
on November 7, 2019 by guest
http://jvi.asm.org/
rescein isothiocyanate (FITC)-conjugated rabbit anti-mouse IgG second-ary antibody (Dako) diluted 1:1,000 in 1% BSA for 1 h at 37°C. IAV NP-positive cells were visualized and enumerated to determine the virus titer (FFU per milliliter) using a fluorescence microscope. Viral infections were performed in the presence of 1g/ml of tosylsulfonyl phenylalanyl chloromethyl ketone (TPCK)-treated trypsin (Sigma).
Vesicular stomatitis virus expressing green fluorescent protein (VSV-GFP) (28) was titrated by plaque assay (PFU per milliliter) in Vero cells. Confluent cell monolayers (12-well format; 3.75⫻105cells/well) were infected with 10-fold serial dilutions for 1 h at room temperature, overlaid
with agar, and incubated at 37°C. Viral plaques were visualized and counted 1 day postinfection (dpi) using crystal violet.
[image:3.585.40.535.71.586.2]Virus rescue.Cocultures (1:1) of 293T and MDCK cells in 6-well plates were cotransfected in suspension with 1g of the seven ambisense wild-type (WT) plasmids (pDZ-PB2, -PB1, -PA, -HA, -NP, -NA, and -M) of influenza A/Puerto Rico/8/34 H1N1 (kindly provided by A. Garcia-Sastre, Mount Sinai School of Medicine, NY) plus the ambisense split NS plasmids (pDZ-NSs) encoding the NS1 proteins of IAV 85 or 87 using DNA-IN (Molecular Transfer, Inc.) (29). At 12 h posttransfection (hpt), transfection medium was replaced with DMEM containing 0.3% BSA,
TABLE 1Primers and templates used to clone NS1 proteins in pCAGGS-HA-NH2plasmid Mutations (cDNA template)
and PCR round Primer Sequencea(5=–3=)
K26, I64, K224 (virus 87)
1 NS1-SphI-VS CTCCGATGAGGCATGCAGATTCCAACACTGTGTCAAGTTTCCAGG NS1-mutsplic-RS GACATCCTCAATAGTATGCCCGGGAAAAGAAGGCAATGG 2 NS1-mutsplic-VS CCATTGCCTTCTTTTCCCGGGCATACTATTGAGGTGTC
NS1-NheI-K224-RS GGACCTACCGCTAGCTCAAACTTTTGACCTAGCTGTTTTCGCC
E26, I64, K224 (virus 65)
1 NS1-SphI-VS CTCCGATGAGGCATGCAGATTCCAACACTGTGTCAAGTTTCCAGG NS1-mutsplic-RS GACATCCTCAATAGTATGCCCGGGAAAAGAAGGCAATGG 2 NS1-mutsplic-VS CCATTGCCTTCTTTTCCCGGGCATACTATTGAGGTGTC
NS1-NheI-K224-RS GGACCTACCGCTAGCTCAAACTTTTGACCTAGCTGTTTTCGCC
K26, T64, K224 (virus 85)
1 NS1-SphI-VS CTCCGATGAGGCATGCAGATTCCAACACTGTGTCAAGTTTCCAGG NS1-mutsplic-RS GACATCCTCAATAGTATGCCCGGGAAAAGAAGGCAATGG 2 NS1-mutsplic-VS CCATTGCCTTCTTTTCCCGGGCATACTATTGAGGTGTC
NS1-NheI-K224-RS GGACCTACCGCTAGCTCAAACTTTTGACCTAGCTGTTTTCGCC
E26, T64, K224 (virus 85)
1 NS1-SphI-E26-VS CTCCGATGAGGCATGCAGATTCCAACACTGTGTCAATTTTCCAGGTAGATTGCTT TCTTTGGCATATCCGGAAACAAGTTGTAGACCAAGAACTGAGCGATGCCCC NS1-mutsplic-RS GACATCCTCAATAGTATGCCCGGGAAAAGAAGGCAATGG
2 NS1-mutsplic-VS CCATTGCCTTCTTTTCCCGGGCATACTATTGAGGTGTC NS1-NheI-K224-RS GGACCTACCGCTAGCTCAAACTTTTGACCTAGCTGTTTTCGCC
K26, I64, R224 (virus 65)
1 NS1-SphI-VS CTCCGATGAGGCATGCAGATTCCAACACTGTGTCAAGTTTCCAGG NS1-mutsplic-RS GACATCCTCAATAGTATGCCCGGGAAAAGAAGGCAATGG 2 NS1-mutsplic-VS CCATTGCCTTCTTTTCCCGGGCATACTATTGAGGTGTC
NS1-NheI-R224-RS GGACCTACCGCTAGCTCAAACTTTTGACCTAGCTGTTCTCGCC
E26, I64, R224 (virus 55)
1 NS1-SphI-VS CTCCGATGAGGCATGCAGATTCCAACACTGTGTCAAGTTTCCAGG NS1-mutsplic-RS GACATCCTCAATAGTATGCCCGGGAAAAGAAGGCAATGG 2 NS1-mutsplic-VS CCATTGCCTTCTTTTCCCGGGCATACTATTGAGGTGTC
NS1-NheI-R224-RS GGACCTACCGCTAGCTCAAACTTTTGACCTAGCTGTTCTCGCC
K26, T64, R224 (virus 85)
1 NS1-SphI-VS CTCCGATGAGGCATGCAGATTCCAACACTGTGTCAAGTTTCCAGG NS1-mutsplic-RS GACATCCTCAATAGTATGCCCGGGAAAAGAAGGCAATGG 2 NS1-mutsplic-VS CCATTGCCTTCTTTTCCCGGGCATACTATTGAGGTGTC
NS1-NheI-R224-RS GGACCTACCGCTAGCTCAAACTTTTGACCTAGCTGTTCTCGCC
E26, T64, R224 (virus 85)
1 NS1-SphI-E26-VS CTCCGATGAGGCATGCAGATTCCAACACTGTGTCAATTTTCCAGGTAGATTGCTT TCTTTGGCATATCCGGAAACAAGTTGTAGACCAAGAACTGAGCGATGCCCC NS1-mutsplic-RS GACATCCTCAATAGTATGCCCGGGAAAAGAAGGCAATGG
2 NS1-mutsplic-VS CCATTGCCTTCTTTTCCCGGGCATACTATTGAGGTGTC NS1-NheI-R224-RS GGACCTACCGCTAGCTCAAACTTTTGACCTAGCTGTTCTCGCC a
Boldface nucleotides indicate silent mutations introduced to abolish NS mRNA splicing.
on November 7, 2019 by guest
http://jvi.asm.org/
antibiotics, and 1g/ml TPCK trypsin (Sigma). At 48 hpt, TCS were collected, clarified, and used to infect fresh MDCK cells. At 3 dpi, recom-binant viruses were plaque purified and scaled up in MDCK cells. Virus stocks were generated by infecting confluent 10-cm dishes of MDCK cells at a low multiplicity of infection (MOI) (0.001). Stocks were titrated by immunofocus assay (FFU/ml) on MDCK cells. The identity of the NS1 ORFs in the rescued viruses was confirmed by restriction analysis and sequencing (Genewiz).
Virus growth kinetics.To determine virus growth ratesin vitro, con-fluent monolayers of MDCK or A549 cells (24-well format; 2⫻105cells/ well) were infected in duplicate at low multiplicity of infection (MOI, 0.001). After 1 h of virus adsorption at room temperature, cells were washed and overlaid with DMEM containing 0.3% BSA, antibiotics, and TPCK-treated trypsin (1g/ml for MDCK cells and 0.25g/ml for A549 cells). In the experiments to measure IFN sensitivity, the medium also contained 2,000 U/ml of universal IFN-␣(Axxora). At the indicated times postinfection, TCS were collected and viral titers were determined by immunofocus assay (FFU/ml) as described above.
Bioassay to assess IFN production.To evaluate the effect of NS1 pro-tein on the induction of IFN mediated by Sendai virus (SeV) infection, triplicate wells (96-well plate format; 6⫻104cells/well) of human 293T cells were cotransfected (using calcium phosphate) with 100 ng/well of the pCAGGS-HA NH2 NS1 plasmids (or the empty plasmid as a control), 50 ng/well of plasmids expressing Firefly luciferase (Fluc) under the control of IFN-(pIFNB Fluc), or the IFN-stimulated response element (ISRE) (pISRE-Fluc) promoters (17), as well as 50 ng/well of a reporter plasmid carrying Renilla luciferase (Rluc) under the control of the constitutively active simian virus 40 (SV40) promoter (pRL-SV40) (Promega). At 24 hpt, cells were infected with SeV, Cantell strain (17), and 16 hpi cell cul-ture supernatants were collected. Viruses in TCS were inactivated by ex-posure to shortwave (254 nm) UV radiation for 40 min at a distance of 6 cm (11). Fresh human A549 cells (96-well plate format; 6⫻104cells/well in triplicate) were treated with the UV-inactivated TCS for 24 h and then infected (MOI, 0.001) with VSV-GFP for 16 h (11). GFP expression was analyzed under a fluorescence microscope.
To measure the levels of IFN produced by infected cells, confluent monolayers of MDCK cells (24-well plate format; 5⫻104cells/well in triplicate) constitutively expressing GFP and Fluc reporter genes under the control of the IFN-promoter (MDCK IFN--GFP-/IFN--Fluc) (30) were mock infected or infected (MOI, 4) with either r85 or r87 virus. At 12 hpi, activation of the IFN-promoter was determined by assessing GFP expression under a fluorescence microscope or by quantifying Fluc expression in cell lysates using a Promega luciferase reporter assay and a Lumicount luminometer. Influenza virus infection levels were evaluated by immunofluorescence using an anti-NP MAb (HB-65) as described
above. In addition, TCS of infected MDCK cells were collected and viruses were UV inactivated as previously described (11). Fresh MDCK cells seeded in 96-well plates were treated (in triplicate wells) with the UV-inactivated TCS for 24 h and then infected with Newcastle disease virus (NDV)-GFP (MOI, 5) (11). The GFP intensity was measured, at 14 hpi, with a microplate reader (DTX880; Beckman Coulter). GFP expression of mock-treated cells was considered to have a value of 100%. Mean values and standard deviations (SD) were calculated using Microsoft Excel soft-ware.
Deep-sequencing analysis of transcriptomes and virus genes.
MDCK cells were mock infected or infected at an MOI of 0.01 with viruses obtained from subjects 65 and 85. At 16 hpi, total RNAs were extracted using an RNeasy minikit (Qiagen) and further purified using an oligo(dT) column to obtain the cellular and viral mRNAs by following the manu-facturer’s recommendations. The mRNAs were subjected to deep se-quencing at the University of Rochester Genomics Research Center. Se-quence reads were cleaned according to a rigorous preprocessing workflow using Trimmomatic version 0.32 before mapping them to the canFam3.1 reference genome using SHRiMP2.2.3. Cufflinks2.0.2 was then used in conjunction with the canFam3.1 annotated genes to perform differential expression analysis. Differentially expressed genes were clas-sified according to Gene Ontology (GO) annotation using the DAVID software (31). Only genes with aPvalue of⬍0.05 and a fold change of ⬎1.5 were considered in the analysis. All sequence reads that did not align to the canFam3.1 genome were used as input to the Trinity assembler for each sample individually. The resulting contigs from each assembly were then compared (BLASTN 2.2.29⫹) against an influenza A/New York/ 392/2004 (H3N2) (PRJNA15622) reference to identify contigs derived from IAV. All of the ORFs of IAV genes were sequenced. To analyze influenza virus single-nucleotide polymorphisms (SNPs), bwa-0.7.12, samtools-1.3.1, and bcftools-1.3 software programs were used.
[image:4.585.40.543.77.245.2]Quantitative RT-PCR (qRT-PCR) of MDCK-infected cells.MDCK cells were mock infected or infected (MOI, 0.01) with viruses obtained from nasal washes/swabs from subjects 65 and 85, isolated from MDCK cells (32). At 24 hpi, total RNAs were extracted using an RNeasy minikit (Qiagen) by following the manufacturer’s recommendations. Reverse transcription (RT) reactions were performed at 37°C for 2 h using the high-capacity cDNA transcription kit and random hexamer oligonucleo-tides to generate cDNAs. Quantitative PCRs (qPCRs) were performed using TaqMan IFN-, IFN-induced protein with tetratricopeptide re-peats 2 (IFIT2), and CXCL10 gene expression assays (Applied Biosystems) specific for the Canis familiaris (dog) genes (Cf03644503_s1, Cf02645026_m1, and Cf02622529_m1, respectively). Quantification was achieved using the 2⫺⌬⌬CTmethod (33).
TABLE 2Primers and templates used to introduce mutations in pCAGGS-HA2-NH2-NS1-1918 Mutation and PCR round Primer Sequence (5=–3=)
E26K
1 NS1-1918-SmaI-VS CGGATTCACCCGGGGATTCCAACACTGTGTCAAGCTTTCAGG NS1-1918-K26 -RS GGGGCATCACCCAGTTTTTGGGTCTGCAAACCG
2 NS1-1918-K26-VS CGGTTTGCAGACCCAAAAACTGGGTGATGCCCC
NS1-1918-XhoI-RS TGTCGGCTCGAGTCAAACTTCTGACTTAATTGTTCTCGCCATTT
I64T
1 NS1-1918-SmaI-VS CGGATTCACCCGGGGATTCCAACACTGTGTCAAGCTTTCAGG NS1-1918-T64 -RS CTTCAGAATCCGCTCCACAGTCTGCTTTCCAGCACGGG 2 NS1-1918-T64 -VS CCCGTGCTGGAAAGCAGACTGTGGAGCGGATTCTGAAG
NS1-1918-XhoI-RS TGTCGGCTCGAGTCAAACTTCTGACTTAATTGTTCTCGCCATTT
R224G
1 NS1-1918-SmaI-VS CGGATTCACCCGGGGATTCCAACACTGTGTCAAGCTTTCAGG NS1-1918-K224-XhoI-RS CTGTCGGCTCGAGTCAAACTTCTGACTTAATTGTTTTCGCCATTTTCCG
on November 7, 2019 by guest
http://jvi.asm.org/
Inhibition of host protein expression.To evaluate the effect of IAV NS1 on host protein synthesis, confluent monolayers of human 293T cells (96-well plate format; 6⫻104cells/well in triplicate) were transiently cotransfected, using DNA-IN, with 200 ng/well of pCAGGS-HA NH2 NS1 expression plasmids, or the empty plasmid as a control, together with 50 ng/well of pCAGGS plasmids expressing GFP (17) and Gaussia lucif-erase (Gluc) (34). GFP and Gluc expression levels were measured 30 hpt using fluorescence microscopy and a Lumicount luminometer, respec-tively. For Gluc measurements, cell culture supernatants were mixed with an equal volume of Biolux Gaussia luciferase reagent (New England Bio-Labs).
Western blotting.Cells were lysed in passive lysis buffer (Promega), containing Laemmli sample buffer (Bio-Rad) and-mercaptoethanol and then boiled for 5 min before running 10% SDS-PAGE gels. Proteins were transferred to nitrocellulose membranes (Bio-Rad) and detected by Western blotting. Primary rabbit anti-HA (NS1) and anti-FLAG (CPSF30) polyclonal antibodies diluted 1:1,000 (H6908 and F7425, re-spectively; Sigma-Aldrich), MAb anti-actin diluted 1:2,000 (A1978; Sig-ma-Aldrich), and MAb anti-ISG15 diluted 1:200 (sc-166755; Santa Cruz Biotechnologies) were used, followed by incubation with a 1:1,000 dilu-tion of goat anti-rabbit and goat anti-mouse IgG antibodies conjugated to horseradish peroxidase (Sigma-Aldrich). Proteins were detected by chemiluminescence using the SuperSignal West Femto maximum-sensi-tivity substrate (Thermo Scientific) by following the manufacturer’s rec-ommendations.
Inhibition of IFN-and ISRE promoters.To evaluate the effect of NS1 protein on the inhibition of IFN-and ISRE promoters, triplicate wells of human 293T cells (96-well format; 6⫻104cells/well) were cotransfected with 100 ng/well of the pCAGGS-HA NH2 NS1 plasmids or the empty plasmid as a control, with 50 ng/well of plasmids expressing Fluc under the control of the IFN-(pIFNB-Fluc) or the ISRE (pISRE-Fluc) promoters (17) and with 50 ng/well of a reporter plasmid carrying the Rluc gene under the control of the constitutively active SV40 promoter (pRL-SV40) (Promega) using the calcium phosphate method. At 24 hpt, cells were infected with SeV, Cantell strain (17), and at 16 hpi cells were lysed using 20 mM Tris-HCl (pH 7.4), 5 mM EDTA, 100 mM NaCl, 1% NP-40, and cOmplete protease inhibitor cocktail (Roche) for 30 min on ice. Cell lysates were clarified by centrifugation at 14,000 rpm for 10 min at 4°C, and an equal volume of luciferase reporter buffer (Promega) was added. Fluc protein expression levels were quantified in a Lumicount luminometer.
Bioassay to determine NS1 IFN antagonism.Triplicate wells of hu-man A549 cells (96-well format; 3⫻104cells/well) were transiently trans-fected with 200 ng/well of the pCAGGS-HA NH2 NS1 plasmids, or the empty plasmid as control, using DNA-IN by following the manufacturer’s instructions. At 24 hpt, cells were transfected with 100 ng of polyinosinic-poly(C) [poly(I·C); Sigma] using DNA-IN or were treated with 250 U/ml of universal IFN-␣. Sixteen hours after poly(I·C) or IFN-␣treatment, cells were infected (MOI, 0.001) with VSV-GFP (28). VSV-GFP titers in the culture supernatants were determined 21 hpi as described above.
Interaction of NS1 proteins with CPSF30.HA-tagged NS1 variants were synthesizedin vitrousing the pcDNA3 plasmids and the TNT7 tran-scription/translation kit (Promega) by following the manufacturer’s rec-ommendations. Human 293T cells (6-well format; 1.5⫻106cells/well) were transiently transfected with 8,000 ng of a pCAGGS plasmid express-ing a FLAG-tagged version of the human CPSF30 (17). At 30 hpt, cells were lysed in 20 mM Tris-HCl (pH 7.5), 100 mM NaCl, 0.5 mM EDTA, 5% glycerol, and 1% Triton X-100 and supplemented with a cOmplete mini protease inhibitor cocktail (Pierce). Cleared cell lysates expressing FLAG-CPSF30 were incubated overnight at 4°C with thein vitro -synthe-sized NS1 proteins and 20l of an anti-FLAG affinity resin (Sigma-Al-drich). After extensive washing, precipitated proteins were dissociated from the resin using disruption buffer and analyzed by Western blotting as described above using rabbit anti-HA (NS1)- and anti-FLAG (CPSF30)-specific polyclonal antibodies.
Interaction of NS1 proteins with dsRNA.To prepare poly(I·C)-jugated agarose beads, poly(C)-conpoly(I·C)-jugated agarose beads (Sigma) con-taining approximately 62.5g of poly(C) were washed five times with TBS buffer (25 mM Tris, 150 mM NaCl). The beads then were resuspended in buffer containing 50 mM Tris and 50 mM NaCl and incubated overnight with 500g of inosinic acid (Sigma). The beads were washed twice with TBS, resuspended in TBS buffer containing 1 mM EDTA and 0.5% Triton X-100, and incubated at 4°C for 2 h with the HA-tagged NS1 variants synthesizedin vitrousing pcDNA3 plasmids and the TNT7 transcription/ translation kit (Promega). The mixture was washed 3 times with TBS buffer containing 1 mM EDTA and 0.05% Tween 20, and the bound proteins were eluted in loading buffer at 95°C over 5 min. The eluted proteins were analyzed by Western blotting using a rabbit anti-HA-spe-cific polyclonal antibody, as previously described.
Mouse experiments.Female 6-week-old C57BL/6 mice were pur-chased from the Jackson Laboratory and maintained in the animal care facility at the University of Rochester in a pathogen-free environment. All animal protocols were approved by the University of Rochester Commit-tee of Animal Resources and complied with the recommendations in the
Guide for the Care and Use of Laboratory Animalsof the National Research Council (35). Mice were anesthetized intraperitoneally (i.p.) with 2,2,2-tribromoethanol (Avertin) and then inoculated intranasally (i.n.) with 30 l of the indicated recombinant influenza A/Puerto Rico/8/34 NS split viruses encoding the NS1 proteins from patients 85 and 87 (r85 and r87, respectively). The mice were monitored daily for morbidity (body weight loss;n⫽5) and mortality (survival;n⫽5). Mice showing more than 25% loss of body weight were considered to have reached the experimental endpoint and were humanely euthanized.
Virus replication was evaluated by determination of viral titers in the lungs at 1, 3, and 5 dpi. To that end, mice (n⫽3) were sacrificed and lungs were extracted and homogenized. Virus titers were determined by immu-nofocus assay (FFU per milliliter) as indicated above. Geometric mean titers (GMTs) were determined and statistical analyses (Mann-Whitney test) were performed using GraphPad Prism software. Levels of IFN- induction were analyzed in mouse lungs at 1, 3, and 5 dpi. To that end, mice (n⫽3) were sacrificed and lungs were extracted and incubated in RNAlater (Ambion) at 4°C for 24 h prior to freezing at⫺80°C. Lungs were homogenized in lysis buffer using a gentleMACS dissociator (Miltenyi Biotec), and total RNA was extracted using an RNeasy minikit (Qiagen). RT reactions were performed at 37°C for 2 h using the high-capacity cDNA transcription kit and random hexamer oligonucleotides to gener-ate cDNAs. qPCRs were performed using a TaqMan gene expression assay (Applied Biosystems) specific for the IFN- murine gene (Mm00439552_s1). Quantification was achieved using the 2⫺⌬⌬CT
method (33).
Study design and human subjects.Human subjects were enrolled as part of an acute influenza surveillance protocol (IRB number 09-0034). Individuals reporting influenza-like illness (fever, cough, and rhinitis) were asked to visit the Vaccine Research Unit (VRU) at the University of Rochester for nasal and nasopharyngeal swabbing and blood sampling. Starting with nasopharyngeal swabs, MDCK cells were inoculated and observed for cytopathic effect at 3 dpi. Supernatants then were collected and used to generate virus stocks in MDCK cells (32). The study was approved by the University of Rochester Human Research Subjects Re-view Board. Informed written individual or parental consent was ob-tained for each participant.
NS1 sequencing.RNA was obtained from 300l of patient nasal washes/swabs using the QIAamp viral RNA extraction kit (Qiagen) ac-cording to the manufacturer’s instructions. RT reactions were performed during 2 h at 37°C using the high-capacity cDNA reverse transcription kit (Applied Biosystems) and the primers NS1-NCR-5=-VS (5=-AGCAAAGC AGGAGTAAAGATGAATCC-3=, complementary to the 5=NCR and the first 8 nt of influenza A/Victoria/361/2011 NS1 gene [GenBank accession no.KJ942684.1]) and NEP-3=-RS (5=-CTGTTCCACTTCAAACAGCAG TTGTAATG-3=, complementary to influenza A/Victoria/361/2011 NS1
on November 7, 2019 by guest
http://jvi.asm.org/
ORF). The cDNAs were amplified by PCR using Pfx polymerase (Life Technologies) and the same VS and RS primers. Amplified PCR products were used for Sanger sequencing (Genewiz).
qRT-PCR of PBMCs.PBMCs from subjects (acute visit, 2 to 3 days after infection) were thawed and rested overnight (106cells/M24 well) in RPMI medium containing 10% fetal bovine serum and 100 U/ml penicil-lin, 0.1 mg/ml streptomycin, and 50g/ml gentamicin. The following day, PBMCs were treated with 2,000 U/ml of IFN-␣or infected (MOI, 1) with r85. At 21 h after treatment or infection, PBMCs were collected and total RNA was extracted using an RNeasy minikit (Qiagen). RT reactions were performed at 37°C for 2 h using the high-capacity cDNA transcription kit (Applied Biosystems) and random hexamer oligonucleotides to generate cDNAs. qPCRs were performed using TaqMan gene expression assays (Applied Biosystems) specific for human IFN-, IFIT2, and interleu-kin-29 (IL-29) (IFN-3) and glyceraldehyde-3-phosphate dehydrogenase (GAPDH) genes (Hs01077958_s1, Hs01922738_s, Hs00601677_g1, and Hs02758991_g1, respectively) or a TaqMan assay specific for the influenza virus M gene (NR-15592; BeiResources). Quantification was achieved us-ing the 2⫺⌬⌬CTmethod (33).
RESULTS
Variability in innate immune responses among IAV H3N2 virus
clinical isolates.
We used a collection of IAV H3N2 viruses (see
Table 4
) isolated from patients in Rochester (NY) (
32
) during
the 2012-2013 season to analyze differences in innate immune
responses induced after virus infection. To that end, MDCK
cells were infected with the viruses from patients 55, 65, 85, 90,
and 91 (MOI, 0.01) isolated from MDCK cells (
32
). At 16 h
postinfection (hpi), total RNAs were purified and analyzed by
deep sequencing to compare the transcriptomes of infected
cells and to obtain the virus gene sequences. Only the genes
showing a fold change of at least 1.5 and a
P
value of
⬍
0.05 were
considered statistically significant. Whereas gene expression in
85 virus-infected cells was different, the transcriptomes of cells
infected with viruses 55, 65, 90, and 91 were very similar (data
not shown). For this reason, and to simplify the results, only
the transcriptome from the 65 virus-infected cells will be
shown and compared to gene expression in mock- and 85
vi-rus-infected cells. A total of 234 and 637 genes were
differen-tially expressed in cells infected with 65 and 85 viruses,
respec-tively, compared to mock-infected cells (see Tables S1 and S2 in
the supplemental material), and 79 genes were differentially
expressed in cells infected with 65 and 85 viruses (see Table S3).
The genes differentially expressed in cells infected with the two
viruses were clustered according to their main biological
func-tion using DAVID software (
36
). The most statistically
signif-icant clusters were associated with defense response, cytokine
activity, extracellular space, extracellular region, inflammatory
response, and immune response (
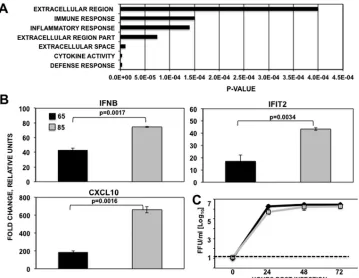
Fig. 1A
), with IAV 85
induc-ing an increased innate immune response compared to virus
FIG 1Differential innate immune responses after infection with two different circulating IAV H3N2 viruses. (A) Genes differentially expressed in MDCK cells infected (MOI, 0.01) with virus 65 compared to virus 85-infected MDCK cells were classified according to their main biological functions using the DAVID software.Pvalues of the most significant groups are shown on thexaxis. (B) Canine MDCK cells were mock infected or infected (MOI, 0.01) with IAV A H3N2 65 or 85. RNAs were extracted at 24 hpi, and the expression of cellular genes IFN-, IFIT2, and CXCL10 was evaluated by qRT-PCR. In each case, the expression levels of mRNAs for representative innate immune response genes were compared to the levels in mock-infected cells. Bars represent standard deviations of the means from triplicates.Pvalues determined using Student’sttest are indicated. (C) MDCK cells were infected (MOI, 0.01) in duplicate with IAV H3N2 65 or 85. Virus titers in supernatants of infected cells at different times pi were determined by immunofocus assay (FFU/ml). The experiments were repeated 3 times, in duplicate, with similar results. Error bars represent the standard deviations for the duplicates in one representative experiment. The dotted line indicates the limit of detection.
on November 7, 2019 by guest
http://jvi.asm.org/
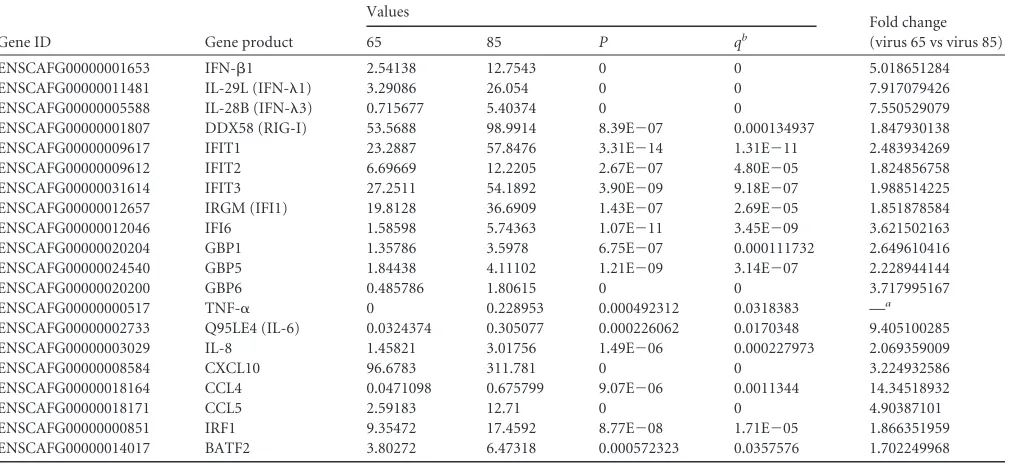
[image:6.585.114.473.65.343.2]65. Interestingly, genes encoding IFN-

, type III IFNs (IFN-
1
and IFN-
3), many ISGs (RIG-1, ISG56/IFIT1, ISG54/IFIT2,
IFIT3, interferon-induced 1 [IFI1], IFI6, guanylate-binding
pro-tein 1 [GBP1], GBP5, and GBP6), and inflammatory factors
(tu-mor necrosis factor [TNF], IL-6, IL-8, CXCL10, CCL4, CCL5,
IRF1, and BATF2) were differentially upregulated in cells infected
with virus 85 compared to virus 65 (
Table 3
).
To confirm that IAV isolated from patient 85 induced higher
levels of innate immune response transcripts than those obtained
from the cells infected with the virus isolated from patient 65,
MDCK cells were infected at an MOI of 0.01 and the expression of
IFN-

, ISG54/IFIT2, and CXCL10 genes was analyzed by
qRT-PCR (
Fig. 1B
). Compared to mock-infected cells, upregulation of
IFN-

, ISG54/IFIT2, and CXCL10 transcripts was higher in cells
infected with IAV 85 than in cells infected with IAV 65 (
Fig. 1B
).
To rule out the possibility that IAV 85 induced a higher immune
response due to higher levels of viral replication, growth kinetics
were determined. To that end, MDCK and A549 cells were
in-fected with both virus isolates at the same MOIs (0.01 and 0.5 for
MDCK and A549 cells, respectively), and TCS were collected at 24,
48, and 72 hpi (
Fig. 1C
and data not shown). Viruses isolated from
both patients grew to similar titers in MDCK and A549 cells,
sug-gesting that the differences in innate immune responses were not
due to differences in virus growth (
Fig. 1C
and data not shown).
To analyze whether differences in innate immune responses
between cells infected with viruses 65 and 85 could be due to viral
protein differences, amino acid changes between both viruses
were analyzed. Differences in viral genes HA, NA, PA-X, PB1, PB2,
and NS1 were detected between both viruses (see Table S4 in the
supplemental material). However, influenza virus NS1 is the main
viral protein that suppresses host innate immune responses
allow-ing the virus to replicate efficiently (reviewed in reference
7
),
sug-gesting that one or more of the 3 mutations found in the NS1
protein is responsible for differential induction of host innate
im-mune responses elicited during infection (
Fig. 1
).
To rule out the possibility that the differences in innate
im-mune responses induced after infection with viruses 65 and 85
were due to coinfections with different strains of influenza viruses
or to coinfections with other pathogens leading to
immunosup-pression, we looked for other microorganism sequences and for
the presence of SNPs in the influenza virus using the
deep-se-quencing data collected from the 65 and 85 virus-infected cells.
We did not find any sequences for any other microorganisms,
strongly suggesting that cells were not coinfected with other
pathogens. When looking at influenza virus SNPs, we found
low-frequency sequences containing changes in NA, HA, PA, and PB2
(see Table S5 in the supplemental material). However, as these
genes have not been implicated to date in the antagonism of innate
immune responses after influenza virus infection, these data
sug-gested that the differences in innate immune responses are not due
to coinfections with other influenza viruses.
Variability in NS1 protein sequence among IAV H3N2
clini-cal isolates.
To further assess variability in the NS1 protein of IAV
H3N2 viruses circulating within the 2012-2013 season in the
Rochester (NY) area, the NS1 protein sequences of 10 additional
clinical samples from the same 2012-2013 season were obtained
(GenBank accession numbers
KU715844
,
KU715845
,
KU715848
,
KU715849
,
KU715851
,
KU715853
,
KU715854
,
KU715855
,
KU715856
,
KU715857
,
KU715859
, and
KU715860
). Clinical
[image:7.585.42.553.79.311.2]iso-lates from patients 54FUR0056, 54FUR0058, 54FUR0064,
54FUR0065, 54FUR0068, 54FUR0072, 54FUR0073, 54FUR0090,
and 54FUR0091 (referred to here by the last two numbers in their
identifiers) encoded the same NS1 sequence. However, IAV
fecting patient 55 presented an E26K change, while the virus
in-fecting patient 87 presented E26K and R224K changes. Finally, the
virus from patient 85 presented E26K, I64T, and R224K changes
TABLE 3Innate immune response genes in 65 and 85 virus MDCK-infected cells
Gene ID Gene product
Values
Fold change (virus 65 vs virus 85)
65 85 P qb
ENSCAFG00000001653 IFN-1 2.54138 12.7543 0 0 5.018651284 ENSCAFG00000011481 IL-29L (IFN-1) 3.29086 26.054 0 0 7.917079426 ENSCAFG00000005588 IL-28B (IFN-3) 0.715677 5.40374 0 0 7.550529079 ENSCAFG00000001807 DDX58 (RIG-I) 53.5688 98.9914 8.39E⫺07 0.000134937 1.847930138 ENSCAFG00000009617 IFIT1 23.2887 57.8476 3.31E⫺14 1.31E⫺11 2.483934269 ENSCAFG00000009612 IFIT2 6.69669 12.2205 2.67E⫺07 4.80E⫺05 1.824856758 ENSCAFG00000031614 IFIT3 27.2511 54.1892 3.90E⫺09 9.18E⫺07 1.988514225 ENSCAFG00000012657 IRGM (IFI1) 19.8128 36.6909 1.43E⫺07 2.69E⫺05 1.851878584 ENSCAFG00000012046 IFI6 1.58598 5.74363 1.07E⫺11 3.45E⫺09 3.621502163 ENSCAFG00000020204 GBP1 1.35786 3.5978 6.75E⫺07 0.000111732 2.649610416 ENSCAFG00000024540 GBP5 1.84438 4.11102 1.21E⫺09 3.14E⫺07 2.228944144 ENSCAFG00000020200 GBP6 0.485786 1.80615 0 0 3.717995167 ENSCAFG00000000517 TNF-␣ 0 0.228953 0.000492312 0.0318383 —a
ENSCAFG00000002733 Q95LE4 (IL-6) 0.0324374 0.305077 0.000226062 0.0170348 9.405100285 ENSCAFG00000003029 IL-8 1.45821 3.01756 1.49E⫺06 0.000227973 2.069359009 ENSCAFG00000008584 CXCL10 96.6783 311.781 0 0 3.224932586 ENSCAFG00000018164 CCL4 0.0471098 0.675799 9.07E⫺06 0.0011344 14.34518932 ENSCAFG00000018171 CCL5 2.59183 12.71 0 0 4.90387101 ENSCAFG00000000851 IRF1 9.35472 17.4592 8.77E⫺08 1.71E⫺05 1.866351959 ENSCAFG00000014017 BATF2 3.80272 6.47318 0.000572323 0.0357576 1.702249968 a—, no accurate fold change can be calculated as the denominator is 0.
b
qvalue indicates the false-discovery rate.
on November 7, 2019 by guest
http://jvi.asm.org/
(
Table 4
). These data indicate the presence of genetic variability in
the NS1 protein among A/H3N2 IAVs infecting people both in the
same area and within the same season.
[image:8.585.40.287.88.250.2]Effect of NS1 changes on translation inhibition and host
in-nate immune responses.
Influenza NS1 protein is a
multifunc-tional protein that plays several key roles during the replication
cycle of the virus (reviewed in reference
7
). One of the main
func-tions of influenza NS1 protein is to counteract the type I IFN
response (reviewed in reference
7
). Additionally, the NS1 protein
of some IAV has been shown to inhibit host protein expression by
binding to CPSF30 (
16–18
) and PABPII (
23
). To analyze the effect
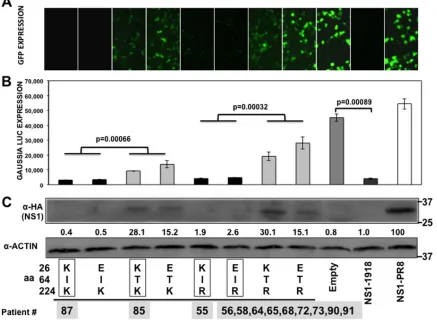
of A/H3N2 NS1 changes in positions 26, 64, and 224 (in the same
backbone) on the inhibition of host gene expression, human 293T
cells were cotransfected with plasmids expressing GFP and Gluc
and with plasmid encoding the different NS1 variants under the
control of a polymerase II promoter (
26
) or with the empty
plas-mid as a control (
Fig. 2
). Plasmids expressing NS1 from A/BM/
1/18 H1N1 (1918) and A/PuertoRico/8/34 H1N1 (PR8) were used
as additional controls since they represent NS1 proteins which do
TABLE 4Amino acid changes in NS1 proteins from influenza A/H3N2 virus circulating during 2012-2013 season
Patient
Amino acid at position:
26 64 224
55 K I R
56 E I R
58 E I R
64 E I R
65 E I R
68 E I R
72 E I R
73 E I R
85 K T K
87 K I K
90 E I R
91 E I R
Consensusa K I R
aThe consensus sequence shows the most prevalent amino acid found in A/H3N2 NS1
proteins from 2012-2013 human viruses (IRD).
FIG 2Effect of IAV H3N2 NS1 mutations at positions 26, 64, and 224 on general gene expression. Human 293T cells were transiently cotransfected with pCAGGS plasmids expressing the indicated HA epitope-tagged NS1 proteins, along with GFP- and Gluc pCAGGS-expressing plasmids, using DNA-IN. (A) At 30 hpt, GFP expression was visualized using a fluorescence microscope. (B) At 30 hpt, Gluc expression was analyzed using luminescence. Error bars represent the standard deviations for triplicates.Pvalues using Student’sttest are indicated. (C) IAV NS1 protein and cellular actin protein expression levels were analyzed by Western blotting from cell extracts using antibodies specific to the HA tag (to detect the NS1 protein) and to actin (as a loading control). Western blots were quantified by densitometry using the software ImageJ (v1.46), and the amounts of NS1 protein were normalized to the amounts of actin protein. Protein expression in cells transfected with the plasmid expressing PR8-NS1 was considered to be 100% for comparison to the levels of expression by the other NS1 variants (numbers below the NS1 blot). Molecular mass markers (in kilodaltons) are indicated on the right. The experiments were repeated 3 times with similar results. The squares represent the NS1 variants found in the subjects (Table 4), showing the numbers of patients for each NS1 variant below the squares. aa, amino acid.
on November 7, 2019 by guest
http://jvi.asm.org/
[image:8.585.75.512.310.631.2]and do not block general gene expression, respectively (
17
). At 30
hpt, GFP (
Fig. 2A
) and Gluc (
Fig. 2B
) expression levels were
eval-uated using fluorescence microscopy and a LumiCount
luminom-eter, respectively. As previously shown (
17
), 1918 NS1 protein
inhibited protein expression of both reporter genes, whereas PR8
NS1 protein did not. The NS1 proteins encoded by H3N2 IAVs
inhibited protein synthesis to different extents (
Fig. 2A
and
B
).
The levels of Gluc and GFP expression were similar in cells
ex-pressing NS1 proteins containing amino acid changes at positions
26 and 224 (
Fig. 2A
and
B
), suggesting that these mutations do not
significantly affect the ability of the NS1 protein to inhibit cellular
gene expression. However, the transfection of plasmids encoding
NS1 proteins containing T at amino acid position 64 led to
in-creased levels of reporter gene expression in the cells, indicating
that this mutation affected the ability of NS1 to block host gene
expression. On the other hand, cells transfected with plasmids
encoding the NS1 proteins containing an I at position 64
ex-pressed reduced levels of reporter proteins, similar to that
ob-served with the 1918 NS1 protein. These results were further
con-firmed when NS1 expression levels were analyzed by Western
blotting. As expected, NS1 proteins that efficiently blocked GFP
and Gluc expression (I64) were barely detected by Western
blot-ting (
Fig. 2C
), similar to the situation with the 1918 NS1 protein
(
17
). On the other hand, NS1 proteins containing T64 were easily
detected in transfected cell lysates, similar to the situation with
PR8 NS1 (
17
) (
Fig. 2C
).
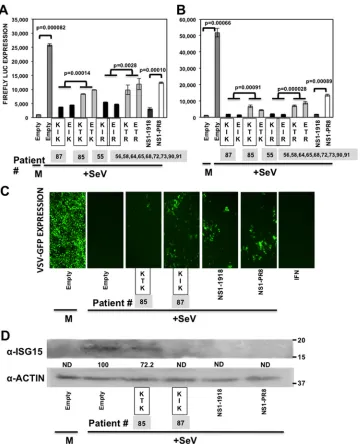
To analyze whether the amino acid differences observed in the
IAV H3N2 NS1 variants affected their ability to counteract the
innate immune responses, two complementary assays were
per-formed. In the first assay, human 293T cells were cotransfected
with plasmids expressing the different NS1 proteins under a
poly-merase II promoter, with plasmids expressing Fluc under the
con-trol of the IFN-

(
Fig. 3A
) or an ISRE (
Fig. 3B
) promoter and with
a plasmid constitutively expressing Rluc. At 24 hpt, cells were left
mock infected or were infected with SeV (Cantell strain) to induce
activation of both promoters. At 16 hpi, IFN-

and ISRE
pro-moter activation was determined by quantifying levels of Fluc
(
Fig. 3A
and
B
), the levels of secreted IFN were quantified in a
bioassay (
Fig. 3C
), and the levels of the endogenous
IFN-stimu-lated protein 15 (ISG15) were analyzed by Western blotting (
Fig.
3D
). As expected, SeV infection induced robust activation of both
IFN-

and ISRE promoters in cells transfected with the empty
plasmid. As expected, PR8 NS1 inhibited SeV-induced activation
of both promoters to lower extents than 1918 NS1 (
17
). In cells
transfected with the different IAV H3N2 NS1 variants, the levels of
Fluc were reduced compared to those for empty plasmid-infected
cells, consistent with previous results showing that IAV NS1
pro-teins counteract SeV-induced activation of both promoters
(re-viewed in reference
7
). Notably, NS1 proteins containing T at
position 64 inhibited IFN and ISRE promoter activation to lower
extents than those containing I64 (
Fig. 3A
and
B
), similar to the
results obtained with PR8 NS1. To analyze the levels of SeV
infec-tion-induced IFN in cells overexpressing the different NS1
vari-ants, TCS were UV inactivated and used to treat A549 cells. As a
control, cells were treated with 2,500 U/ml of universal IFN-
␣
.
The cells then were infected with the IFN-sensitive VSV-GFP,
and the levels of GFP expression were analyzed (
Fig. 3C
). GFP
expression was high in cells treated with TCS from empty
plas-mid-transfected, mock-infected cells. In contrast, the levels of
GFP expression decreased in cells treated with supernatants from
SeV-infected, NS1-I64-transfected cells and, to a much lower
ex-tent, from SeV-infected NS1-T64-transfected cells (
Fig. 3C
). This
bioassay indicated that the levels of secreted IFN induced after SeV
infection were lower in cells transfected with NS1-I64 than in cells
transfected with NS1-T64. Remarkably, and confirming the
previous results, levels of ISG15 expression were detected by
Western blotting in SeV-infected cells which were transfected
with empty plasmid, and with the plasmid expressing the
T64-NS1, but not in cells transfected with I64-T64-NS1, PR8-T64-NS1, and
1918-NS1 plasmids (
Fig. 3D
). As a control, the levels of the
cellular actin protein were similar in all cases (
Fig. 3D
). These
results indicated that I64T substitution affected the ability of
NS1 to inhibit SeV-mediated activation of both promoters, the
induction of secreted IFN, and the induction of
IFN-stimu-lated genes, such as ISG15, possibly because of a defect in
in-hibiting general host expression (
Fig. 2
). In fact, the levels of
constitutive Rluc expression in these experiments were similar
to those of Gluc (
Fig. 2
and data not shown), corroborating that
the mutation I64T decreases the ability of the NS1 protein to
inhibit general gene expression.
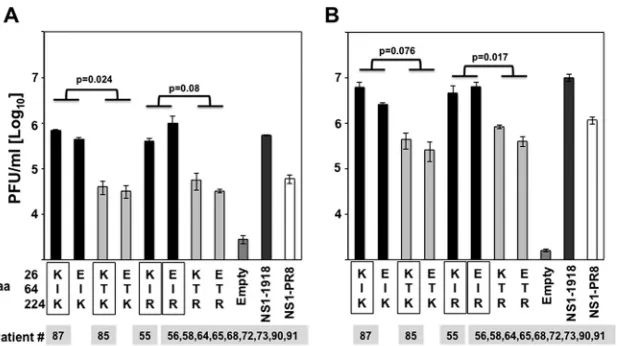
To further analyze whether the amino acid changes found in
the NS1 proteins affected their ability to counteract the innate
immune responses, human A549 cells were transiently transfected
with plasmids expressing the different IAV H3N2 NS1 proteins.
Cells transfected with the empty plasmid or with 1918- and PR8
NS1-expressing plasmids were included as controls. At 24 hpt,
cells were mock treated or treated with poly(I·C) (
Fig. 4A
) or
IFN-
␣
(
Fig. 4B
) for 16 h and infected (MOI, 0.001) with
GFP. At 21 hpi, cell culture supernatants were collected and
VSV-GFP titers were quantified. Cells transfected with empty plasmid
and treated with either poly(I·C) or IFN-
␣
showed reduced titers
of VSV-GFP because of the sensitivity of VSV to the antiviral state
induced by type I IFN production and signaling. As expected,
VSV-GFP titers were
⬃
10-fold (1 log) higher in cells transfected
with 1918 NS1 than in cells transfected with PR8 NS1 in both
poly(I·C)-treated (
Fig. 4A
) and IFN-
␣
-treated (
Fig. 4B
) cells,
con-sistent with the ability of 1918 NS1 to inhibit host protein
expres-sion (
Fig. 2
). VSV-GFP replication was rescued in cells transfected
with the IAV H3N2 NS1 variants and either treated with poly(I·C)
(
Fig. 4A
) or IFN-
␣
(
Fig. 4B
), consistent with the ability of NS1 to
counteract the type I IFN response (reviewed in reference
7
).
However, there were qualitative differences among the different
A/H3N2 NS1 proteins. VSV-GFP titers were also
⬃
10-fold (1 log)
lower in cells expressing NS1 proteins containing the residue T64
than in cells expressing the NS1 proteins containing amino acid I
at position 64. Notably, NS1 protein mutations E26K and R224K
had no significant effects on VSV-GFP growth. These data showed
that the mutation I64T diminished the capability of NS1 to
antag-onize cellular antiviral responses, whereas the mutations at
posi-tions 26 and 224 did not show a significant effect.
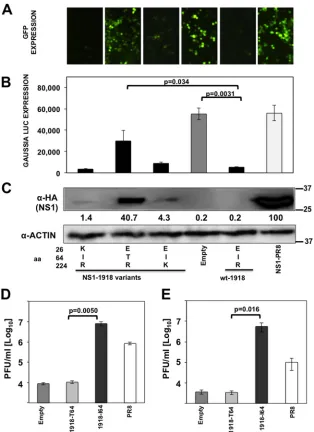
To further evaluate the effect of mutations E26K, I64T, and
R224K on the ability of NS1 to inhibit host innate immune
re-sponses and gene expression, these mutations were introduced in
the 1918 NS1 background (
Fig. 5
). To analyze the effect of these
amino acid changes on the ability of 1918 NS1 to inhibit host
protein expression, human 293T cells were cotransfected with
plasmids expressing GFP and Gluc under the control of the
poly-merase II promoter and with plasmids encoding the different 1918
NS1 variants, or with the empty plasmid as a control. I64T
substi-tution in 1918 NS1 significantly affected the ability of 1918 NS1 to
on November 7, 2019 by guest
http://jvi.asm.org/
inhibit host gene expression as evaluated by GFP (
Fig. 5A
) and
Gluc (
Fig. 5B
) expression. However, substitutions E26K and
R224K did not have a significant effect on the ability of 1918 NS1
to inhibit host protein expression (
Fig. 5A
and
B
). These results
were further confirmed when we evaluated NS1 protein
expres-sion levels in cell lysates by Western blotting (
Fig. 5C
). As
ex-pected, 1918 NS1 variants that efficiently blocked GFP and Gluc
expression levels (E26K and R224K) were barely detected by
Western blotting, similar to WT 1918 NS1 (
Fig. 5C
). On the other
hand, 1918 NS1 I64T was detected by Western blotting, as
ex-pected, based on the results obtained with GFP and Gluc reporter
assays. Altogether, these data indicate that substitution I64T also
affects the ability of 1918 NS1 to inhibit host protein expression
and demonstrate the key role of this amino acid residue located in
FIG 3Effect of IAV H3N2 NS1 protein mutations on innate immune responses induced by SeV infection. Human 293T cells were transiently transfected using the calcium phosphate method with the indicated pCAGGS NS1-expressing plasmids, together with plasmids expressing Fluc under the control of an IFN-(A) or ISRE promoter (B). At 24 hpt, cells were mock infected (M) or infected with SeV (Cantell strain) (⫹SeV) to induce activation of the promoters, and 16 hpi cell lysates were prepared for reporter gene expression. (A and B) Reporter Firefly expression was measured by luminescence. Data represented show the means and standard deviations of the results determined for triplicate wells. Experiments were repeated 3 times in triplicate wells with similar results.Pvalues determined using Student’sttest are indicated. (C) At 16 h after SeV infection, TCS were collected and, after UV inactivation, were used to treat fresh A549 cells. Alternatively, A549 cells were treated with 2,500 U/ml of universal IFN-␣as a control (picture on the right). After 24 h of incubation, cells were infected (MOI, 0.001) with the IFN-sensitive VSV-GFP. At 16 hpi, VSV-GFP-infected cells were observed under a fluorescence microscope. (D) At 16 h after SeV infection, cellular extracts were obtained and the expression of ISG15 and actin were evaluated by Western blotting, using antibodies specific to ISG15 and to actin (as a loading control). Western blots were quantified by densitometry using the software ImageJ (v1.46), and the amounts of ISG15 protein were normalized to the amounts of actin protein (numbers below the ISG15 blot; ND, not detected). Molecular mass markers (in kilodaltons) are indicated on the right. The squares represent the NS1 variants found in the subjects (Table 4), showing the numbers of patients for each NS1 variant below the squares.
on November 7, 2019 by guest
http://jvi.asm.org/
[image:10.585.114.474.64.510.2]the dsRNA-binding domain of IAV NS1 in regulating general gene
expression.
To further analyze the effect of NS1 I64T mutation on the
antagonism of innate immune responses, human A549 cells were
transiently transfected with plasmids expressing 1918-NS1-I64
(WT protein), 1918-NS1-T64, and PR8 NS1. At 24 hpt, cells were
mock treated or treated with poly(I·C) (
Fig. 5D
) or IFN-
␣
(
Fig.
5E
) for 16 h and infected (MOI, 0.001) with VSV-GFP. At 21 hpi,
cell culture supernatants were collected and VSV-GFP titers were
quantified. Cells transfected with empty plasmid and treated with
either poly(I·C) or IFN-
␣
showed reduced titers of VSV-GFP
be-cause of the sensitivity of VSV to the antiviral state induced by type
I IFN production [poly(I·C)-treated cells;
Fig. 5D
] and signaling
(IFN-
␣
-treated cells;
Fig. 5E
). Interestingly, VSV-GFP titers were
⬃
1,000-fold (3 logs) higher in cells transfected with 1918-NS1-I64
than in cells transfected with the 1918-NS1-T64 or the empty
plas-mid-transfected control cells (
Fig. 5D
and
E
). These data further
confirmed that the mutation I64T diminished the capability of
NS1 to antagonize cellular antiviral responses.
Effect of I64T mutation on the binding of NS1 to CPSF30.
The NS1 proteins of some IAV strains interact with CPSF30,
in-hibiting host protein expression (
16–19
). To assess whether I64T
mutation plays a role in the binding of NS1 to CPSF30, cell
ex-tracts from human 293T cells transfected with a plasmid encoding
FLAG-tagged CPSF30 (
17
) were incubated with
in vitro
-tran-scribed and -translated NS1 proteins from patients 85 and 87
(dif-fering only at I64T position), or with PR8 NS1 as control, and with
agarose beads conjugated with an anti-FLAG antibody (
Fig. 6
). As
expected, PR8 NS1 did not coimmunoprecipitate with CPSF30
according to previous results showing that PR8 NS1 does not
in-teract with CPSF30 (
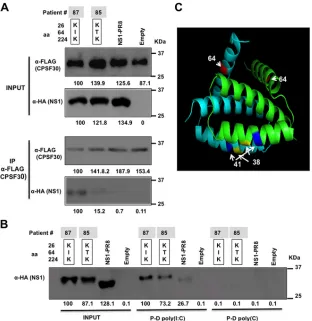
17
). Interestingly, NS1 from patient 87 (I64)
coimmunoprecipitated with CPSF30, while the amount of NS1
T64 (patient 85) was significantly reduced. Importantly, the
amounts of both IAV H3N2 NS1 and CPSF30 proteins used for
the coimmunoprecipitation and the amounts of
coimmunopre-cipitated CPSF30 proteins were similar in all cases (
Fig. 6A
).
Al-together, these results indicate that I64T substitution decreases
IAV NS1 binding to CPSF30 and provides a mechanism for the
impairment of T64-NS1-mediated inhibition of general gene
ex-pression.
Effect of I64T mutation on the binding of NS1 to dsRNA.
To
analyze whether I64T substitution could also impair the binding
of NS1 to dsRNA, agarose beads conjugated to poly(I·C) were
incubated with the
in vitro
-transcribed and -translated NS1 from
patients 85 and 87 (differing only in the I64T position) or with
PR8 NS1 as a control. We also included agarose beads conjugated
to poly(C) to demonstrate the specific interaction of NS1 with
poly(I·C). As expected, all NS1 proteins were pulled down using
poly(I·C) agarose beads but not with the poly(C) agarose beads,
suggesting that the pulldown was specific (
Fig. 6B
). No significant
differences were observed between the precipitated amounts of
I64-NS1 and T64-NS1 proteins (
Fig. 6B
), suggesting that
muta-tion I64T does not significantly impair the binding of NS1 to
dsRNA. According to these data, the tridimensional structure of
the NS1-dsRNA binding domain showed that each NS1-dsRNA
binding domain monomer forms three antiparallel
␣
-helices, with
residue 64 located in
␣
-helix 3, whereas residues important for
dsRNA binding, such as 38 and 41 (
37
), were located in
␣
-helix 2
(
Fig. 6C
).
Effect of I64T mutation on virulence, virus growth, and
IFN-

induction
in vivo.
NS1 has been previously shown to play
a significant role in IAV virulence
in vivo
(
8
,
9
,
38
). Likewise,
mutations affecting the ability of NS1 to counteract the host
in-nate immune response have been shown to reduce the virulence of
IAV
in vivo
(
39
,
40
). To analyze whether I64T mutation leads to
virus attenuation, recombinant viruses encoding the NS1 proteins
from patients 85 and 87 (differing only in the amino acid at
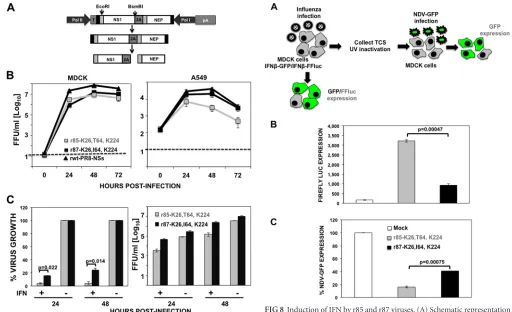
posi-tion 64) were generated (r85 and r87, respectively) (
Fig. 7
). To
this end, a previously described PR8 virus encoding a split NS
segment (NSs) was used (
27
). In this PR8 NSs virus, the NS1
and NEP ORFs are separated by the PTV 2A autoproteolytic
cleavage site (
Fig. 7A
) (
27
). This allowed the introduction of
mutations in NS1 without affecting the amino acid sequence of
NEP (
27
). Both viruses were rescued using previously
de-FIG 4Effect of IAV H3N2 NS1 protein mutations on VSV growth. Human A549 cells were transfected with pCAGGS plasmids expressing the indicated NS1 variants using DNA-IN. At 24 hpt, cells were either transfected with 100 ng of poly(I·C) (A) or treated with 250 U/ml of universal IFN (B) to induce an antiviral cellular state. At 16 h posttreatment, cells were infected (MOI, 0.001) with VSV-GFP, and viral titers in the TCS were determined at 21 hpi. Bars represent the standard deviations from triplicates. Experiments were repeated 3 times in triplicate wells with similar results.Pvalues using Student’sttest are indicated. The squares represent the NS1 variants found in the subjects (Table 4), showing the numbers of patients for each NS1 variant below the squares.
on November 7, 2019 by guest
http://jvi.asm.org/
[image:11.585.140.449.65.238.2]scribed plasmid-based reverse genetic approaches (
29
), and
vi-rus growth of these vivi-ruses and of a vivi-rus encoding the NS1
from PR8 encoding the NS split segment (rwt-PR8-NSs) (
27
)
was determined in canine (MDCK) and human (A549) cells
infected at low MOI (0.001) (
Fig. 7B
). In MDCK cells, both
recombinant PR8 viruses showed similar growth kinetics and
reached viral titers of
⬃
10
7FFU/ml at the peak of infection (48
hpi). However, in A549 cells, r85 was attenuated compared to
r87 at all tested times postinfection. Moreover, r85 viral titers
were approximately 5- to 10-fold lower than those for r87 (
Fig.
7B
). The titers reached by virus rwt-PR8-NSs were around
10-fold higher than titers for virus r87 in MDCK cells and similar
to that of virus r87 in A549 cells (
Fig. 7B
). Altogether, these
results indicated that r85 was significantly affected in
replica-FIG 5Mutation I64T in IAV 1918 H1N1 NS1 affects its ability to inhibit general gene expression and innate immune responses. (A, B, and C) Human 293T cells were transiently cotransfected with pCAGGS plasmids expressing the different NS1 variants indicated and the WT 1918-NS1 (E26, I64, and R224), along with pCAGGS plasmids expressing the reporter proteins GFP and Gluc. (A) At 30 hpt, GFP expression was visualized using a fluorescence microscope. (B) Gluc expression was analyzed at 30 hpt using luminescence. Error bars represent the standard deviations for triplicates.Pvalues using Student’sttest are indicated. (C) In addition, NS1 and actin expression levels were analyzed by Western blotting from cell extracts using antibodies specific to the HA tag (to detect the NS1 protein) and to actin as a loading control. Western blots were quantified by densitometry using the software ImageJ (v1.46), and the amounts of NS1 protein were normalized to the amounts of actin protein. Protein expression in cells transfected with the PR8-NS1-expressing plasmid was considered to be 100% for comparison with the level of expression by the other NS1 variants (numbers below the NS1 blot). Molecular mass markers (in kilodaltons) are indicated on the right. Three different experiments were performed, with similar results. (D and E) Human A549 cells were transfected with pCAGGS plasmids expressing the 1918-NS1-I64, 1918-NS-T64, or PR8-NS1 protein using DNA-IN. At 24 hpt, cells were either transfected with 100 ng of poly(I·C) (D) or treated with 250 U/ml of universal IFN-␣(E) to induce an antiviral cellular state. At 16 h posttreatment, cells were infected (MOI, 0.001) with VSV-GFP, and viral titers in the TCS were determined at 21 hpi. Bars represent the standard deviations from triplicates. Experiments were repeated 3 times in triplicate wells with similar results.Pvalues using Student’sttest are indicated.
on November 7, 2019 by guest
http://jvi.asm.org/
[image:12.585.135.449.65.497.2]tion when tested in cells related to those targeted during
natu-ral human infection (i.e., human airway epithelial [A549] cells)
(
41
).
To demonstrate that the differences in growth observed in
A549 cells were due to differences in the ability to mount an
effec-tive antiviral type I IFN response and the ability of r87 (I64) to
better overcome the antiviral state induced by type I IFN
com-pared to r85 (T64), MDCK cells were infected (MOI, 0.001) with
r85 and r87 viruses. After viral adsorption, cells were left untreated
(control) or were treated with 2,000 U/ml of universal type I
IFN-
␣
, and virus titers were determined at 24 and 48 hpi. After
IFN-
␣
treatment, compared to type I IFN-untreated cells, r85 viral
titers were decreased more than 20-fold (
⬃
95%) at both 24 and
48 hpi. In contrast, r87 viral titers were only decreased by 6- and
4-fold (
⬃
85 and 75%) at 24 and 48 hpi, respectively (
Fig. 7C
).
These data indicated that r85 virus containing T64-NS1 protein is
more sensitive to the antiviral effect of exogenous type I IFN than
r87 (I64) (
Fig. 7C
).
To test whether I64T mutation diminishes the NS1 protein’s
ability to counteract host innate immune responses in the context
of virus infection, MDCK cells constitutively expressing GFP and
Fluc reporter genes under the control of the IFN-

promoter
(MDCK IFN-

GFP-CAT/IFN-

Fluc) (
30
) were mock infected
or infected (MOI, 4) with either r85 or r87 virus (
Fig. 8A
). At 12
hpi, the activation of the IFN-

promoter was determined by
eval-uating GFP expression (data not shown) and quantifying the Fluc
activities (
Fig. 8B
). Importantly, comparable levels of infection in
MDCK IFN-

GFP-CAT/IFN-

Fluc cells were verified by
immu-nofluorescence using an anti-NP antibody (data not shown). The
levels of GFP signal in these cells were a reflection of the amounts
FIG 6IAV H3N2 NS1 protein I64T mutation decreases the binding to CPSF30 without significantly affecting the binding to dsRNA. (A) FLAG-tagged CPSF30 was expressed in 293T cells, mixed within vitro-synthesized HA-tagged NS1 variants, and immunoprecipitated using an anti-FLAG resin. Following SDS-PAGE, input and immunoprecipitated (IP) proteins were detected by Western blotting using antibodies specific for the HA tag (NS1 proteins) or the FLAG tag (CPSF30 protein). Western blots were quantified by densitometry using the software ImageJ (v1.46), and the amounts of NS1 proteins coimmunoprecipitated with CPSF30 were normalized to the amounts of CPSF30 proteins immunoprecipitated. The amounts of CPSF30 and NS1 proteins present in the input and in the coimmunoprecipitation using I64-NS1 protein (first lane) were considered 100% for comparison (numbers below each blot). (B) Poly(C)-conjugated (control) or poly(I·C)-conjugated beads were incubated with the indicatedin vitro-synthesized HA-tagged IAV H3N2 NS1 variants. Pulled-down NS1 proteins (P-D) were detected by Western blotting using an antibody specific for the HA epitope tag. Western blots were quantified by densitometry using the software ImageJ (v1.46), and the amounts of NS1 proteins pulled down with poly(I·C) or poly(C) were normalized to the amounts of NS1 proteins detected in the inputs before the pulldown. The amount of I64-NS1 protein in the input and after the pulldown was considered 100% for comparison with the amounts of the other NS1 variants (numbers below the NS1 blot). Three different experiments were performed with very similar results. The squares represent the combinations found in the subjects (Table 4), showing the number of the patient (85 or 87). Molecular mass markers (in kilodaltons) are indicated on the right. (C) Tridimensional protein structure of NS1-dsRNA binding domain. The NS1-dsRNA binding domain structure is based on the NS1 structure of influenza A virus A/crow/Kyoto/T1/ 2004(H5N1) (PDB entry2Z0A) and was created using Swiss-Model (52). The structure was colored using the MacPyMOL molecular graphics system (pymol-.org). Each monomer of the NS1-dsRNA binding domain is represented in light blue and green, respectively. The positions 38, 41, and 64 of NS1 protein are indicated and represented in yellow, blue, and red, respectively.
on November 7, 2019 by guest
http://jvi.asm.org/
[image:13.585.138.450.66.387.2]of IFN produced in cells infected with the NS1 mutant viruses. The
GFP signal was not detected in mock-infected cells, as expected
(data not shown). In r87 virus-infected cells, very low levels of
GFP expression were detected, consistent with the data showing