3rd High Performance Yacht Design Conference Auckland, 2-4 December, 2008
1 Research Fellow, Australian Maritime College, University of Tasmania
2 A/Prof. Cavitation and Fluid Dynamics, Australian Maritime College, University of Tasmania
THE EFFECT OF HEEL ANGLE AND FREE-SURFACE PROXIMITY ON
THE PERFORMANCE AND STRUT WAKE OF A MOTH SAILING DINGHY
RUDDER T-FOIL
Jonathan R. Binns1
j.binns@amc.edu.au
Paul A. Brandner2
p.brandner@amc.edu.au
Julien Plouhinec3
plouhiju@ensieta.fr
Abstract. The use of hydrofoils for sailing yachts is becoming more prolific. However its use in mainstream sailing classes has only become standard for the Moth dinghy class. The Moth class uses a twin T-Foil design, one on the centreboard for primary support and one on the rudder for additional support and control. The rudder T-Foil forms the basis of an experimental study carried out at the Australian Maritime College towing tank facility described here. Lift and drag data is presented for upright and heeled configurations considered indicative of windward sailing conditions. Force variation with respect to angle of incidence, depth of submergence and onset flow speed is presented using elliptical lift distribution parameters for easy design use. In addition deflection of the strut run-up was attempted to produce additional lift. Finally, a windward sailing condition prone to ventilation has been identified.
NOMENCLATURE
ARE effective aspect ratio c foil average chord CL lift coefficient CD drag coefficient h/c depth to chord ratio F force
S foil span
V flow velocity
α incidence
εN error in the Nth component φ heel angle
ρ density of water
1 INTRODUCTION
A full-scale T-Foil similar to the type used for the rudder on a Moth sailing dinghy has been tested in the Australian Maritime College’s towing tank facility at speeds equivalent to windward sailing conditions. The test rig was designed to accurately measure all 6 force and moments components. Flow visualisation was achieved by above and below free-surface still photography. The independent variables of incidence, depth of submergence, heel angle and onset flow velocity were varied to experimentally measure their effect on lift, drag, asymmetric wing loading and strut wake run-up. Foil ventilation was investigated for extreme sailing conditions. The use of hydrofoils for sailing yachts has been researched and implemented for some time [1], however general applicability has been low. The slow take up of this form of surface craft in sailing yacht design has primarily been due to the advanced structural requirements
[image:1.595.316.551.446.580.2]of supporting a sailing yacht on thin struts, the difficulty of maintaining foil borne operation with sudden ventilation and the dramatic increase in drag associated with coming off the foils [2]. These basic design restrictions are now being overcome on a regular basis for the Moth class of sailing dinghy, showing the way forward for general applications. Research of the basic T-Foils used in Moth dinghies has, however, been restricted to qualitative on-water tests.
Figure 1 A Moth dinghy on hydrofoils. Photo courtesy of Thierry Martinez, © www.thmartinez.com.
strut rooster tail can be seen on the centreboard T-Foil as observed during model experiments.
[image:2.595.317.553.70.387.2]There is circumstantial evidence to suggest that the dynamic control provided by the rudder T-Foil is at risk of ventilation. Therefore, this project has focused on the rudder T-Foil. The initial results from this study can be used for the design of rudder T-Foils to optimise the foil parameters in the vicinity of the free-surface. The effects of heel angle have been measured at an angle of 30°. It has been found that under windward sailing conditions ventilation of the rudder T-Foil is very unlikely, however one extreme design condition has been identified as prone to ventilation. It was also observed during experiments that significant strut wake run-up occurs, producing a significant “rooster-tail” jet. Combined with ventilation protecting fences, this jet may provide additional lift. This design possibility has been investigated.
Figure 2 The tested T-Foil dimensions are shown in the top image. Actual foil is shown in the foreground of the lower image. Actual Moth rudder T-Foil is shown behind. Force balance can be seen in the background.
Figure 3 The top image is a schematic of the deflectors, the quarter circle is fitted to the strut. The bottom image shows the half circle, 180°, (left) and quarter circle, 90°, (right) deflector attachments.
2 TESTING EQUIPMENT
2.1 Force and moment measurements
A six-component force balance was used for all force and moment measurements. The design of the force balance has been described in Binns and Brandner [3]. The foil assembly was attached to the force balance via an index plate capable of heeling. The index markings on the plate permitted accurate and repeatable setting of incidence of the foil such that the quarter-chord of the foil remained at a constant depth during angle changes. Some design drawings of the experimental attachments are presented in Merzliakov [4].Two attachments for the strut were machined from uerol plastic to clamp around the strut, shown inverted in Figure 3. These attachments were designed to deflect the strut run-up either 180° (the half circle) or 90° (the quarter circle) from the vertical. These were designed in an attempt to deflect the strut run-up jet to produce extra lift from the T-Foil assembly.
2.2 Error estimates
[image:2.595.56.284.295.642.2]and the error on the density measurement has been assumed as negligible.
The above mentioned errors can be propagated from a Taylor series expansion of the uncertainty in these measurements as detailed in Binns [5] and also Brandner [6]. The end result of this analysis is that the error in a force coefficient can be approximated by
,
(1)
[image:3.595.317.552.190.437.2]where εN is the error in the Nth component, ρ is the density of water, V is the flow velocity, s is the foil span, c is the foil average chord and F is the force.
Figure 4 Moth dinghies sailing to windward competing in the 2008 world championships. Heel angles measured from this and similar photos have been used to estimate windward heeling angles at 20-30° to windward. Photo courtesy of Thierry Martinez, © www.thmartinez.com.
3 EXPERIMENTAL PARAMETER VARIATIONS
The velocity (V), heel angle (φ), incidence (α) and depth to chord ratio (h/c) variations are detailed in Error! Reference source not found.. The first two series in this table were conducted at 1° angle increments to establish baseline lift and drag data upright and at 30° heel angle. The choice of 30° heel angle appears to be an extreme sailing angle, however, from Figure 4 and many similar images captured by Thierry Martinez windward heel angles have been estimated to consistently range from 20-30° to windward. It is likely that an optimum windward condition for the dinghies exists at this heel angle as it: maintains maximum righting arm for the crew; introduces a transverse centre of gravity shift to windward for the hull and rig; and rotates the T-Foils such that lift is provided to windward.
The third series established the dependence of this data within the linear lift to incidence region on depth to chord ratio. The fourth series investigated ventilating the foil by tip emergence. The fifth series investigated Froude and Reynolds number (based on foil chord) variations and the sixth and seventh series investigated the effects of the
Although Reynolds and Froude numbers have been varied simultaneously, the Froude number is of greatest importance and has been plotted as the independent variable. The results are most dependent on Froude number as the flow field contains: wave-making resistance; pressure relief through free-surface deformation; and the formation of ventilated cavities. All of these phenomena are dominated by gravity induced waves.
Table 1 Experimental test matrix
Series V (m/s) φ (°) α (°) h/c
1 4 0 -2 - 16 3.333
2 4 30 -2 - 16 3.333
3 4 0 4 – 6 – 8 0.000 – 3.333
4 4 30 0 - 14 Tip ± 5 mm to
the free surface
5 1.0 – 3.5 0 4 – 6 – 8 3.333
6 4 0 4 – 6 – 8 1.667 with deflectors
7 4 0 4 - 6 - 8 0.417 with deflectors
4 EXPERIMENTAL RESULTS
The lift coefficient variation with respect to T-Foil incidence is plotted in Figure 5 for a heel angle (φ) of 0°. In addition the lift coefficient for φ = 30° has been plotted such that the lift axis has been rotated by the angle of heel, ie. it is always oriented positive up along the strut.
The drag coefficient is plotted with respect to the lift coefficient in Figure 6. As in the previous figure the lift coefficient is along the axis of the strut.
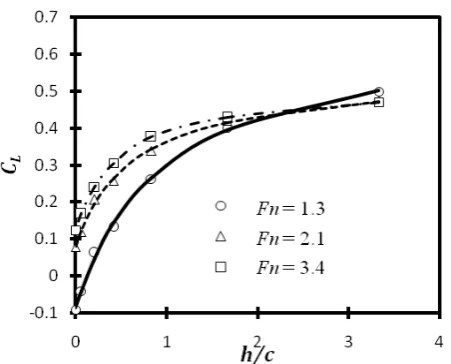
The lift and drag coefficient variations with respect to depth to chord ratio (h/c) are plotted in Figure 7 and Figure 8 respectively for three different angles of attack. Similarly the lift coefficient variation with respect to depth of submergence is plotted in Figure 10 for three different Froude numbers. The data in these three graphs are all for the upright condition.
4.1 Discussion on experimental results
[image:3.595.57.286.264.411.2]distribution and reduced leeway angle as mentioned in the introduction.
Upon further examination, the lift data plotted in Figure 5 display signs of two distinct lift slopes. The first occurs up to an angle of attack of around 5°, the succeeding reduced lift slope occurs from around 8° until stall of 15°. Between the two lift slope regions there is evidence of a laminar separation bubble in the small dip in the lift curve.
[image:4.595.319.547.69.258.2]The data in Figure 6 displays signs of a small drag bucket up to a lift coefficient of 0.5. This point is the onset of the secondary lift slope mentioned in the previous paragraph.
Figure 5 Variation of lift coefficient along the strut axis with incidence (α) for a set depth to chord ratio of 3.333. Error estimates using Equation (1) are within the symbol size. Series are for the upright case and for the 30° heel case.
[image:4.595.46.277.213.419.2]Figure 6 Variation in drag coefficient with lift coefficient.
[image:4.595.319.548.304.488.2]Figure 7 Variation in lift coefficient with depth to chord ratio for three incidences. All series are for heel angle (φ) = 0°.
Figure 8 Variation in drag coefficient with depth to chord ratio for three incidences. All series are for heel angle (φ) = 0°.
[image:4.595.60.284.487.693.2]Figure 9 Variation in drag coefficient with depth to chord ratio for three Froude numbers. All series are for heel angle (φ) = 0°.
Figure 10 Variation in lift coefficient with depth to chord ratio for three chord based Froude numbers. All series are for heel angle (φ) = 0°.
5 USE OF EXPERIMENTAL RESULTS FOR DESIGN
5.1 Lift slope, effective aspect ratio, base drag and zero incidence lift
As detailed in Error! Reference source not found. data was obtained for all h/c and Fn values tested for incidences of 4°, 6° and 8°. Therefore, using least squares fits to the data, estimates for the following parameters could be obtained.
, and (2)
. (3) Where A is the lift slope, B is the zero incidence lift
coefficient, C is and D is the zero incidence drag, or base drag.
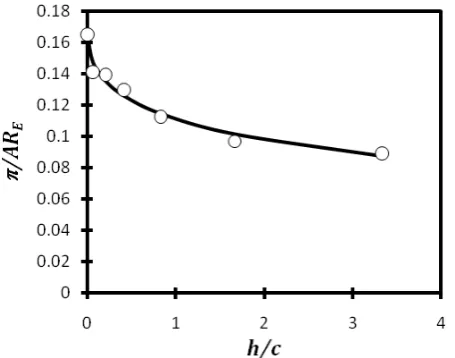
Lift slope variation with respect to depth to chord ratio is presented in Figure 11, and with respect to Froude number in Figure 12. From both figures a decrease in h/c or a decrease in Fn can be seen to decrease the lift slope. The decrease in lift slope with respect to h/c is due to pressure relief from free surface proximity and forms a natural method of obtaining vertical force balance without the foil coming too close to the surface. The sharp decrease of lift slope for Fn < 2.0 demonstrates the difficulty these vessels have at maintaining foil borne operation throughout manoeuvres.
The extrapolated values for the zero incidence lift coefficients are presented in Figure 13 for a variation in h/c and in Figure 14 for a variation in Fn.
[image:5.595.318.544.558.738.2]The proportion of drag increase with respect to lift increase for the two design scenarios are shown in Figures 15 and 16. The extrapolated values for drag with zero lift are shown in Figures 16 and 17. The data in Figures 11 through to 18 can be used in conjunction with Equations (2) and (3) to provide interpolated data for lift and drag on Moth T-Foils.
Figure 11 Lift slope (A in Equation (2)) variation with respect to depth to chord ratio for a constant Fn = 3.4.
Figure 13 Zero incidence lift coefficient (B in Equation (2)) variation with respect to depth to chord ratio for a constant Fn = 3.4.
Figure 14 Zero incidence lift coefficient (B in Equation (2)) variation with respect to Froude number for a constant h/c = 3.333.
[image:6.595.62.286.311.492.2]Figure 15 Inverse of the effective aspect ratio (C in Equation (3)) variation with respect to depth to chord ratio for a constant Fn = 3.4.
[image:6.595.321.546.311.495.2]Figure 16 Inverse of the effective aspect ratio (C in Equation (3)) variation with respect to Froude number for a constant h/c = 3.333.
Figure 17 Base drag (D in Equation (3)) variation with respect to depth to chord ratio for a constant Fn = 3.4.
[image:6.595.321.545.543.723.2] [image:6.595.60.288.548.727.2]5.2 Deflectors
The deflectors shown in Figure 3 were attached to the strut in an attempt to deflect the significant rooster tail to produce additional lift. The rooster tail can be clearly seen in the photo of Figure 1 and in the upper image of Figure 19. Figure 19 also shows (middle and bottom images) that the deflectors were successful in removing the rooster tail and deflecting the flow back towards the free surface. However, to within experimental error there was no discernable increase in lift force with the addition of the deflectors. At greater than 8° incidence some increase in drag was noticed. Deflector height from the free surface and depth to chord ratio was altered, however no gain was measured.
Although deflection of the rooster tail has been achieved, which may aid in reducing wetting of the lower sections of the hull, there are no measured performance gains available from this flow manipulation. It has been concluded from consideration of the change of fluid momentum that the lack of lift increase is due to three dimensional flow effects reducing the angle change within the deflectors.
5.3 Ventilation
Out of all the conditions listed in Error! Reference
[image:7.595.317.547.62.633.2]source not found., only one showed evidence of ventilation. The condition that showed an unstable ventilation regime was at φ = 30°, Fn = 3.4, α = 14° with the high side tip quarter chord 5 mm above the water surface in the static condition. In this condition under dynamic loading the tip is fully submerged due to a large bow wave forming at the nose of the T-Foil. It was found that if the angle of attack was reduced or the tip submergence was increased then ventilation disappeared. This condition may appear to be unrealistic, however the photograph presented in Figure 22 demonstrates that it does occur. Within this photograph the leeward tip of the centreboard T-Foil can be seen to emerge through the free surface resulting in possible ventilation. It is for this reason that this condition is the subject of further investigation.
Figure 20 Estimate of variation of drag with respect to h/c for 40 kg of lift at 12 knots based on the experimental data presented in this paper.
6 SAMPLE DESIGN OPTIMISATION
A simple design optimisation process has been undertaken using the data presented above. The optimisation process can be described as follows:
1. a required lift force is given as a percentage of the total weight of the dinghy and crew;
2. a sailing speed is given from previous data; 3. for any given incidence h/c can be varied until the
required lift force (from step 1) is obtained using Equation (2);
4. for all incidences the drag force can be estimated from Equation (3); and finally
5. the condition with the lowest drag in step 4 can be selected as the optimum for the given lift force and speed. This step provides the design information of h/c and incidence required.
The process described above has been completed for a lift force of 40 kg and sailing speeds of 9, 10, 11 and 12 knots. A sample plot of drag estimate variation with respect to h/c is shown in Figure 20. From this figure, and many similar others, a clear optimum can be seen with respect to minimizing the total drag at a given lift.
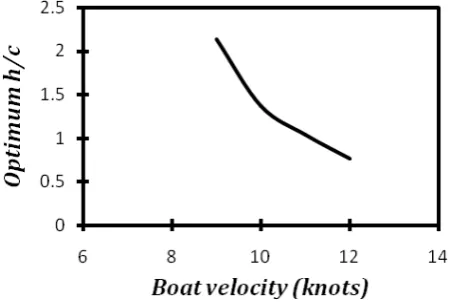
The reasons for the optimum appearing are that with decreased h/c the strut becomes less immersed, hence decreasing drag. However, also with reduced h/c, the foil becomes less efficient due to free surface proximity. The next interesting design consequence is that as the vessel velocity increases the magnitude of the lift coefficient can decrease for a constant lift requirement. Therefore a new optimum can be found for each vessel velocity. This optimization process has been carried out for speeds varying from 9 to 12 knots and is presented in Figure 21. From this figure the optimum h/c value can be seen to decrease markedly with vessel velocity.
All of the above mentioned optimization process has been carried out using the data presented in this paper. Other more sophisticated optimization could be carried out with
incorporation of this data into a velocity prediction program.
[image:8.595.319.546.104.255.2]Figure 21 Variation in optimum h/c with respect to boat velocity
Figure 22 Moth dinghy sailing to windward. Due to a very low h/c ratio and a high heel angle the tip of the centreboard has emerged through the free surface. Photo courtesy of Thierry Martinez, © www.thmartinez.com.
7 CONCLUSIONS AND RECOMMENDATIONS
[image:8.595.323.545.312.585.2]to gains made in weight distribution and reduced leeway angles.
Variation of the lift and drag acting on the T-Foil with depth to chord ratio show well behaved and self consistent changes. The changes are due to free-surface pressure relief; however the variation of lift and drag can be described very well by elliptical distribution approximations. The lift and drag data collected has been parameterised with respect to four coefficients varying across depth to chord ratio and Froude number. This data could be used to design optimum conditions with respect to windward sailing for the Moth dinghy.
An attempt was made to deflect the significant strut rooster tail to produce a lift augmentation. It was found that although the strut run-up was indeed deflected as desired, no performance benefit was measured.
Finally a windward sailing design condition has been identified that displayed a repeatable ventilation of the suction surface of the T-Foil. This condition has also been identified in sailing pictures of Moth dinghies.
Further research on this topic will include a full description of the ventilating condition. Evidence of force and moment effects just prior to ventilating will also be investigated. Through these investigations a greater understanding of hydrofoil operation for sailing yachts will be obtained.
Acknowledgements
The authors have made use of equipment developed under the Australian Research Council Discovery Project DP0211956. In addition the towing tank at the Australian Maritime College was used for all tests described within this paper.
The authors would like to thank Jonathan Emonson for the loan of his rudder T-Foil. A number of assistants helped with initial design of the attachment of the foil to the force balance, in particular Misha Merzliakov.
Finally the authors would like to thank Thierry Martinez for the provision of photographs of T-Foil operation.
References
1. Bose, N. (1981), “Model tests for a wind-propelled hydrofoil trimaran” High-Speed Surface Craft, 20(10): 28-31
2. Milne, R.S. & Helmore, P.J. (2008), “Hydrofoils applied to canting-keel yachts”, The Australian Naval Architect, 12(2): 34-39
3. Binns, J.R. & Brandner, P.A. (2003), “Yacht testing at the Australian Maritime College”, International Conference – The Modern Yacht, RINA, London, UK, 145-156
4. Merzliakov, M., (2007), “An experimental investigation of a T foil in the vicinity of the free surface”, AMC Final Year Thesis
5. Binns, J.R., (2005), “Extreme motions of modern sailing yachts – quantifying re-righting”, AMC PhD Thesis