Qualitative and quantitative evaluation of glucosinolates in cruciferous plants
during their life cycles
Natalia Bellostas, Jens C. Sørensen, Hilmer Sørensen
Department of Natural Sciences, Biochemistry and Natural Product Chemistry, The Royal Veterinary and Agricultural University, Frederiksberg (Denmark).
Corresponding author: Hilmer Sørensen, Department of Natural Sciences, Biochemistry and Natural Product Chemistry, The Royal Veterinary and Agricultural University. Thorvaldsensvej 40, DK-1871 Frederiksberg C, Denmark. Tel. +45 35282432; fax: +45 35282398; e-mail hils@kvl.dk; phone INTRODUCTION
Glucosinolates are alkyl-N-hydroximine sulphate esters with a β -D-thioglucopyranoside group attached to the hydroximine carbon in Z-configuration rela-tive to the sulphate group (Ettlinger and Kjær, 1968; Kjær, 1960; Sørensen, 1990). These compounds are allelochemicals biosynthetically derived from amino acids (Hill et al., 2003) and they occur in all plants of the Capparales order and in some other plants (Bjerg and Sørensen, 1987; Kjær, 1960; Rodman, 1978). Glucosinolates co-occur w i t h m y r o s i n a s e i s o e n z y m e s (Thioglucosidase; EC 3.2.1.147), which catalyze the hydrolysis of the β -D-thioglucopyranoside bond (Bellostas et al., 2003; Bjergegaard et al., 1994; Bjergegaard et al., 2003; Petersen et al., 2003). The released aglucones form a variety of biologically ac-tive products with structures defined by the type of glucosinolate and the reaction condi-tions (Bjergegaard et al., 1994; Buskov et al., 2000a; Buskov et al., 2000b; Buskov et al., 2000c; Palmieri et al., 1998). These break-down products can be chemically very reac-tive, and they have for a long time been known for their biologically active charac-teristics, such as antinutritional (Bjerg et al., 1989; Hansen et al., 1997), anticarcinogenic (Bonnesen et al., 1999), fungicidal or bacte-ricidal properties (Angus et al., 1994; Brown
SUMMARY
Glucosinolates produced by Brassica species were investigated in relation to biofumigation, a term used to describe the effects some allelochemicals, including glucosinolate derived products, may have on soil-borne pathogens or other herbivores. Four Brassica species of the U-triangle, namely B. nigra (L.) Koch, B. carinata Braun, B. juncea (L.) Czern. and B. rapa L. were compared with respect to their qualitative and quantitative glucosinolate profiles in roots, stems, leaves and reproductive organs. Plants were monitored at four different development stages and the total glucosinolate content as well as their dry matter production as an indication of their potential biomass under field conditions were determined. Glucosinolate levels of up to 120 ìmol g -1 DMwere found in B. nigra and B. juncea, while B. rapa did not show values over 25 ìmol g-1 DM at any stage of the investigated
plant life cycles. In the three species at the top of U-triangle, reproductive tissues showed the highest glucosinolate concentration when compared to the rest of the plant parts, while in B. rapa, the roots were the organs with the highest glucosinolate concentration. The glucosinolate profile of the different plant parts of the species studied changed during the growth cycle, showing that the trade-off between glucosinolate profile and biomass production should be optimized in order to maximize the biofumigation effect of a crop. However, further information on other allelochemicals and on the different types of glucosinolate derived products resulting from autolysis or myrosinase catalyzed hydrolysis of glucosinolates at different reaction conditions is needed for the appropriate description of the potential biofumigation effects of different crops.
Key words: biofumigation, glucosinolates, brassica, U-triangle, growth cycle.
and Morra, 1997; Buskov et al., 2002; Kirkegaard and Sarwar, 1998). Special inter-est also derives from the potential of these compounds for controlling soil-borne patho-gens (Chan and Close, 1987; Gardiner et al., 1999), a process that has been termed ‘biofumigation’ (Angus et al., 1994).
Over 130 glucosinolates have been identi-fied of which more than 30 are present in
Brassica species (Fahey et al., 2001; Sørensen, 2001). The type and concentra-tion of glucosinolates have been found to vary between Brassica species as well as between cultivars of the same species (Bradshaw et al., 1984; Kirkegaard and Sarwar, 1998; Rangkadilok et al., 2002; Sang
et al. 1984). Different tissues of the same plant also present quantitative and qualita-tive differences in their glucosinolate con-tent, with other factors such as plant age and environmental growth conditions influenc-ing glucosinolate profile (Clossais-Besnard and Larher, 1991; Sang et al., 1984; Sarwar and Kirkegaard, 1998).
To maximize the potential benefits of biofumigation it is therefore essential to evaluate glucosinolate levels and patterns in
Brassica species and to investigate the plant tissues that will give the required concentra-tion of glucosinolate derived products, as well as determining the timing of their produc-tion (Rosa and Rodrigues, 1999). The aim of the present study was to investigate the glucosinolate profiles and concentrations in different plant tissues of cruciferous crops during their growth cycle, in order to com-pare them on the basis of their potential biofumigation properties. Four Brassica
species, namely B. nigra (L.) Koch, B.
carinata Braun, B. juncea (L.) Czern. and B. rapa L. were selected on the basis of their genetic relationships (U, 1935; Snowdon et al., 2003). These species were compared with respect to their glucosinolate profiles in roots, stems, leaves and reproductive or-gans at different development stages. Dry matter production of the different plant tis-sues of the four species throughout the grow-ing cycle was also determined in order to give a more accurate estimation of their biofumigation potential.
MATERIALS AND METHODS Plant material and growth conditions
The experiment was conducted between February and July 2003 in the greenhouses of The Royal Veterinary and Agricultural University (KVL) at Højbakkegaard, Taastrup, Denmark. Four different Brassica species were used in the study: B. carinata
Braun cv BRK-147-A, B. rapa L. cv Harmoni, B. nigra L. Koch cv Giebra and B. juncea L. Czern cv Cutlass. Seeds were ob-tained respectively from ITGA (Spain), ENHANCE project (CETIOM; France) and Svalöf Weibull (Sweden) for the last two species. Seeds of a single species were sown into 24 L pots (40*30*20 cm3;
length:width:height) and seedlings thinned after emergence leaving a total number of 12 plants per pot. Three replicates were estab-lished for each species. The potting mix used was Pindstrup Substrate No. 1, 0-20 mm sieved and with a pH 6 (Pindstrup Mosebrug A/S Denmark). Pots were watered for four-six minutes per day with a nutrient solution (Pioner NPK MAKRO 14323+Mg) which contained the following nutrients: 14.5%
Ntotal, 10.7% NO3N, 3.8% NH4N, 2.9% water soluble P, 23.1% water soluble K, 3.0% water soluble Mg and 3.9% water solu-ble S. The nutrient solution was mixed with water to a EC=1.3 mS and regulated with 62% HNO3 to a pH of 5.5. Temperature in the greenhouse was kept at 15ºC during the day and 12ºC during the night with a pho-toperiod of 13-11 hours (day-night).
Sampling and analysis
Samples were taken at four different key stages of plant development: leaf, bud, flower and seed. The stages chosen were, according to Berkenkamp (1973): 1.4 (four leaves), 2.3 (pedicels elongating), 3.1 (many flowers open) and 4.0 (seeds in lower pods full size). A total of three plants per species (one plant per replicate) were sampled at each growth stage. Plants were removed intact from the pots, the roots carefully washed with tap water and the whole intact plants were then freeze-dried. Once dried, the plants were separated into roots, stems, leaves and re-productive tissues and their weight deter-mined. The material was then thoroughly milled and kept dried until extraction.
Glucosinolates were extracted, desulphoglucosinolates produced and the individual compounds were determined by MECC according to standard procedures with use of two internal standards as described elsewhere (Bjerg and Sørensen, 1987; Michaelsen et al.,1992; Sørensen et al, 1999).
RESULTS
Total glucosinolate concentration and distribution among plant parts
The four species followed different pat-terns during growth with respect to total glucosinolate concentration (Fig. 1). Total glucosinolate content increased from the first (leaves) to the second (buds) growth stage in
B. carinata, B. nigra and B. juncea, with the last species being the one that showed the greatest increase. B. nigra and B. juncea sub-sequently showed the same pattern with a decrease in glucosinolate content at the third stage (flower) followed by a new increase towards the last stage monitored (green seeds). Total glucosinolate concentration in-creased in B. carinata until the flower-stage, decreasing afterwards until the green seed stage, while in B. rapa a steady decrease from the first to the last growth stage was observed.
Glucosinolate distribution among plant parts varied with plant age and species (Fig. 1). The roots generally showed a higher glucosinolate concentration in the first growth stage monitored (leaves) than later in the growth. Glucosinolate content of stem and leaves showed a slight decrease during the growth with total concentrations generally below 15 ìmol g-1 DM. Buds showed a large
glucosinolate concentration in all species ex-cept for B. rapa, with amounts that varied from 40 to 65 ìmol g-1 DM in B. nigra and B.
juncea respectively. The glucosinolate con-centration in the reproductive organs de-creased from this stage to the flowering stage, although values as high as 40 ìmol g-1 DM
were reported in flowers of B. juncea. Total glucosinolate concentration increased in re-productive organs towards the end of the growth, and in the last growth stage values as high as 98 ìmol g -1 DM were found in
pods of B. nigra.
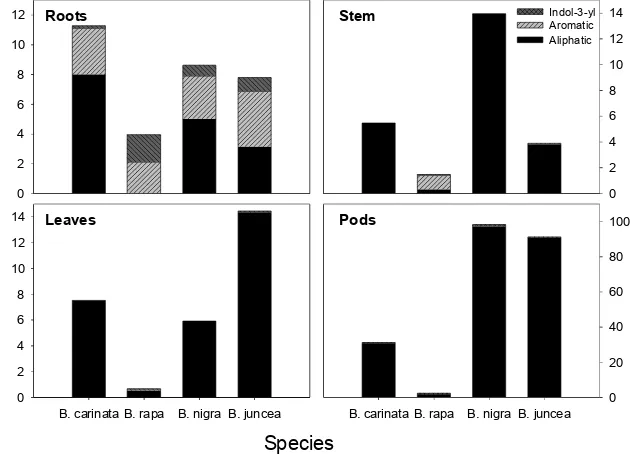
Glucosinolate profiles
The distribution of the different types of glucosinolates varied among plant parts
dur-ing the growth cycle. Figure 2 shows the type of glucosinolates (aliphatic, aromatic, indol-3-ylmethyl) present in the different plant parts of the Brassica species at the last growth stage. Aliphatic glucosinolates were mainly present in the vegetative parts of the species, although they also accounted for approximately 50% of the glucosinolate content of the roots in all species, with the exception of B. rapa (Fig. 2).
Phenethylglucosinolate was the only aro-matic glucosinolate present in the species studied, being the dominant compound in the roots of B. rapa from the second growth
Harvests
020 40 60 80 100
0 10 20 30 40
1 2 3 4
0 20 40 60 80 100 120 140
1 2 3 4
0 20 40 60 80 100 120 140
B. carinata B. rapa
B. nigra B. juncea
Roots Stem Leaves Reproductive
Gl
uco
si
na
te c
onc
ent
rat
io
n (
m
o
l g
D
M
)
µ
-1
Gl
uc
os
inat
e co
nce
ntr
at
ion (
m
ol
g DM
)
µ
-1
B. carinata B. rapa B. nigra B. juncea 0
2 4 6 8 10 12 14
B. carinata B. rapa B. nigra B. juncea 0 20 40 60 80 100 0
2 4 6 8 10 12
0 2 4 6 8 10 12 14 Stem
Leaves Pods
Roots
Aliphatic Aromatic Indol-3-yl
[image:2.609.228.560.37.279.2]Species
Figure 1. Glucosinolate concentration (ìmol g DM-1) in the different plant parts at the four
growth stages monitored for the four species.
Figure 2. Concentrations (ìmol g DM-1) of different glucosinolate types (aliphatic, aromatic and
[image:2.609.243.558.338.565.2]stage and representing around 50% of root glucosinolates in B. juncea. It was the domi-nant glucosinolate in roots of B. carinata and
B. nigra in the first two growth stages, but sub-stituted by prop-2-enylglucosinolate towards the end of the investigated growth cycle.
B. rapa contained a higher proportion of indol-3-ylmethylglucosinolates compared to the other species during the period investi-gated. B. nigra and B. juncea showed the same pattern of distribution of indol-3-ylmethylglucosinolates along the growth cy-cles, with a slight increase in roots and a decrease in vegetative tissues, but with total concentrations generally lower than 10%. Indol-3-ylmethylglucosinolate concentra-tions decreased in B. carinata along the growth cycle, however, this species showed a higher concentration of indol glucosinolates than B. nigra and B. juncea in the first growth stage.
Dry matter production
Even though greenhouse conditions for plant growth are far from those encountered in the field it was considered important to determine the dry matter production of the different tissues of the plants at the differ-ent stages of their growth cycle in order to have an estimation of the biofumigation po-tential of the species studied. All species in-creased their dry matter production steadily (Table 1), until the last growth stage in which
nearly a three-fold increase was observed with respect to the previous growth stage monitored. This was mainly due to the in-crease in the weight of the reproductive tis-sues when the seeds started to be formed. Roots increased their biomass steadily
dur-ing growth while stems showed a great in-crease from the third to the last growth stage monitored. Leaves showed a great increase from the first to the second growth stage and from then on their biomass was kept con-stant throughout growth.
Biomass (g DM plant-1)
Species
Growth stage Root Stem Leaves Reproductive Total
B. carinata 1 0.01 0.01 0.16 - 0.18
2 1.00 7.91 5.63 0.17 14.71
3 2.31 9.08 5.57 0.45 17.41
4 4.37 34.31 4.69 7.81 51.18
B. rapa 1 0.01 0.03 0.14 - 0.18
2 1.00 8.71 3.02 0.25 12.97
3 0.65 5.37 2.45 0.60 9.08
4 3.12 16.00 3.08 6.98 29.17
B. nigra 1 0.01 0.01 0.09 - 0.11
2 1.36 9.75 5.07 0.65 16.82
3 2.11 13.88 5.15 2.71 23.85
4 2.79 38.12 7.20 27.56 75.66
B. juncea 1 0.01 0.02 0.14 - 0.17
2 0.73 2.21 3.04 0.23 6.21
3 1.57 5.62 3.00 0.71 10.90
[image:3.609.229.558.54.293.2]4 1.60 11.52 3.87 15.09 32.09 Table 1. Dry matter production of the different plant tissues of the four Brassica species at the four growth stages monitored.
* Assuming 100 plants m-2, 10 cm depth incorporation & soil bulk density of 1.4 g m-2 (Kirkegaard and Sarwar, 1998).
Total glucosinolate production ( mol plant
µ
-1)
Species
Growth
stage
Root Stem Leaves
Reproductive Total
Total
*(nmol g
-1soil)
B. carinata
1 0.29
0.16
0.70
/ 1.16
0.83
2 16.62
27.64
63.46
6.01 113.73
81.23
3 27.44
25.31
52.03 22.39 127.17
90.83
4 49.34
188.31
35.24 243.10 516.00
368.57
B. rapa
1 0.04
0.33
0.36
/ 0.73
0.52
2 6.26
12.89
0.48 1.38 21.01
15.01
3 5.61
3.55
1.26 1.71 12.13
8.66
4 12.37
23.46 2.05 16.33 54.22
38.73
B. nigra
1 0.14
0.13
0.67
/ 0.94
0.67
2 5.63
40.81
56.53 26.31 129.28
92.34
3 9.52
54.73
41.01 82.94 188.21 134.44
4 24.06
531.66
42.48 2709.86 3308.06 2362.90
B. juncea
1 0.22
0.19
1.35
/ 1.76
1.26
2 12.96
11.40
25.25 15.46 65.06
46.47
3 7.53
27.03
11.72 29.89 76.17
54.41
4 12.50
44.78
53.35 1379.37 1490.00 1064.29
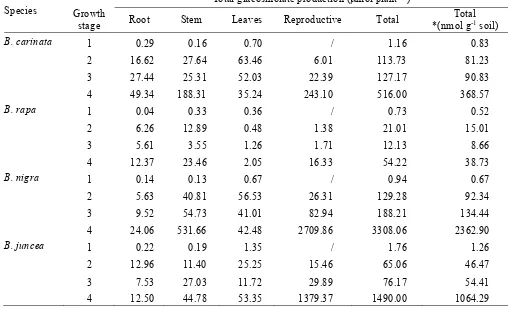
Table 2. Whole plant and tissue contribution to total glucosinolate production (ìmol plant-1 and nmol g-1 soil) of the four species at the four growth
[image:3.609.49.564.410.719.2]Biofumigation potential
The total glucosinolate production of the different plant tissues as well as of the whole plant was calculated on the basis of the glucosinolate concentration and the biomass production (Table 2). The maximum values were achieved at the last harvest, when both the total glucosinolate concentration in the plant and the biomass produced are at a maxi-mum. The final glucosinolate concentration per g of soil was also estimated based on a plant density of 100 plants m-2, a depth of
10 cm for incorporation of the plant material and a soil bulk density of 1.4 g cm-3.
DISCUSSION Glucosinolate profiles
The dominance of aliphatic glucosinolates in plant parts of B. carinata, B. nigra and B. juncea has been previously reported, with prop-2-enylglucosinolate described as the major glucosinolate present in these species (Mnzava and Olson, 1989; Rangkadilok et al., 2002; Sang et al., 1984; Sarwar and Kirkegaard, 1998). B. rapa showed a rela-tively higher proportion of indol-3-ylmethylglucosinolates when compared to the other species, especially in roots and re-productive tissues. This may be due to the lower relative concentration of the aliphatic fraction of glucosinolates typical for a “dou-ble-low” species.
The relative glucosinolate concentrations described in our experiment can be expected to remain constant for a given species inde-pendently of the screening environment,
since it has been described that major glucosinolates and their relative proportions are relatively stable for particular species (Sarwar and Kirkegaard, 1998).
Total glucosinolate concentration and distribution among plant parts
The differences in total glucosinolate con-centration among the four species might re-flect the different characteristics of the cultivars used, since B. rapa was the only “double-low” cultivar tested as mentioned above.
Greenhouse screening is not considered optimal for the estimation of total glucosinolate production of a cultivar, since environmental conditions have an influence on glucosinolate concentration (Sarwar and Kirkegaard, 1998). This might explain why in the present experiment values of total glucosinolate concentration at a particular growth stage were in most cases, greater than those described in the literature (Rangkadilok
et al., 2002; Sarwar and Kirkegaard, 1998). The pattern of change of the glucosinolate concentration along the growth cycle was however, similar to what has been previously described for Brassica species (Fieldsend and Milford, 1994; Rangkadilok et al., 2002; Sarwar and Kirkegaard, 1998). The higher glucosinolate content observed in the repro-ductive organs compared to the other veg-etative parts in all species, suggests that the exploitation of the biofumigation potential of these species might be optimal at the later stages of their growth, if the agronomic con-ditions allow it and always avoiding the risk
of seed-set. The decrease in glucosinolate content of the root tissues throughout the growth cycle has also been reported (Sarwar and Kirkegaard, 1998) and the high propor-tion of root glucosinolates in B. rapa com-pared to the other species is probably due to the fact that is a “double-low” cultivar. The high glucosinolate content of roots of the species at the first growth stage might make it interesting to utilize them at this early stage, however, the low biomass of the roots would almost certainly not be sufficient for a biofumigation effect to occur (Table 2).
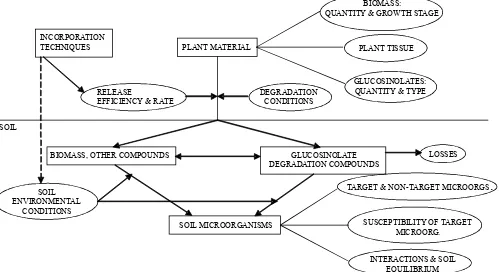
Biofumigation potential
Differences in the biofumigation potential of the species studied can be expected on the basis of their glucosinolate profiles as well as of their total glucosinolate production. In general, the combination of a high glucosinolate production with the highest dry matter production towards the end of the growing period would make these stages op-timal for biofumigation. However, these should not be the only factors to take into account, since many other parameters might influence the outcome of biofumigation (Fig. 3). Incorporation of plant material into the soil plays an important role in determining a maximum glucosinolate release and different techniques for an appropriate tissue break-down have already been investigated (Matthiessen et al., 2004). Knowledge on the cycle of the pathogen in the soil and po-tential side-effects towards beneficial micro-organisms is also necessary (Bending and Lincoln, 2000). Finally, the involvement of
BIOMASS, OTHER COMPOUNDS
PLANT MATERIAL INCORPORATION
TECHNIQUES
DEGRADATION CONDITIONS RELEASE
EFFICIENCY & RATE
BIOMASS:
QUANTITY & GROWTH STAGE
GLUCOSINOLATES: QUANTITY & TYPE
PLANT TISSUE
LOSSES
SOIL MICROORGANISMS SOIL
ENVIRONMENTAL CONDITIONS
SUSCEPTIBILITY OF TARGET MICROORG.
TARGET & NON-TARGET MICROORGS
.
INTERACTIONS & SOIL EQUILIBRIUM GLUCOSINOLATE
[image:4.609.60.559.45.317.2]DEGRADATION COMPOUNDS SOIL
other bioactive compounds present in the plant tissue, which may act independently or synergistically with glucosinolate derived products has also been suggested (Brown and Morra, 1997).
Determining the type of glucosinolates present in a certain species might be the first step for the assessment of its biofumigation potential, since transformation products re-sulting from glucosinolate hydrolysis have different toxicities due to their variation in structural types, physical and chemical prop-erties (Bjergegaard et al., 1994; Buskov et al., 2000a; Buskov et al., 2000b; Buskov et al., 2000c; Palmieri et al., 1998). However, environmental conditions, such as pH or the presence of certain ions, influence the out-come of the myrosinase hydrolysis of a given glucosinolate (Brown and Morra, 1997). Further investigation of the different types of products resulting from myrosinase catalyzed hydrolysis of glucosinolates at different reaction conditions is therefore im-portant in order to better define the oppor-tunities of biofumigation as a realistic con-trol method of soil-borne pathogens.
REFERENCES
Angus J. F., Gardner P. A., Kirkegaard J. A., Desmarchelier J. M., 1994.
Biofumigation: isothiocyanates released from brassica roots inhibit growth of take-all fungus. Plant and Soil 162, 107-112. Bellostas N., Jørgensen A.L.W., Lundin
N.V.F., Petersen I.L., Sørensen H, Sørensen J.C. Sørensen R. and Tidmand K.D., 2003. Comparison of physico-chemical properties of myrosinase isoenzymes in seeds of Brassica species of the U triangle. In: Proceedings of the 11th
International Rapeseed Congress, Copenhagen, Denmark, pp. 720-723. Bending, G. D., Lincoln, S. D., 2000.
Inhibition of soil nitrifying bacteria communities and their activities by glucosinolate hydrolysis products. Soil Biology and Biochemistry 32, 1261-1269. Berkenkamp B., 1973. A growth-stage key
for rape. Canadian Journal of Plant Science 53, 413.
Bjerg B., Sørensen H., 1987. Quantitative analysis of glucosinolates in oilseed rape based on HPLC of desulfoglucosinolates and HPLC of intact glucosinolates. In: Wathelet J. P. (ed.). World Crops: Production, Utilization, Description. Glucosinolates in Rapeseeds: Analytical Aspects. Dordrecht: Martinus Nijhoff., 13, pp. 125150.
Bjerg N., Eggum B. O., Jacobsen I., Otte J., Sørensen H., 1989. Antinutritional and toxic effects in rats of individual glucosinolates (±myrosinases) added to a standard diet (2). Zeischr Thierphysiol, Tierernährung u Futtermittel-kd 61: 227-244.
Bjergegaard C. Li P.W., Michaelsen S., Møller P., Otte J. and Sørensen H., 1994. Glucosinolates and their transformation products – compounds with a broad biological activity. In: Bioactive
substances in Food of Plant Origin, Proceedings of the International Euro Food Tox IV Conference, Olsztyn, Poland. Kozlowska, H., Fornal, J and Zdunczyk, Z. Eds.1, 1-15.
Bjergegaard C., Mortensen K., Petersen I.L., Sørensen H. and Sørensen J.C., 2003. Isolation and characterization of myrosinase isoenzymes occurring in
Brassica napus L. and Sinapis alba L. In: Proceedings of the 11th International
Rapeseed Congress, Copenhagen, Denmark. pp. 712-715.
Bonnesen C., Stephensen P. U., Andersen O., Sørensen H., Vang O., 1999. Modulation of cythochrome P-450 and glutathione S -transferase isoform expression in vivo by intact and degraded indolyl glucosinolates. Nutr. Cancer 33 (2): 927-935.
Bradshaw J. E., Heaney R. K., Macfarlane Smith W. H., Gowers S., Gemmell D. J., Fenwick G. R., 1984. The glucosinolate content of some fodder Brassicas. Journal of the Science of Food and Agriculture 35, 977-981.
Brown P. D., Morra M. J., 1997. Control of soil-borne plant pests using glucosinolate-containing plants. Advances in Agronomy 61, 167-231.
Buskov S., Hasselstrøm J., Olsen C.E., Sørensen H., Sørensen J.C. and Sørensen S., 2000a. Supercritical fluid
chromatography as method of analysis for determination of
4-hydroxybenzylglucosinolate degradation products. Journal of Biochemical and Biophysical Methods 43, 281-298. Buskov S., Hansen L.B., Olsen C.E.,
Sørensen H., Sørensen J.C. and Sørensen S., 2000b. Determination of ascorbigens in autolysates of various Brassica species using supercritical fluid chromatography. Journal of Agricultural and Food Chemistry 48, 2693-2701. Buskov S., Olsen C.E., Sørensen H. and
Sørensen S., 2000c. Supercritical fluid chromatography as basis for identification and quantificative determination of indol-3-ylmethyloligomers and ascorbigens. Journal of Biochemical and Biophysical Methods 43, 307-327.
Buskov S., Serra B., Rosa E., Sorensen H., Sorensen J. C., 2002. Effects of intact glucosinolates and products produced from glucosinolates in myrosinase-catalyzed hydrolysis on the potato cyst nematode (Globodera rostochiensis Cv. Woll). Journal of Agricultural and Food Chemistry 50, 690-695. Chan M. K. Y., Close R. C., 1987.
Aphanomyces root rot of peas. 3. Control by the use of cruciferous amendments. New Zealand Journal of Agricultural Research 30, 225-233.
Clossais-Besnard N., Larher F., 1991. Physiological role of glucosinolates in
Brassica napus. Concentration and distribution pattern of glucosinolates among plant organs during a complete life cycle.Journal of the Science of Food and Agriculture 56, 25-38.
Fahey 0. J. W., Zalcmann A. T., Talalay P., 2001. The chemical diversity and distribution of glucosinolates and isothiocyanates among plants.
Phytochemistry 56 (1),5-51. Ettlinger M. G., Kjær A., 1968. Sulphur
compounds in plants. In: Mabry, T. J. (Ed.) Recent advances in Phytochemistry. North –Holland Publishing Company, Amsterdam. pp. 59-144.
Fieldsend J., Milford G. F. J., 1994. Changes in glucosinolates during crop development in single- and double-low genotypes of winter oilseed rape (Brassica napus): I. Production and distribution in vegetative tissues and developing pods during development and potential role in the recycling of sulphur within the crop. Annals of Applied Biology 124, 531-542. Gardiner J. B., Morra M. J., Eberlein C. V.,
Brown P. D., Borek V., 1999.
Allelochemicals released in soil following incorporation of rapessed (Brassica napus) green manures. Journal of Agricultural and Food Chemistry 47, 3837-3842.
Hansen M., Laustsen A. M., Olsen C. E., Poll L., Sørensen H., 1997. Chemical and sensory quality of broccoli (B. oleracea L. var. italica). Journal of Food Quality 20, 441-459.
Hill J., Lethenborg P., Li P. W., Rahman M. H., Sørensen H., Sørensen J. C., 2003. Inheritance of progoitrin and total aliphatic glucosinolates in oilseed rape (B. napus L). Euphytica 134, 179-187. Kirkegaard J. A., Sarwar M., 1998.
Biofumigation potential of brassicas. I. Variation in glucosinolate profiles of diverse field-grown brassicas. Plant and Soil201, 71-89.
Kjær A., 1960. Naturally derived
isothiocyanates (mustards oils) and their parent glucosinolates. In: Hetz W., Grisenbach H., Kirby G. W. (Eds.). Progress in the chemistry of organic natural products. Springer-Verlag, Berlin, New York. pp. 122-176.
Manici L. C., Lazzeri L., Baruzzi G., Leoni O., Galletti S. and Palmieri S., 2000. Suppressive activity of some glucosinolates enzyme degradation products on Pythium irregulare and
Rhizoctonia solani in sterile soil. Pest Management Science 56, 921-926. Matthiessen, J. N., Warton, B., Shackleton,
M. A., 2004. The importance of plant maceration and water addition in achieving high Brassica-derived ITC levels in soil. In Proceedings of the First International Symposium on
Biofumigation. Florence, Italy. pp. 12. Michaelsen S., Møller P., Sørensen H.,
1992. Factors influencing the separation and quantification of intact
glucosinolates and desulphoglucosinolates by Micellar eletrokinetic capillary chromatography. Journal of Chromatography 608, 363-374. Mnzava N. A., Olson K., 1989. Studies on
tropical vegetables. Part 1: Seed amino, fatty acid and glucosinolate profile of ethiopian mustards (Brassica carinata
Braun). Food Chemistry 35, 229-235. Palmieri S., Rollin P. Sørensen H. and
Petersen I.L., Sørensen H, Sørensen J.C. and Sørensen H., 2003. Kinetic parameters of myrosinase isoenzymes from Brassica napus L. and Sinapis alba L seeds. In: Proceedings of the 11th International
Rapeseed Congress, Copenhagen, Denmark, pp. 716-719.
Rangkadilok N., Nicolas M. E., Bennett R. N., Premier R. R., Eagling D. R., Taylor P. W. J., 2002. Developmental changes of sinigrin and glucoraphanin in three
Brassica species (Brassica nigra, Brassica juncea and Brassica oleracea var. italica). Scientia Horticulturae 96, 11-26. Rodman J. E., 1978. Glucosinolates,
Methods of Analysis and some chemosystematic problems.
Phytochemistry Bulletin, Phytochemistry Sec. 11 (1-2), 6-31.
Rosa E. A. S., Rodrigues P. M. F., 1999. Towards a more sustainable agriculture
system: The effect of glucosinolates on the control of soil-borne diseases. Journal of Horticultural Science & Biotechnology 74, (6) 667-674.
Sang J. P., Minchinton I. R., Johnstone P. K., Truscott R. J. W., 1984. Glucosinolate profiles in the seed, root and leaf tissue of cabbage, mustard, rapeseed, radish and swede. Canadian Journal of Plant Science 64, 77-93.
Sarwar M., Kirkegaard J. A., 1998. Biofumigation potential of Brassicas. II. Effect of environment and ontogeny of glucosinolate production and implications for screening. Plant and Soil 201, 91-101. Snowdon, R., Köhler, W., Friedrich, T.,
Friedt, W., 2003. Fishing for physical genome information – Brassica
cytogenetics past, present and future. In: Proceedings of the 11th International
Rapeseed Congress, Copenhagen,
Denmark. pp. 116-119.
Sørensen H., 1990. Glucosinolates: Structure – Properties – Function. In: Shahidy, F. (ed). Canola and Rapeseed. Production, Chemistry, Nutrition and Processing Technology. Van Nostrand Reinhold Publishers, New York, pp. 149-172. Sørensen H., Sørensen S., Bjergegaard, C.,
Michaelsen, S., 1999. Chromatography and capillary electrophoresis in food analysis. Royal Chemical Society, Cambridge, UK.
Sørensen J. C., 2001. Biorefined oilseed products – high quality products with added value. PhD Thesis. Chemistry Department, KVL, Denmark. U N., 1935. Genomic analysis in Brassica