O
RGANIC
F
ARM
I
NCOMES
IN
E
NGLAND AND
W
ALES
1995/96 - 1997/98
Susan Fowler, Nicolas Lampkin,
and Peter Midmore
July 2000
SEFYDLIAD ASTUDIAETHAU GWLEDIG CYMRU
O
RGANIC
F
ARM
I
NCOMES
IN
E
NGLAND AND
W
ALES
1995/96 - 1997/98
Report of work for the
Ministry of Agriculture, Fisheries and Food
Contract ref.: OF 0190
Susan Fowler Nicolas Lampkin
Peter Midmore
Organic Farming Research Unit Institute of Rural Studies
University of Wales Aberystwyth
Contents
Page
Table of Tables iii
Table of Figures iv
Executive Summary v
1. Introduction 1
2. Methods 2
Organic farm data sources and collection methods 2
Farm comparisons 5
3. Presentation of results 9
Whole farm data 9
Income measures 10
4. Results highlights 11
5. Cropping farms 14
6. Horticultural holdings 18
7. Dairy farms 22
8. Dairy farms (in conversion) 26
9. Cattle and sheep farms 30
Lowland cattle and sheep 30
LFA cattle and sheep 33
10. Mixed farms 34
11. Gross margins 37
Dairy 38
Beef 40
Sheep 42
Crops 44
12. Appendices 47
Appendix 1 Detailed farm results 47
Appendix 2 The Farm Classification System 88
Appendix 3 Comparing farming systems 89
Acknowledgements
Our grateful thanks go to the following who contributed to this report:
Nigel Chapman, Tim Jenkins and the staff of WIRS Farm Business Survey unit for their assistance and guidance
John Burrows, Iwan Wynne-Jones, Susanne Padel (WIRS) Lynne Stretton (Askham Bryan FBS)
Angela D Taylor (Exeter FBS) Rod Vaughan (Reading FBS) Data collection:
Alun Davies, Heather McCalman, Dan Powell (WIRS) John Elliott and colleagues (ADAS Consulting Limited) Chris Firth (Henry Doubleday Research Association, HDRA) Ken Stebbings (ADAS Wales)
And most especially to all the farmers who gave of their time and information, without which this work would not be possible.
Although all efforts are made to ensure the quality of the conventional farm data, the copyright holder, the original data producer, the Ministry of Agriculture, Fisheries and Food, and the Data Archive bear no responsibility for the accuracy or
comprehensiveness of these materials, or for their further analysis or interpretation.
Table of Tables
Table 1 Distribution of organic and converting farms by type and source of data 4 Table 2 Distribution of organic and converting farms, by type and size (ESU) 4
Box 1 Conventional farm selection procedure 7
Table 3 Organic farms data summary (£/ha), 1997/98 11 Table 4 Summary data for cereal and general cropping farms (£/ha),
1995/96 – 1997/98 14
Table 5 Summary data for horticultural holdings (£/ha), 1995/96 – 1997/98 18 Table 6 Summary data for dairy farms (£/ha), 1995/96 – 1997/98 22 Table 7 Summary data for conventional dairy farms and dairy farms converting
to organic (£/ha), 1995/96 – 1997/98 26
Table 8 Summary data for lowland cattle and sheep farms (£/ha),
1995/96 – 1997/98 30
Table 9 Summary data for mixed farms (£/ha), 1995/96 – 1997/98 34 Table 10 Organic dairy gross margins (£/cow), 1995/96 - 1997/98 38 Table 11 Dairy gross margins for enterprises converting to organic production
(£/cow), 1995/96 - 1997/98 39
Table 12 Suckler cows gross margins (£/cow), 1995/96 - 1997/98 40 Table 13 Finishing beef gross margins (£ per head), 1995/96 – 1997/98 41 Table 14 Lowland farms, breeding sheep gross margins (£/ewe), 1995/96 –
1997/98 42 Table 15 Upland farms, breeding sheep gross margins (£/ewe), 1995/96 – 1997/98 43
Table 16 Gross margins for winter wheat (£/ha), 1995/96 – 1997/98 44 Table 17 Gross margins for spring wheat (£/ha), 1995/96 – 1997/98 44 Table 18 Gross margins for winter oats (£/ha), 1995/96 45 Table 19 Gross margins for spring oats (£/ha), 1995/96 – 1996/97 45 Table 20 Gross margins for spelt wheat (£/ha), 1995/96 45 Table 21 Gross margins for spring barley (£/ha), 1996/97 46 Table 22 Gross margins for potatoes (£/ha), 1996/97 46 Appendix 1
Table 1A Results of cropping farms 48
Table 2A Results of horticultural holdings 54
Table 3A Results of dairy farms 60
Table 4A Results of converting dairy farms 66
Table 5A Results of lowland cattle and sheep farms 72
Table 6A Results of LFA cattle and sheep farms 79
Table of Figures
Figure 1 Framework for selection variables for comparisons of conventional
with organic farms. 5
Figure 2 Average NFI (£/ha) for conventional and organic farms of six types,
1995/96 - 1997/98 13
Figure 3 Output, inputs and NFI for predominantly cereal and general
cropping farms (£/ha and £/farm), 1995/96 – 1997/98 15 Figure 4 Output categories on conventional and organic cereal and general
cropping farms (£/ha), 1995/96-1997/98 15
Figure 5 Input categories on conventional and organic cereal and general
cropping farms (£/ha), 1995/96-1997/98 16
Figure 6 Outputs, inputs and NFI for horticultural holdings (£/ha and £/farm),
1995/96 - 1997/98 19
Figure 7 Output categories on conventional and organic horticultural
holdings, (£/ha), 1995/96 - 1997/98 20
Figure 8 Input categories on conventional and organic horticultural holdings
(£/ha), 1995/96 - 1997/98 20
Figure 9 Outputs, inputs and NFI on dairy farms (£/ha and £/farm),
1995/96 - 1997/98 23
Figure 10 Output categories on conventional and organic dairy farms (£/ha),
1995/96 - 1997/98 24
Figure 11 Input categories on conventional and organic dairy farms (£/ha),
1995/96 - 1997/98 24
Figure 12 Outputs, inputs and NFI on conventional and converting dairy farms,
(£/ha and £/farm), 1995/96 - 1997/98 27
Figure 13 Output categories on conventional and converting dairy farms
(£/ha), 1995/96 - 1997/98 28
Figure 14 Input categories on conventional and converting dairy farms (£/ha),
1995/96 - 1997/98 28
Figure 15 Outputs, inputs and NFI on lowland cattle and sheep farms (£/ha and
£/farm), 1995/96 - 1997/98 31
Figure 16 Output categories on conventional and organic lowland cattle and
sheep farms (£/ha), 1995/96 - 1997/98 32
Figure 17 Input categories on conventional and organic lowland cattle and
sheep farms (£/ha), 1995/96 - 1997/98 32
Figure 18 Outputs, inputs and NFI for mixed farms (£/ha and £/farm),
1995/96 – 1997/98 35
Figure 19 Output categories on conventional and organic mixed farms (£/ha),
1995/96 - 1997/98 35
Figure 20 Input categories on conventional and organic mixed farms (£/ha),
Executive
Summary
This report presents results from research work carried out for the Ministry of Agriculture, Fisheries and Food (MAFF) on the financial performance of organic farms over the years 1995/96 to 1997/98. The aim of the research was to assess the financial performance of organic farms differentiated by farm type, in order to inform MAFF policy-making with respect to organic farming, and to provide a basis for assessments by farmers, advisers and other interested parties of the farm-level implications of conversion to, and continued organic farming.
The specific objectives were the provision of information on different organic farm types. This was achieved through the collation of financial data collected under three different MAFF-funded research projects supplemented by data collected on other farm types, including data on dairy farms in the process of converting to organic production. Organic farm data is presented for LFA cattle and sheep farms for 1997/98 only. The samples of organic farms are small because of the limited number of organic holdings over 8 European Size Units with identifiable holding numbers in 1996 and farms with more than 50% of their land under organic management in 1997/98.
Although the organic sample is small, it represents nearly 14% of organic farms with identifiable holding numbers registered with UKROFS in 1996, and this work gives an indication of the relative profitability of different organic and conventional farms of different types in the late 1990s.
Detailed financial input, output, income, liabilities and assets and some physical performance measures are presented for each of the years studied.
Outputs on organic dairy, horticulture and mixed farms increased each year. Outputs on organic lowland cattle and sheep farms were stable, but increasing inputs reduced Net Farm Income (NFI) each year in the study period. Outputs from organic cropping farms increased in 1996/97 and decreased in 1997/98, but results from this group are affected by the high levels of conventional cropping (25% of land area on average) and reduced conventional prices.
To provide an indication of the likely performance of the organic farms if they were under conventional production, data from conventional farms are given. Conventional farms were selected by cluster analysis from the Farm Business Survey (FBS) (MAFF, 1999) 1.
In 1997/98 the average NFI (£/farm) of the organic farms exceeded that of the conventional farms for all farm types except cattle and sheep farms.
1 Ministry of Agriculture, Fisheries and Food Economic (Farm Business) Division, Welsh Office, Farm Business
1. Introduction
This report presents results from research work carried out for the Ministry of Agriculture, Fisheries and Food (MAFF) on the financial performance of organic farms over the years 1995/96 to 1997/98.
The aim of the research reported here was to assess the financial performance of organic farms, differentiated by farm type, in order to:
• inform MAFF policy-making with respect to organic farming, arable and livestock commodity support programmes and agri-environmental policy, and
• provide a basis for assessments by farmers, advisers and other interested parties of the farm-level implications of conversion to and continued organic farming.
The specific contract objectives included the collation of financial data collected under three different MAFF-funded research projects from 1995/96 to 1997/98. These projects covered: organic dairy (IGER, Trawsgoed), hill livestock (ADAS, Redesdale) and arable (ADAS, Terrington) farms. Additionally, financial data were collected on 19 organic farms of types selected to complement the farms above (lowland cattle and sheep, mixed, and horticultural holdings) (see Table 1).
Data from appropriate conventional farms from the Farm Business Survey (FBS) (MAFF, 1999) 2 were selected to provide comparisons with the organic farm data.
2 Ministry of Agriculture, Fisheries and Food Economic (Farm Business) Division, Welsh Office, Farm Business
2. Methods
Organic farm data sources and collection methods
The following tables present results from organic farm businesses in England and Wales with account years ending between July and the following April; all (except four) falling between December to April. In three cases artificial year-ends were used to avoid year-ends occurring during the growing season.
The data were gathered using a variety of methods, depending on the source (see below), but processed according to standardised Farm Business Survey guidelines set down by the Ministry of Agriculture, Fisheries & Food, Economics (Farm Business) Division (Farm Business Survey, February 1996). Some farms recruited for specific conversion studies (the pre-cursors to ADAS and IGER studies detailed below), were, due to their enterprise mix, categorised differently from their original study group (see Table 1), so that a farm recruited for the Hill Livestock Production study was classified as a mixed farm according to the FBS farm classification system (see Appendix 2). In a few cases, where it was not possible to standardise whole farm figures, only gross margin information for specific enterprises has been used. Where farms dropped out of the survey in later years, only their gross margin data have been included in the report, so that the tables of whole farm data are from identical samples.
Four different MAFF-funded projects contributed data to this report (see Table 1): 1. Organic Hill Livestock Production (ADAS Redesdale)
This project aims to evaluate the effects of converting to and continued management of a hill/upland livestock system to organic farming. To help interpret the physical and financial performance of the organic unit at Redesdale, a network of linked farms was established to support the main research project. The gross margin and farm income data for 1997/98 from six linked farms were supplied by ADAS to WIRS for the compilation of the following tables. All were costed using the ADAS Business Recording Service. Gross margin costings only were supplied for a further three farms, and for the three systems being operated by ADAS at Redesdale.
Not all the commercial farms studied in the Redesdale project were classified as cattle and sheep farms, so their data are presented with other farm types. Further, results from some linked farms were not available for all three years; this meant that an identical sample of organic LFA cattle and sheep farms over the three years would consist of two farms only. For this reason only data for five farms for 1997/98 are presented for upland cattle and sheep (Appendix 1 Table 6A).
2. Organic Arable Farming (ADAS Terrington)
A similar network of linked farms was associated with this project, which aimed to evaluate the effects of converting and the continued organic management of specialist arable farms. Gross margins and farm income data from seven linked predominantly cropping farms were provided by ADAS to WIRS for this study. Of these, two farms have been categorised with the mixed farms in this report, although whole-farm data from one of the farms have been omitted from this report because the conventional sample of farms for comparison became too small in the third year.
included in the whole farm results due to the small proportion of land area in conversion and in organic production.
3. Organic Milk Production (IGER, WIRS, ADAS)
A MAFF funded project to study the conversion of Ty Gwyn dairy unit to organic milk production also used the linked farms approach. Seven of these farms, now in full organic production, were used to provide data for the report (see Table 1). The data were collected by WIRS from five of these using the Integrated Accounts System used by Farm Business Survey Centres. Data from two other farms were collected by ADAS using the ADAS Business Recording Service. Only gross margin data from the Ty Gwyn farm are included. One of the farms is categorised as a cattle and sheep farm, and a further dairy farm is categorised as a mixed farm, leaving five in the predominantly dairy section.
Five further dairy farms in the process of converting to organic dairy farming were studied by WIRS using the Integrated Accounts System (IAS), and are presented as Dairy – in
conversion. The first year’s data are from the year spanning the end of conventional
management; for four of the farms this was 1995/96. In 1996/97 three of the five farms had all their land in conversion, the other two farms were undergoing a staged conversion over a longer period.
4. Economics of organic farming (WIRS)
Data on 19 additional commercial organic farms in England and Wales were collected under this project to complement the farm types under consideration in the above studies. The main types selected were mixed, cropping, horticulture and lowland cattle and sheep. Farms were randomly selected within robust farm type categories from 1996 UK Register of Organic Food Standards (UKROFS) registered holdings with identifiable holding numbers over 8 European Size Units (ESU) (for definition, see Appendix 2). Of about 800 UKROFS registered holdings at the beginning of 1996, 640 had identifiable numbers of which only 445 were usable,
primarily due to significant numbers of duplicates. Of the 445 usable numbers, 147 were for holdings of less than 8 ESU, leaving a group of 298 from which farms could be selected. Farms with less than 50% of land with organic status were excluded. The data were collected by WIRS using the Aberystwyth Farm Business Survey (FBS) Automated Accounts System (See Table 1). Horticultural data were collected by HDRA on sub-contract from WIRS, using the IAS approach.
The Welsh Institute of Rural Studies (WIRS) at the University of Wales, Aberystwyth was responsible for collating the data from the different sources.
Due to the constraints of confidentiality guaranteed to farmers participating in these surveys, no data are presented for groups of less than five farms. At the time of recruiting for this work, there were too few organic farms in particular categories from which to sample (i.e. farm types ‘pigs and poultry’ and ‘other’ (Tables 1 and 2), and it was difficult recruiting sufficient participants for other types (particularly horticultural holdings). Samples are small, therefore, and this affects the extent to which results may be extrapolated to the wider
population of organic farms. A further complicating factor is that the economic climate for farming generally has changed dramatically since the start of this survey, and the
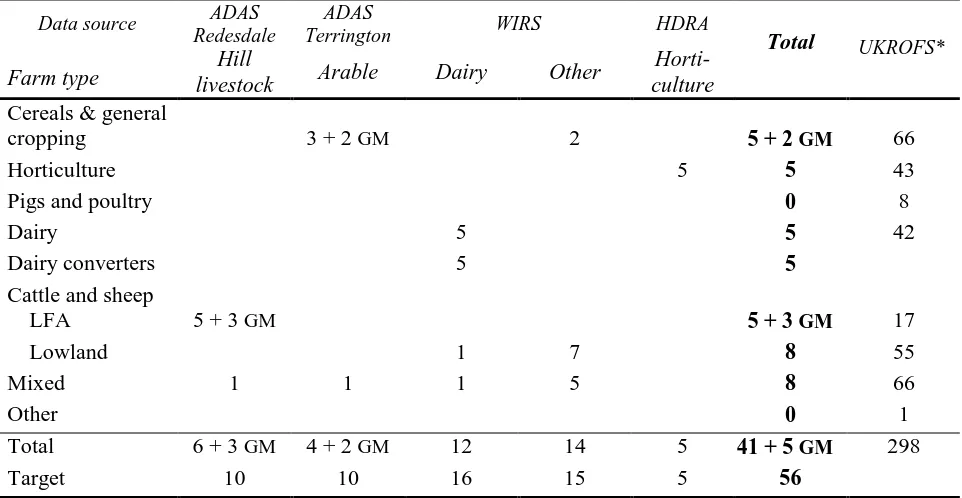
Table 1 Distribution of organic and converting farms by type and source of data
Data source ADAS
Redesdale
ADAS
Terrington WIRS HDRA
Farm type livestock Hill Arable Dairy Other culture
Horti-Total UKROFS*
Cereals & general
cropping 3 + 2 GM 2 5 + 2 GM 66
Horticulture 5 5 43
Pigs and poultry 0 8
Dairy 5 5 42
Dairy converters 5 5
Cattle and sheep
LFA 5 + 3 GM 5 + 3 GM 17
Lowland 1 7 8 55
Mixed 1 1 1 5 8 66
Other 0 1
Total 6 + 3 GM 4 + 2 GM 12 14 5 41 + 5 GM 298 Target 10 10 16 15 5 56
GM – Gross margin data only
*UKROFS 1996 certified holdings >8 ESU with identifiable holding numbers.
The shortfall in the target is due in part to the exclusion of farms where three years data were not available.
Table 2 Distribution of organic and converting farms, by type and size (ESU)
Farm type <8 8 -
<15 15-<28 28 – <40 40 - <60 60 - <100 100 - <200
200 + Total
Cereals & general cropping
1 1 2 1 5
Horticulture 4 1 5
Pigs and poultry 0
Dairy 3 1 1 5
Dairy Converters 1 2 1 1 5
Cattle and sheep
LFA 2 1 2 5
Lowland 4 1 1 1 1 8
Mixed 1 1 1 2 1 2 8
Other 0
Total 1 11 4 3 8 4 4 6 41
UKROFS * 155 74 35 34 298
Proportion of UKROFS list in study.
12.3% 16.2% 11.4% 17.6% 13.8%
Farm comparisons
In order to provide an insight into the relative performance of organic farms, a comparison with similar conventional farms has been provided. The underlying purpose is to deduce what profit the farm would make if it were managed conventionally3.
Background
[image:15.595.90.503.302.578.2]There are many methodological possibilities for comparing organic and conventional farms, ranging from individual comparisons with farms before conversion (in Figure 1, this is shown as comparing the organic farm at a point in time tx with its conventional situation at a point in time t0) to comparisons with hypothetical figures or using models. The former approach requires a period of years to follow a converting farm, and requires a paired farm to provide a reflection of the effects of externalities, such as climate and policy environment, which will affect results independent of the conversion. The latter approach depends greatly on the assumptions made.
Figure 1 Framework for selection variables for comparisons of conventional with organic farms. FRAMEWORK conv. farm conv. farm conv. farm conv. farm conv. farm org. farm org. farm regional / natural site var. farm type farm size Selection var.? regional /
natural site var. farm type farm size livestock numbers labour density production structure production costs yields profit borrowed capital Selection var.?
t0 t1 tx
Social environ m ent Tech nolog ical envir onm ent Political environment Economic environment Institutional environment conv. farm
Source: Offermann and Nieberg, (2000)3
An alternative method is to use the income of conventional farms in the year of observation as an indicator of the hypothetical ‘conventional’ income of the observed organic farm. The conventional farms selected need to be ‘comparable’. The objective is to isolate the effect of the farming system on profits, so the choice of characteristics for comparison must be
restricted to ‘non-system determined’ factors, i.e. location (climate, topography, soil, market distance), size and tenure. The use of clusters of similar conventional farms to compare with each organic farm has the advantage over paired farm comparisons in that specific
circumstances of individual conventional farms do not distort the comparison. The average
3
for a group of organic farms can then be compared with the average for the group of matched clusters with greater confidence that the farm size, type and location characteristics of the organic and conventional groups are similar.
For a fuller discussion on the complexities of comparing farming systems, see Appendix 3. Conventional farm selection
For each organic farm recorded, the aim was to generate a cluster of between 10 and 12 similar conventional farms from the Farm Business Survey database for the three years (MAFF, 1999)4. The emphasis for selection of comparison conventional farms for this study was to focus on variables reflecting the resource endowment rather than the management system of the farm. The first stage selection was made on their approximate location (the same Farm
Business Survey province) and enterprises (the same EU farming type). A hierarchical
clustering approach was then used to pick out farms with similar key characteristics selected to reflect the resource endowment of the holdings. The resource endowment of the holding is normally independent of the organic or conventional management of the holding, and is a reflection of the resources with which the farm manager can run the farm business (see Box 1). The mechanics of cluster analysis are described in the Statistical Package for the Social
Sciences manual (SPSS, 1990)5. Hierarchical cluster analysis consecutively clusters individuals and groups together on the basis of the minimum Euclidean squared difference between the key characteristics that distinguish each case, or group of previously clustered cases.
In most cases, the initial selection of farming type was one EU type selected from around 80 particular types (1985 EC Typology described in Commission Decision 85/377/EEC). In nine of the 41 farms detailed in this report, other, very similar, types had to be included to provide a satisfactory base for the selection procedure; this occurred for each of the horticultural
holdings, three of the mixed farms and one cattle and sheep farm. In most cases, it was possible to generate the cluster from farms in the same region. In some cases, however, the organic farms were so dissimilar that farms from the same region entered clusters too late in the hierarchical process, and the comparison provided was not satisfactory. In such cases the selection group was widened, by adding in farms of the same type from adjacent regions. In the current study, it proved impossible, even then, to select a group of 12 comparable farms in a small minority of cases, and for these the respective cluster is smaller in number. In some cases the clustering procedures resulted in many more farms being selected (up to 27).
4 Ministry of Agriculture, Fisheries and Food Economic (Farm Business) Division, Welsh Office, Farm Business Survey, 1997-1998 [computer file]. Colchester, Essex: The Data Archive [distributor] 21 July 1999. SN: 4002.
Box 1 Conventional farm selection procedure
* Farm business size, as measured by standard gross margins, is a measure of the potential economic activity of the particular mix and size of enterprises on the farm.
The clustering process was carried out with the farms from which data was collected in 1995/96. Each following year a proportion of the conventional farms were dropped, which resulted in an overall loss of 17% of conventional farms, but for individual clusters the loss ranged from 0% to 56%. Results for earlier years for were re-calculated to remove farms not present in the later years thus providing an identical sample. In one case, by the third year the cluster became too small (two farms only), therefore the organic farm was also removed from the results. Only two of the organic LFA cattle and sheep farms were in the survey all three
Initial selection:
Organic Farm A All FBS farms
Type A (EU particular type) Region B (FBS Region)
Select farms of Type A in Region B
Are there sufficient farms for cluster analysis?
Yes No Incorporate broader farm Types Are there sufficient farms for cluster analysis?
Yes No Return to particular type and include broader regions Are there sufficient farms for cluster analysis?
Yes No Include more types in Region B Are there sufficient farms for cluster analysis?
Yes No Include more regions
Are there sufficient farms for cluster analysis? Yes Multivariate analysis (cluster analysis) by key characteristics.
Land area (effective hectares of utilisable agricultural area) Proportion of rented land
Volume of milk quota
years, so the original cluster of conventional farms selected was no longer appropriate for the 1997/98 data results and are not presented.
Interpretation of results
It should be noted that the farms have been classified by Standard Gross Margins (SGMs), a typology system originally devised for conventional agricultural systems and therefore not entirely appropriate for these organic farms (see Appendix 2). Further, because of the
systematic differences in structure on organic farms, clustering conventional farms is still only an approximate guide to the possible performance of organic farms if they were managed conventionally.
The data source for the cluster farm comparisons is sufficiently large for a degree of confidence in the average; however, the organic farm sample is so small that outliers
3.
Presentation of results
Whole farm data
Results for each type of organic farm have been averaged, and are presented with the average of the groups of selected cluster farms. This methodology has been adopted so that particular characteristics of each organic farm could be represented in the process, rather than drawing a single cluster for the average results of each organic farm type.
Table 3 gives an overview of the performance of organic farms in 1997/98 in £ per effective hectare of Utilisable Agricultural Area (UAA). Within sections on each farm type, figures show the development of average outputs, inputs and NFI for whole farms and £/ha for both farming approaches over the three years. Further figures and tables within each section on the different farm types give summaries of outputs and inputs, divided into categories, for both farming approaches over the three years; these include an allowance for farmer and spouse labour, thus differing from the NFI charts that do not.
Throughout the text, the terms input and output are used to define financial values rather than physical quantities (for further definitions of terms please see Appendix 4, page 91).
Within Appendix 1, Tables 1A to 7A give details of outputs, inputs, incomes, some
performance measures, and asset and liability information for six farm types. Where physical information was available in addition to the financial data collected, livestock units per forage hectare, and labour units per farm, are presented. In some cases, if direct data were not
available for one or two farms in the group, labour units for the other farms have been derived from wages paid using standard agricultural wages. All labour-use figures presented are, however, very approximate.
Tables provide whole farm totals averaged for each farm type, and weighted averages per hectare of UAA over the farms or holdings. Values per hectare of total UAA are used (rather than measures per hectare in specific enterprises) because presenting the whole farm situation reflects the interdependence of enterprises. The fact that, for instance, organic horticultural holdings cannot crop their entire land in one year has a considerable influence on the overall farm profitability.
Farm classification
Organic farms were classified by constituent EC type (1985 EC Typology described in Commission Decision 85/377/EEC as amended with minor modifications, MAFF, (1998))6. They are presented in Robust types according to the UK farm classification system (Revised 1994), (MAFF, 1997)7. Robust types 1 (Cereals) and 2 (General Cropping) are merged to present enough farms in each table to maintain confidentiality. (See Appendix 2 for more information.) The use of constituent EC types relies on the use of standard gross margins (SGMs) from which European Size Units (ESUs) are derived (which in turn allow
classification into EC types). These SGMs do not specifically relate to organic enterprises, so that they are not entirely appropriate for organic farms but their use offers a basis for
comparing like with like where comparisons are required. Classification of farms by size and
6 Farm Incomes in the United Kingdom 1996/97. (1998). MAFF, London: TSO.
type is inevitably a broad-brush exercise, but where sample sizes are small and farming systems diverse, some form of categorisation is essential to elucidate trends and patterns.
Income measures
Management and Investment Income (MII) represents a return to management, whether paid or not, and tenant type capital invested in the farm, whether borrowed or not. Thus, as well as the usual variable and fixed costs, it includes a nominal charge for farmer and spouse physical labour, but not management time, and a charge for depreciation of machinery (but not the actual costs of machinery purchased in that period). Interest payments are not included. Net Farm Income (NFI) represents the return to farmer and spouse for their manual and managerial labour and on the tenant type capital invested in the farm. NFI can be derived from MII by deducting the cost of paid management, and adding back the notional charge for farmer and spouse labour.
In the presentation of the MII and NFI results, a number of adjustments are made to make farms comparable with each other as far as resource endowment is concerned:
• Land and property: all farms are treated as tenanted - a rental value is imputed as an expense for owner-occupied land. The costs of permanent improvements to farms, together with any capital grants relating to such work, are therefore excluded from these income calculations, although such landlord-type improvements are reflected in higher rent or rental value charges.
• Capital: all farms are treated as if they have no borrowings - debt service charges incurred by farmers on farm borrowing or the leasing of equipment, were ignored for the purposes of calculating NFI and MII.
• Labour: all farms are treated as if all labour is paid – including other unpaid labour and, for MII, notional values for farmer and spouse manual labour.
Occupiers Net Income (ONI) and Cash Income definitions exclude these notional charges and reflect actual land, property and capital costs. The measure closest to the normal definition of profit is that of ONI, as it excludes nominal charges for unpaid labour of farmer and spouse as well as any nominal rents charged, but includes interest charges and depreciation of buildings and works. ONI and Cash Income more closely represent the actual situations on farms, but comparisons with other farms are less reliable because of differences in land tenure, reliance on unpaid labour, and owner equity.
4. Results
highlights
The results presented here cover three years. In each year, specific external factors have influenced the results and need to be borne in mind. These include drought conditions in the first year which had severe impacts on farms in some areas and on some soils, the BSE crisis beginning in March 1996 and the beginnings of a general downward pressure on farm-gate prices and support payments due to the increased value of the pound and other factors in 1997. The results for the organic farms also reflect the significant improvements in the marketing conditions for organic products in 1997/98.
The organic farms studied include farms from the initial stages of conversion through to long-established organic farms, ranging, for example, from dairy converters who had no land with full organic status in the first year of the study, to completely organic dairy farms. The farms in the ADAS Terrington trial were the organic farms with the highest proportion of land not in conversion; in 1997/98 the cropping farms presented in Section 5 ranged from 59% of land organic to 100% of land organic, averaging at 78%.
Table 3 gives a summary breakdown of outputs and inputs as calculated for MII, and three other income measures (NFI, ONI and Cash Income). Tables 4 – 9 give the same data for both farming approaches over three years for six farm types. From these tables the
proportions of variable and fixed inputs can be calculated. Except for the dairy farms (at 32% and 33%), variable costs were only 21-23% of all inputs. Labour costs (including an
allowance for farmer and spouse labour) were between 20 and 30% of all inputs except on horticultural holdings where labour accounted for 58% of total inputs. Machinery costs on horticultural holdings were particularly low, at 9% of total inputs, contrasted with 27% on cropping and LFA cattle and sheep farms, 24% on mixed, and 20% of inputs on dairy and lowland cattle and sheep farms. On average across the farm types, general costs were 9% of all inputs, ranging from 7% on mixed farms, to 14% on LFA cattle and sheep farms.
Table 3 Organic farms data summary (£/ha), 1997/98
Horti- Dairy Cattle & sheep
Cropping culture Organic Convert. Lowland LFA Mixed
Livestock outputs 41 140 1,670 678 590 278 374 Livestock subsidies 23 25 2 25 84 215 66 Cropping and by-products 361 4,672 105 215 154 42 394 Crop subsidies 177 14 23 121 64 20 113 Other outputs 47 121 119 49 61 88 32
TOTAL OUTPUTS 664 4,972 1,918 1,088 953 642 979
Livestock 26 121 407 209 186 140 94 Crop 77 953 34 103 46 35 85 Labour 110 3,185 334 214 329 173 241 Machinery 146 505 273 192 203 218 196 General 61 428 134 75 121 113 53 Land costs 144 261 203 163 210 125 145
TOTAL INPUTS 565 5,452 1,385 956 1,094 804 814
Add paid management input 22 0 4 0 35 0 5
Management & Investment Income
122 -481 537 132 -107 -162 171
Table 3 also illustrates the high dependence on subsidies of LFA cattle and sheep farms, with 33% of their output derived from livestock subsidies. The organic dairy farms and
horticultural holdings had the lowest direct subsidies, making up only 1% of their outputs. The difference in cropping outputs of the converting dairy farms compared with the organic dairy farms is largely because of the presence, within the converting group, of a farm with a large (conventional) arable area (classified as a ‘cropping and dairy’ farm).
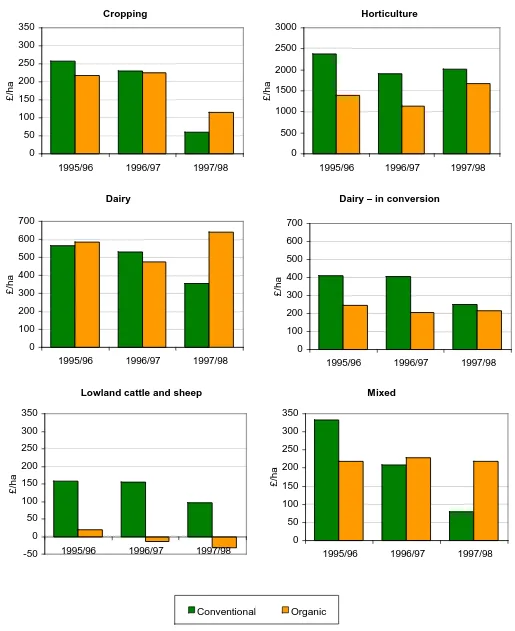
Figure 2 shows average NFI in £/ha of UAA for organic and conventional cluster farms over three years. Conventional dairy, and lowland cattle and sheep farms showed similar incomes for 1995/96 and 1996/97, and a 37% drop in income in 1997/98, whereas for cropping and mixed conventional farms there was an evident decline in incomes in 1996/97 that continued the following year. Of conventional farms, only horticultural holdings showed an
improvement in incomes in 1997/98 compared with the previous year.
At the start of the study, organic dairy farms had higher incomes per hectare, on average, than the conventional dairy farms, but on other farm types conventional farms had higher incomes. By 1997/98 organic mixed, dairy and cropping farms achieved higher average NFI than
conventional farms, and there was a reduced difference in incomes on horticultural holdings between the farming approaches. Average incomes on both conventional and organic lowland cattle and sheep farms were lower in the third year, the difference between them having reduced slightly.
Figure 2 Average NFI (£/ha) for conventional and organic farms of six types, 1995/96 - 1997/98 0 50 100 150 200 250 300 350
1995/96 1996/97 1997/98
£/ha Conventional Organic 0 500 1000 1500 2000 2500 3000
1995/96 1996/97 1997/98
£/ha 0 50 100 150 200 250 300 350
1995/96 1996/97 1997/98
£/ha -50 0 50 100 150 200 250 300 350
1995/96 1996/97 1997/98
£/ha
Cropping Horticulture
0 100 200 300 400 500 600 700
1995/96 1996/97 1997/98
£/ha
Dairy Dairy – in conversion
Lowland cattle and sheep Mixed
0 100 200 300 400 500 600 700
1995/96 1996/97 1997/98
5. Cropping
farms
For detailed results see Appendix 1, Table 1A, page 48.
Sample
Of the five farms presented in the organic sample, only one was completely converted in the first year of the study, and two retained a fairly constant amount of conventional land during the three years. The other two farms increased the proportion of their land managed
organically each year during the study period.
One of the organic farms was completely stockless during the study, the other farms had a range of enterprises; three had suckler cows, of which one also had breeding sheep, and one farm had only store cattle and sheep enterprises. The conventional farms had, on average, more livestock units per farm, but they were carried on less grassland, with an average stocking rate of 1.50 Grazing Livestock Units (GLU) per forage hectare compared with the organic farms rate of 0.44 GLU/forage hectare.
The rough grazing shown in Table 1A for organic farms relates to a large area of rough grazing on one farm. (Figures are given per effective hectare area to compensate for any relatively unproductive rough grazing.)
Four of the organic farms were owner occupied, and two of these rented extra land.
Table 4 Summary data for cereal and general cropping farms (£/ha), 1995/96 – 1997/98
1995/96 1996/97 1997/98
Conv. Org. Conv. Org. Conv. Org.
UAA 265.7 372.8 266.6 379.6 276.8 380.5
Livestock outputs 97 58 97 61 89 41
Livestock subsidies 20 17 21 19 20 23
Cropping outputs 676 428 685 471 519 361
Arable area payments 250 217 243 214 226 192
Miscellaneous 26 65 35 58 44 34
Agri-env. payments 10 0 10 1 10 13
TOTAL OUTPUTS 1,079 787 1,092 823 909 664
Livestock inputs 75 22 66 22 57 26
Crop inputs 214 110 232 139 230 77
Labour 166 112 171 112 180 110
Machinery 185 128 201 145 193 146
General 56 62 58 54 61 61
Land 157 154 163 144 160 144
TOTAL INPUTS 852 587 891 616 882 565
Add paid management 15 21 15 21 19 22
MII 243 221 216 228 45 122
NFI 258 218 231 225 59 116
ONI 328 249 299 253 120 148
Figure 3 Output, inputs and NFI for predominantly cereal and general cropping farms (£/ha and £/farm), 1995/96 – 1997/98
Figure 3 indicates the trends in outputs, inputs and NFI for both farming approaches over the three years in terms of £/effective hectare of UAA and for the whole-farm averages. Average whole-farm outputs and incomes for all three years were higher on organic than conventional farms. The clustering procedure was based on SGMs (and hence area in cropping) rather than absolute size, so that although the organic farms were, on average, larger, the area of land in cereals and cash crops is 200 ha for both farming approaches, confirming the success of the clustering procedure. The higher ‘per hectare’ inputs and outputs on the conventional farms therefore relate partly to the greater proportion of their total UAA that is in cereals and cash crops.
Figure 4 Output categories on conventional and organic cereal and general cropping farms (£/ha), 1995/96-1997/98
0 200 400 600 800 1,000 1,200
1995/96 1996/97 1997/98 1995/96 1996/97 1997/98
£/ha
Conventional (n=46) Organic (n=5)
0 50,000 100,000 150,000 200,000 250,000 300,000 350,000
1995/96 1996/97 1997/98 1995/96 1996/97 1997/98
£/far
m
Conventional (n=46) Organic (n=5)
Output Input NFI
Livestock Livestock subsidies
Cropping AAP
Miscellaneous Agri-env
0 200 400 600 800 1,000 1,200
Conv Org Conv Org Conv Org
Outputs
Total output trends for individual organic farms closely mirror the trends in average cropping output. On one large farm, which dominates the picture, changes in conventional cropping and an increase in organic cereals led to increased outputs in 1996/97, but lower yields of both organic and conventional crops (except organic wheat) in the third year caused a 33% reduction in total cropping output.
Four of the five organic farms had increased output from cereals and cash cropping in 1996/97, which in two cases decreased to lower than 1995/96 levels in 1997/98. One of these four, which had soils vulnerable to drying out, had reduced winter wheat yields in 1997/98. The fifth farm showed increased cropping outputs, but decreasing total outputs, each year due to reducing outputs from non-organic livestock enterprises.
[image:26.595.120.402.316.571.2]Average AAP outputs reduced each year for both farming approaches types mainly due to lower payment rates per hectare.
Figure 5 Input categories on conventional and organic cereal and general cropping farms (£/ha), 1995/96-1997/98
Inputs
Figure 5 shows the breakdown of inputs on both groups of farms. Over three years the average total variable costs on organic farms were 36% lower than on the conventional group. One organic farm suffered forage shortages in 1997/98 resulting in high purchases of forage. Apart from seed costs, fertiliser and crop protection costs would be expected to be considerably lower on organic farms, but because of the amount of conventional land on the study organic farms, average total crop costs were only 32% lower (26% of the UAA of the organic farms was conventionally managed).
Apart from general costs in 1995/96 (which include professional costs), all categories of fixed costs were also lower on the organic group compared with conventional. Labour costs were lower on the organic farms, yet labour units (an approximate measure of labour usage) were higher on the organic group, due to higher use of casual rather than paid (regular)
Livestock inputs Crop inputs
Labour Machinery
General Land
0 100 200 300 400 500 600 700 800 900 1,000
Conv Org Conv Org Conv Org
labour. Costs were lower on the organic farms because the Agricultural Wages Board sets a lower hourly rate for casual workers than for permanent staff. Machinery costs (including depreciation, repairs, fuel and contract costs) on organic farms were 25% lower than on conventional in 1995/96, but contract costs increased on the organic farms, so that by 1997/98 overall machinery costs were 10% lower.
Incomes
Figures 3 and 4 show that average incomes on conventional farms decreased each year over the three-year period; in 1996/97 as a result of increasing input costs and in 1997/98 due to decreased outputs. On organic farms, average inputs increased and outputs decreased in 1996/97, largely resulting from increased fertiliser and crop protection costs on one farm on the conventional land.
Discussion
In each of the three years, the average whole farm NFI on the organic farms was greater than on the conventional farms; the relative profitability increased each year (118%, 139% and 271% in 1995/96, 1996/97 and 1997/98 respectively).
Although the large amount of land within the organic group that was conventionally
managed confuses the picture, analysis of the breakdown of outputs suggests the reduction in incomes on the cropping farms in the organic group in 1997/98 was largely a result of
6. Horticultural
holdings
For detailed results see Appendix 1, Table 2A, page 54.
Sample
The organic horticultural units were not situated on typical vegetable growing land. Out of the organic holdings classified by MAFF as Robust Type 3 (Horticulture) in 1996, only one third were in the eastern counties of England, where the majority of conventional
horticultural units were located. Within the sample for this study, the majority of organic holdings were in the southwest and west of England and in Wales, and 40% of the holdings were in Less Favoured Areas. In order to closely match farm types all regions of the Farm Business Survey in England and Wales had to be used for selection of the conventional (‘cluster’) farms. As a result, the holdings that made up the clusters were all from mid, south and eastern regions of England.
All the organic holdings in the survey grew predominantly outdoor field vegetables. A wide range of vegetables was grown, commonly 20-30 different types. The area of protected cropping was small with an average of 1.38% of land area. Their method of marketing was mixed; the survey contains 60% of organic holdings selling through their own direct marketing scheme (box scheme), 20% wholesale and 20% to a packer. Most of those with box schemes bought in vegetables to enable them to continue the box scheme through the year.
Table 5 Summary data for horticultural holdings (£/ha), 1995/96 – 1997/98
1995/96 1996/97 1997/98
Conv. Org. Conv. Org. Conv. Org.
UAA 5.2 8.1 4.9 8.1 6.0 7.8
Livestock outputs 0 386 0 243 0 140
Livestock subsidies 0 98 0 79 0 25
Cropping outputs 8,955 3,775 9,197 3,932 8,374 4,672
Arable area payments 10 0 10 0 9 14
Miscellaneous 1,653 132 2,083 214 1,805 114
Agri-env. Payments 0 6 0 24 0 7
TOTAL OUTPUTS 10,618 4,397 11,290 4,491 10,188 4,972
Livestock inputs 0 152 0 148 0 121
Crop inputs 2,496 868 2,910 940 2,432 953
Labour 5,325 2,998 6,038 3,253 5,440 3,185
Machinery 1,284 536 1,487 509 1,260 505
General 1,105 466 1,227 482 921 428
Land 831 236 818 251 744 261
TOTAL INPUTS 11,041 5,255 12,481 5,583 10,798 5,452
Add paid management 0 0 0 0 0 0
MII -423 -858 -1,190 -1,092 -610 -481
NFI 2,383 1,391 1,909 1,144 2,025 1,677
ONI 2,692 1,481 2,277 1,081 2,267 1,593
Figure 6 Outputs, inputs and NFI for horticultural holdings (£/ha and £/farm), 1995/96 - 1997/98
Figure 6 gives outputs, inputs and NFI in £/per hectare UAA and for whole farms, and illustrates the trends in each series for both farming approaches. Figure 6 shows that organic farms had significantly lower outputs, inputs and net farm income on a per hectare basis than matched conventional holdings. However, these measures can be misleading as organic standards require horticultural holdings to have land in fertility-building, so that each year some land on most organic holdings is not cropped.
In the sample studied, three organic holdings had grassland (with associated sheep
enterprises), two of which had grassland amounting to twice the area cropped. In contrast, none of the conventional holdings had more than 2 hectares in grassland or fallow (most had some land in fallow each year), and this did not amount to more than 28% of their total UAA. Figure 6 also shows the inputs, outputs and NFI on a per farm basis, the basis on which
cluster (conventional) holdings were selected to match the organic holdings. Outputs
Figure 7 illustrates the relative amount of different outputs on conventional and organic holdings if presented in £/ha; showing the major contribution that miscellaneous outputs make to the total outputs on conventional holdings. The relatively small contribution to total outputs from the livestock enterprises on the organic holdings is also evident.
The complexity of cropping on these holdings, and the lack of detailed crop information, especially of yield and price data limits the interpretation of increases in outputs. Output increases may relate to improved marketing, prices, yields, and/or changes in crops grown. Inputs
A slight reduction in area on the organic farms in 1997/98 affects interpretation on a per hectare basis. In 1997/98 organic farm input costs declined back to near 1995/96 levels (Table 5 and Table 2A, page 55), and paid labour costs, which had increased markedly in 1996/97 due to three of the farms employing more labour, fell slightly. In 1997/98
0 2,000 4,000 6,000 8,000 10,000 12,000
1995/96 1996/97 1997/98 1995/96 1996/97 1997/98
£/ha
Conventional (n=52) Organic (n=5)
0 10,000 20,000 30,000 40,000 50,000 60,000 70,000
1995/96 1996/97 1997/98 1995/96 1996/97 1997/98
£/far
m
Conventional (n=52) Organic (n=5)
2.6 organic), although organic farmers used more farmer and spouse labour; 1.9 labour units of the 2.6 total.
Figure 7 Output categories on conventional and organic horticultural holdings (£/ha), 1995/96 - 1997/98
Figure 8 Input categories on conventional and organic horticultural holdings, (£/ha), 1995/96 - 1997/98
Incomes
Figure 6 illustrates that the average net incomes per farm for organic and conventional holdings were similar each year (organic NFI/farm 91%, 99% and 108% of conventional NFI for 1995/96, 1996/97 and 1997/98 respectively). The decline in incomes in 1996/97 for both farming approaches related to increased input costs rather than reduced outputs. The high
0 2,000 4,000 6,000 8,000 10,000 12,000 14,000
Conv Org Conv Org Conv Org
Livestock inputs Crop inputs
Labour Machinery
General Land
1995/96 1996/97 1997/98
0 2,000 4,000 6,000 8,000 10,000 12,000
Conv Org Conv Org Conv Org
Livestock Livestock subsidies
Cropping AAP
Miscellaneous Agri-env
level of farmer and spouse labour on organic holdings (which averaged £2,213/ha over the three years) resulted in negative MII in each year. The combination of increased output and reduced input costs in 1997/98 lead to an improvement in income on the organic holdings (Figure 6 and Table 5 and 2A).
Discussion
The difference between NFI and MII income measures illustrates the relatively high dependency of both organic and conventional horticultural holdings of this size on farmer and spouse labour.
Over the three years, inputs amounted to an average of 80% of farm outputs on the
conventional holdings, whereas the proportion of whole-farm inputs to outputs was 70% on the organic holdings; this may indicate the value of the unmeasured contribution of the costs and benefits of the fertility building land on the organic holdings.
On the organic farms the capital invested (in equipment, glasshouses and livestock) at an average of around £10,000 was considerably lower than the conventional cluster investment of £15,600.
7. Dairy
farms
For detailed results see Appendix 1, Table 3A, page 60.
Sample
The organic sample farm average size and land utilisation is similar to the conventional farms; and inputs, outputs and NFI, charted on the whole farm basis for both farming
approaches, are also similar to the same series shown per hectare of UAA (Figures 9 and 10). All the organic farms in the sample had finished conversion by the start of the reporting period, and four of the five sold organic milk in 1995/96. The fifth started selling organic milk in 1996/97. Three of the farms had some land under cereals, of which two grew grain primarily for stock feed. Herd size ranged from 42 to 270 cows and two farms had breeding sheep enterprises.
Table 6 Summary data for dairy farms (£/ha), 1995/96 – 1997/98
1995/96 1996/97 1997/98
Conv. Org. Conv. Org. Conv. Org.
UAA 102.7 107.2 101.4 108.2 101.2 109.0
Livestock outputs 2,110 1,615 2,099 1,492 1,829 1,670
Livestock subsidies 16 7 20 5 17 2
Cropping outputs 72 75 92 70 80 105
Arable area payments 20 12 24 18 28 23
Miscellaneous 41 65 53 61 56 80
Agri-env. payments 1 35 1 35 1 39
TOTAL OUTPUTS 2,259 1,808 2,289 1,681 2,010 1,918
Livestock inputs 614 484 592 390 547 407
Crop inputs 157 44 176 38 155 34
Labour 395 279 410 321 426 334
Machinery 328 233 327 205 330 273
General 142 109 153 135 147 134
Land 207 173 237 212 252 203
TOTAL INPUTS 1,842 1,321 1,895 1,301 1,858 1,385
Add paid management 0 4 4 4 4 4
MII 417 491 398 384 156 537
NFI 563 587 532 477 354 641
ONI 552 592 517 497 346 614
Figure 9 Outputs, inputs and NFI on dairy farms (£/ha and £/farm), 1995/96 - 1997/98
Outputs
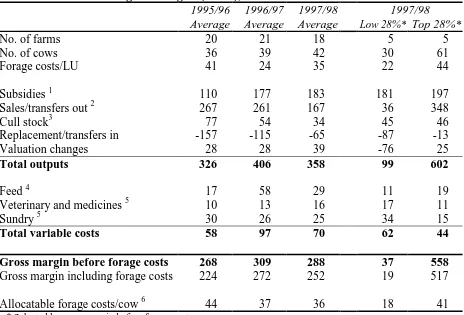
The decline in outputs on conventional farms in 1997/98 was largely due to the declining milk price. Average price achieved in the 1997/98 was 21.5ppl compared with 25ppl for the previous two years. In contrast, the average price for organic milk over the three years increased from 27.6ppl in 1995/96 to 29.4ppl in 1997/98 (see Table 10). Conventional farms had higher average yields per cow, and combined with the higher numbers of dairy cows and stocking rates, this produced greater dairy output per farm for the first two years. Only in the third year, with the reduction in the conventional milk price, and increase in the organic price, were dairy outputs from organic farms higher than conventional.
Organic farms received more agri-environmental payments than conventional. Organic aid scheme money received by one farm accounted for the average figure of over £35/ha shown as received by the organic group.
Dairy enterprise output on organic farms (excluding quota) increased by nearly 20% in 1997/98 relative to 1996/97, partly as a result of higher output per cow and higher prices for organic milk. Output from other livestock enterprises declined, while output from crops increased. The overall result was a 15% increase in total output per hectare.
Inputs
Total inputs per hectare remained relatively stable for both farming approaches over the three-year period. In 1996/97 livestock input costs on organic farms were lower because of a reduction in expenditure on feeds other than purchased concentrates; at the same time there was an increase in paid labour costs (and a reduction in the amount of unpaid labour used) bringing labour costs more in line with the conventional farms, and this was maintained in 1997/98.
Conventional dairy farms had higher expenditure on all input groups shown in Table 6, especially livestock inputs. Table 3A shows higher inputs on purchased concentrates and veterinary costs; however, the organic dairy farms had higher ‘other livestock costs’ per farm and per hectare each year. Higher machinery costs, especially depreciation (see Table 3A),
0 50,000 100,000 150,000 200,000 250,000
1995/96 1996/97 1997/98 1995/96 1996/97 1997/98
£/far
m
Conventional (n=37) Organic (n=5)
0 500 1,000 1,500 2,000 2,500
1995/96 1996/97 1997/98 1995/96 1996/97 1997/98
£/ha
Conventional (n=37) Organic (n=5)
on conventional farms, reflect the overall higher investments in tenant’s capital on conventional farms.
Figure 10 Output categories on conventional and organic dairy farms (£/ha), 1995/96 - 1997/98
Figure 11 Input categories on conventional and organic dairy farms (£/ha), 1995/96 - 1997/98
Income
The changes in outputs and inputs (see Figures 9, 10, 11 and Table 6) resulted in a slight decrease in income measures for organic farms in 1996/97 relative to 1995/96. On organic
0 200 400 600 800 1,000 1,200 1,400 1,600 1,800 2,000
Conv Org Conv Org Conv Org
Livestock inputs Crop inputs
Labour Machinery
General Land
1995/96 1996/97 1997/98
0 500 1,000 1,500 2,000 2,500
Conv Org Conv Org Conv Org
Livestock Livestock subsidies
Cropping AAP
Miscellaneous Agri-env
farms in 1997/98 the average milk yield per cow increased, which, combined with an increase in price, increased revenues to above 1995/96 levels. On conventional farms there was a slight increase in revenues in 1996/97, but a greater increase in costs, resulting in an average 6% decline in NFI/ha. The decrease in the conventional milk price in 1997/98 caused a further decline in conventional farm incomes.
Discussion
Organic dairy farms were less densely stocked than conventional farms. The stocking rate (GLU/effective forage hectare) on the conventional farms was stable during this period, at around 2.2 GLU/eff.for.ha., whereas it declined slightly on organic farms, from 1.7 to 1.56, due to minor changes in land use and total land area.
The price premium achieved for organic milk was around 10% in 1995/96. By 1997/98 conventional milk prices had dropped, and organic milk prices increased, effectively being de-coupled from the conventional milk price, so that in the third year organic farmers
achieved 36% over the conventional milk price. Stocking rates of around 36% higher and the leasing in of quota on the conventional farms, with similar yields per cow, resulted in similar dairy output (net of quota) per hectare in 1997/98 (£1,565/ha organic, £1,580/ha
conventional). With lower variable and fixed costs, this resulted in greater relative
8.
Dairy farms (in conversion)
For detailed results see Appendix 1, Table 4A, page 66.
Sample
The sample of dairy farms converting between 1995/96 and 1997/98 comprised one large mixed farm, one newly established farm being converted from mainly arable (by an experienced dairy farmer) and three specialist dairy farms. For the converting group, the 1995/96 results are those of the last year of conventional production (hence shown as ‘pre-c’, pre-conversion, on the figures). The converting group (c’ting) had more land under cereals and less grassland than the conventional farms; but with an average of 77 cows per farm in 1995/96, the converting farms started with a lower stocking rate compared with the
conventional farms with an average of 132 dairy cows. In 1995/96 the farms about to
convert achieved 5,500 l/cow, compared with the conventional group average of 5,750 l/cow. By 1997/98 three of the farms were under entirely organic management, and two sold
organic milk towards the end of the year; the mixed dairy farm had not started converting the arable enterprises.
The size of the converting mixed-dairy farm means this farm has a large influence on the results from this group.
Table 7 Summary data for conventional dairy farms and dairy farms converting to organic (£/ha), 1995/96 – 1997/98
1995/96 1996/97 1997/98
Conv. Pre-
conversion Conv. C’ting Conv. C’ting
UAA 125.0 167.5 123.4 171.7 122.9 171.7
Livestock outputs 1,838 743 1,809 679 1,589 678
Livestock subsidies 23 24 27 35 26 25
Cropping outputs 97 266 113 254 103 215
Arable area payments 30 114 36 128 42 121
Miscellaneous 39 17 56 43 65 40
Agri-env. payments 0 12 1 2 2 9
TOTAL OUTPUTS 2,027 1,176 2,042 1,141 1,827 1,088
Livestock inputs 561 228 557 235 506 209
Crop inputs 150 147 158 139 165 103
Labour 388 207 385 205 403 214
Machinery 272 190 283 175 288 192
General 144 64 145 83 142 75
Land 212 151 226 161 246 163
TOTAL INPUTS 1,728 988 1,753 998 1,750 956
Add paid management 0 0 4 0 5 0
MII 299 188 293 143 82 132
NFI 410 243 405 207 250 215
ONI 445 252 421 198 278 209
Figure 12 Outputs, inputs and NFI on conventional and converting dairy farms, (£/ha and £/farm), 1995/96 - 1997/98
Outputs
The average total outputs on farms going into conversion were similar in 1995/96 and 1996/97 despite a reduction of dairy outputs, due to a reduction of expenditure on quota leasing and an increase in miscellaneous outputs compensating for the average decreases in cattle and by-product outputs. In contrast to the fully organic dairy farms which saw dairy output increase by nearly 20% in 1997/98, dairy output on converting farms remained similar in 1997/98. Although milk yields remained almost static over the three years, milk sales per cow dropped due to the fall in conventional milk price from an average of 24.8p/litre in 1995/96 to 22.2p/litre in 1997/98. Most of the milk sold had not achieved organic status in 1997/98. The fall in milk price was counteracted in part by revenues from quota leasing. Output from crops (excluding subsidies) also fell, by 18.5% per farm on average, but small increases elsewhere meant that average overall converting farm output fell by 5% between 1995/96 and 1997/98.
Inputs
Other increases and decreases in inputs, some of which may be expected in converting farms (increasing seed expenditure, decreased fertiliser expenditure) resulted in a slight average increase in inputs in 1996/97 compared to the last conventional year. In 1997/98, reduced feed, fertiliser and crop protection inputs led to a small (4%) overall reduction in costs.
Output Input NFI
0 500 1,000 1,500 2,000 2,500
1995/96 1996/97 1997/98 1995/96 1996/97 1997/98
£/
ha
Conventional (n=42) Converting (n=5)
0 50,000 100,000 150,000 200,000 250,000 300,000
1995/96 1996/97 1997/98 1995/96 1996/97 1997/98
£/far
m
Figure 13 Output categories on conventional and converting dairy farms (£/ha), 1995/96 - 1997/98
Figure 14 Input categories on conventional and converting dairy farms (£/ha), 1995/96 - 1997/98
Livestock inputs Crop inputs
Labour Machinery
General Land
0 200 400 600 800 1,000 1,200 1,400 1,600 1,800 2,000
Conv Pre-c Conv C'ting Conv C'ting
1995/96 1996/97 1997/98
Livestock Livestock subsidies
Cropping AAP
Miscellaneous Agri-env
0 500 1,000 1,500 2,000 2,500
Conv Pre-c Conv C'ting Conv C'ting
Incomes
Despite the change to organic management in 1996/97, outputs were maintained, but higher inputs resulted in a fall in average MII and NFI compared with 1995/96. In 1997/98 MII on the converting farms fell again (8%) but NFI rose by 4% compared with the previous year, NFI being 12% lower than 1995/96, the last year in conventional farming.
The incomes of the conventional dairy farms followed a similar pattern as the conventional group selected to match the fully organic dairy farms (see page 22), with similar average incomes in 1996/97 and reduced incomes in 1997/98.
Discussion
Very different output/input ratios for the cropping on the conventional and converting farms relates partly to the smaller average area under cereals on the conventional dairy farms, but is largely due to the inclusion of fertiliser and inputs for forage in the ‘crop inputs’ category in Table 7.
Table 4A indicates an increased use of homegrown concentrates and relative reduction in purchased concentrates on the converting farms, which is probably a reflection of the conversion process, as greater reliance on homegrown cereals would normally be expected after conversion.
The similarity in land use over the three study years reflects the low level of structural changes in these converting farms. Also of significance is the maintenance of dairy cow numbers and milk output (see Table 4A), albeit at the expense of ‘other’ cattle and sheep numbers, resulting in a drop in average stocking rates from 1.64 to 1.38 GLU per effective forage hectare.
9.
Cattle and sheep farms
Lowland cattle and sheep
For detailed results see Appendix 1, Table 5A, page 72.
Sample
The organic and conventional farms both had an average of around 110 livestock units. Organic farms had more land under cereals than conventional, and similar amounts of grassland.
It should be noted that many of these farms, both organic and matched conventional, were at the smaller end of the business size scale in terms of European Size Units. The organic sample also included some new entrants to farming, who had to gain farming experience at the same time as converting their farms to organic production. Although all land was being managed organically in 1996/97 and 1997/98, due to the time taken to convert livestock after land conversion, livestock sales did not qualify for premiums on one of the farms in any of the study years (although this farmer compensated for the lack of organic premium by selling through the farm shop in the third year).
Table 8 Summary data for lowland cattle and sheep farms (£/ha), 1995/96 – 1997/98
1995/96 1996/97 1997/98
Conv. Org. Conv. Org. Conv. Org.
UAA 90.5 96.3 91.1 96.2 91.0 96.0
Livestock outputs 483 592 497 579 430 590
Livestock subsidies 214 101 225 101 190 84
Cropping outputs 81 139 88 143 69 154
Arable area payments 30 67 27 69 30 64
Miscellaneous 52 37 64 36 52 28
Agri-env. payments 26 30 27 40 33 33
TOTAL OUTPUTS 886 967 929 968 804 953
Livestock inputs 208 214 226 203 182 186
Crop inputs 62 29 77 44 76 46
Labour 223 282 230 298 235 329
Machinery 142 196 145 188 149 203
General 78 111 83 121 75 121
Land 146 201 145 219 143 210
TOTAL INPUTS 859 1,033 904 1,073 860 1,094
Add paid management 0 25 0 33 0 35
MII 27 -42 25 -71 -55 -107
NFI 157 19 155 -14 96 -33
ONI 171 87 174 27 120 14