'-. ·, ...
MALAWI
Economic structures
and development problems
COMMISSION OF THE EUROPEAN COMMUNITIES
Dl RECTORATE-GENERAL FOR DEVELOPMENT AND COOPERATION
/
_.MALAWI
/Economic structures
and development problems
-~
June
1973
Page 2,
§
2.1.Public finance
MALAWI
Economic Structures
and development problems
June
1973
C 0 R R I G E N D U M
-SUMMARY
ECONOMIC STRUCTURES AND DEVELOPMENI' PROBLEMS
I. HISTORICAL BACKGRClJND
II. ECONOOC GEOGRAPHY
2.1. Natural ResourQes and Demography
2.2. Transpopt and Communications
2.2.1. Road Transport
2.2.2. Rail Transport
2.2.3. Lake Service
2.2.4. Air Transport
2.2.5.
Teleco~icationsIII. ECONCMIC r,rRENDS AND STRUCTURES
3.1. Macro-economic Trends
3.?.
Principal Sectors of Production
3.2.1. Agriculture
3.2.2. Mining and Industr,y
3.2.2.1. Mining
3.2.2.2. Manufacturing
3.2.~.3.
Building and Construction
3.2.3. Energy
3.2.3.1. Electricity
3.2.3.2. Water
3.3. Money and Finance
3. 3
.1.
~ank:ingand the Monetar,y System
3.3.2.
PUQlic Finance
3.4. External Relations
3.4.1. External Trade
3.4.2. The Balance of Payments
(1) 1;>1ue pages
3.4.2.1. Pattern and Perspectives
3.4.2.2. Public aid
3.4.2.3.
~erna1Debt
VIII/837(73)-E
f!e
1 (1)
IV.
SOOIAL STRUCTURE4
.1. Manpower
Employment and Wages
4.2.
Manpower
Education and Skills
4.3.
Health
V. PLANNING AND PERSPECTIVES
5.1.
Institutions
5.~.Achievements
5.3.
Strategy
5.4.
Disequilibria and Conclusions
~
35
35
37
39
MAPS
1 .... General
map
2 -
Mean annual rainfall
3 - Distribution
+Density of Population
4
-Tribes
5 -
Transport
6 -
Agricultural products
VIII/837(73)-~
3 bia
4 "bia
4 ter
5
biaLEGENDE
ROUTE PRINCIPALE
ROUTE EN CONSTRUCTION
~ CHEMIN DE FER CHEMIN DE FER EN CONSTRUCTION
.., AERODROME ..., ••• _ LIMITE DE REGION
ECHELLE
0 50 100 150km
Tanzanie
Mozambique
W~rs
Nocala
VIII/837(73)-E
Basic data (1)
Area
Total inc. lakes
118,480
km2Land area
90,080
km2Population
Total
4.6 millions (1972)
Density (excl. lake)
51 inhab./km2
Growth rate
2.6
%
(official)
Main urban centres (1966)
Blantyre
109,460
Zomba (capital)
19,670
Linlongwe (New capital)
19,430
Mzuzu
8,490
Currency
Up to Febr. 1971 : 1 Malawian Pound
=
1 Pound Sterling
Febr. 71 - March 1973 : 1 Malawi Kwacha
=
100 Tambala
=
0.50 Pound Sterling
=
1.20 U.A.
Since Marche 1973 : 1 Malawi Kwacha
=
1.087 U.A. (fluctuating with the Pound Sterling)(2)
G.D.P.
Total (mn. UA at current factor cost) : 333.6 (1971)
Growth rate
(%) -
current prices
6.8 (1964-71)
- constant prices : about 5.8 (1964-71)
Per capita (U.A.) :
10
(1971)
Growth rate
(%) :
4.2 (1964-71)
External trade
Imports (ron. UA)
Share of enlarged EEC
(%)
Exports (mn. UA)
Share of enlarged EEC
(%)
Cover ratio
(%)
Concentration of
export~(%)
(tobacco, tea,
groundnut s)
(1) U.A.= pre-devaluation
u.s.
dollar
(2) June 1973
1968
.!2lQ
.!ill
95.4
110.5
122.5
40.2
35.1
38.1
47.0
55.8
70.4
64.1
58.0
58.5
49
52
48
Main e:s>orts {mn. U.A.)
Tobacco
T~a
Groundnuts
Cotton
External aid
(average annual net
Total public aid
Multilateral sources (I.D.A. mainly)
Bilateral sources
including U.K.
1968
12.6
11.6
5.4
1.6
!212
19.8
13.1
5.0
3.4
Value
31.85
8.58-23.27
(15.12)
Public aid as % of G.D.P. : 14.5 (Tropical Africa average :
4.5)
Public aid as% of Imports : 27.(Tropical Africa average : 15)
Public aid per capita (U.A.) :
1.2
(Tropical Africa average : 4.6)
Debt situation
Outstanding external debt (mn•' U.A.)
231,2 (1972)
(%
of GDP)
36.5 (end 1971)
Debt service
in
mn.
U.A. : 8.6 (1971)
as a% of exports : 11 (1971)
ill!
26.2
14.0
7.1
3.0
..1...
100
27
VIII/837(73)-E
Economic structures and development problems
I. Ponulation and infrastructure
Nyasaland, who was part of the Central African Federation from 1953 to 1963 (with
present Zambia and Rhodesia) declared its independence on July 6th, 1964, and changed its
name into Malawi.
It is a land-locked country, situated in south-eastern Africa, with a total area of
118.5 thousand km2 (90 thousand of which are lake surface), about the size of Dahomey.
The population is estimated at 4.6 million in 1972, with one of the highest densities in
Africa, 5.1 inhabitants per km2 (excl. the lake surface). Its growth rate is probably
higher than the official estimate of 2.6
%.
With a growth rate of 3%,
the population would double in 23 years.Some 5
%
of the population is urbanized, the main urban centres being (popul. 1966) Blantyre (110,000), Zomba (capital : 20,000), and Lilongwe, where a new capital is beingbuilt.
The latter has been chosen with the aim of moving the commercial and industrial focal
noint of the country's development away from the heavily concentrated South, and also of
encouraging the opening up of new agricultural areas outside the favoured Shire Valley
region.
This regional imbalance in Malawi's development must have caused strong internal
migratory movements. Moreover, the overall poorness of the country has brought many
Malawians to emigrate to countries offering them better earning prospects. There were some
266,000 Malawians working abroad in 1966, mainly in Rhodesia, South Africa, Tanzania and
Zambia.
The road-network is highly developed, with a density of 90 km of roads per 1,000 km2,
but less than 9
%
of the 10.5 thousand kilometres are asphalted. Road transport has been recently boosted by an increase in Zambian imports arriving via Mozambique, following theborder blockade with Rhodesia.
Rail connections are good with the nearest Mozambican Harbours of Beira, Mozambique
and Nacala, but there is no railway in the mountainous northern half of the country.
II. Economic structures
2.1. Malawi figures on the list of the 25 least developed countries of the world drawn
up at the 26th session of the U.N. (1971).
Total GDP at factor cost amounted to 333 million U.A. in 1971 and GDP per capita to
10
U.A.Growth since independence has been remarkable. GDP per capita grew at an annual
rate of about 4.2
%
(3.2% at constant prices) (1) between 1964 and 1971, despite the setbacks caused by unfavourable wheather conditions between 1966 and 1968. Investmentfigures, which fluctuated between 10 and 20% of GDP, suggest a favourable low
capital-output ratio.
Public finance. Public investment has increased by more than three thirds between
1964 and 1971, while public consumption was contained in limits and actually decreased
in terms of GDP during the same period. Malawi, which used to run fairly large current
budget deficits (regularly covered by British grants), has been able to progressively
reduce them, attaining near to perfect equilibrium in 1971/72. If public income is no
more dependent from budgetary aid, it has become increasingly dependent on borrowing,
which still covers the total amount of development expenditures. The increase in external
publir, debt, which represents over one third of GNP, partly reflects the diminishing
importance of grants as a source of external finance.
External trade and balance of payments
Export values grew at an annual average rate of well over 10
%
since 1964. This isto be attributed entirely to volume growth up to 1967, while since that year it is due
to very favourable price trends.
Between 1964 and 1971, imports grew at an average annual rate of about 18
%.
Their share of consumer goods was drastically reduced from some 50%
to 27 % over the period.This partly reflects the success of import substitution, and partly is a consequence of
the inadequacy of indigenous industries such as cement, and of supply difficulties in
local firms.
The cover ratio of imports by exports is only some 50
%.
Rising imports and the decline in ~.K. budgetary aid brought to a deterioration in the current account balance, desnite a rapid rise in re-exports (mainly post-auction
VIII/837(73)-E
packing of Zambian tobacco, previously sent to Rhodesia) and in earnings from non-factor
services (mainly local spending by expatriates and tourist earnings).
On capital account the favourable trend has benefited from the rather "soft" terms
under which the Malawi Government has been able to borrow until recently.
Malawi's official exchange reserves amount to somewhat more three months imports
since a few years.
Debt service payments have been increasing steeply over the past years and
repre-sent 11 %of exports in
1071.
2.2. Main sectors of production
Agriculture. Agriculture remains by far the dominant sector, accounting for more
than 50% of GDP, the "subsistence" smallholdings themselves still constituting more th~n one third.
Over half of the land area is suitable for cultivation, but only one third of the
latter is actually exploited. The potential for opening un new land is particularly
large in the north.
Over 8 tenths of the cultivated area is under customar,y tenure, mainly mixed cropping
of maize (the main food crop), pulses, millet, sorghum, groundnuts, cassava, potatoes as
well as rice, cotton, and tobacco ; the rest being in specialized estates, where the
princioal exnort crops are grown : tea, burley, flue-cured tobacco, and tung oil.
Tobacco, tea and groundnuts account for 80% of total exports.
Mining. Mineral exnloration is actively promoted. Large bauxite deposits would
seem to have been discovered at Mlanje.
Manufacturing. Monetary manufacturing outnut grew by more than 200
%
in value terms between1964
and 1971, rising from less than6
%
to more than 10% of total GDP overt.he period.
Power.
Nkala Falls).
32 MW by 1080.
Present total output is about 36 MW (24 MW from the hydro-electri source at The new Tedzani Falls scheme will allow to add
16 MW
by1973
and furtherIn the long term, one foresees a further extension of hydro-electric
caDacity on the Shire Valley, as well as the possible imnortation of~ectrical power from the Cahora-Bassa scheme on the Zambezi.
III. Development imbalances
3.1. Production structures
Lack of mineral resources, limitation of capital and skills and small size of the
local market are all factors which have favoured Malawi's largely agriculture-based
economic development. Despite a reduction of "subsistence" - smallholding- production
from 42
%
to 35%
of GDP between 1964 and 1971, agriculture still accounts for over50
%
of GDP.Growth is partly dependent on exports performance. In this connection it must be
remarked that Malawi's exports concentration has been increasing recently. Out of the
three main products : tobacco, tea and groundnuts, only the prospects of the first one,
the quality of which has very much increased recently, can be said to be really good.
Though production of manufactures experienced a very brisk growth during the same
period, this is partly due to an excessive concentration of consumer good industries in
Rhodesia during the Federation period (up to 1963). The limited size of the local
market does not allow for a further continuation of this trend, unless the possibilities
for exploiting the appearently large deposits of bauxite at Mlanje is confirmed, in
which case it is envisaged to engage in aluminium smelting.
3.2. Regional disparities
Malawi suffers from a marked regional imbalance, which is due to the historical
concentration of farming in the South, which was reinforced by its membership of the Central
African Federation between 1953 and 1963. Most activities are concentrated in the
Southern region, which brought to a marked regional settlement bias with only about 12
%
of the total population to be found in the whole of the Northern Region and more than 50%
in the Southern Region alone.
If the prospects for mineral production materialized, this would contribute to
aggravate even further such regional imbalance as they are located in the South-east of
the country.
The construction of a new capital in the central region, as well as the plans for
opening up new land for cultivation in the Northern Region indicate the Government
VIII/837(73)-E
3.3.
Employment imbalanceOnly 50% of the population are active, and 24% of them are in paid employment.
However, over 60% of the latter, or some 3007000 persons, are employed abroad, and principally in Zambia, Rhodesia, Mozambique and South Africa.
It is not difficult to imagine the problem which would arise if even only a part
of these migrant workers were forced to come back to Malawi. They would flock into the
towns and dramatically increase the arrival of job-seekers in urban areas which are at
present fostered already by widening urban-rural income differentials.
3.4.
ConclusionsMalawi has good prospects for economic growth, which mainly lie with
i) the availability of vaste untapped land resources
ii) the expected export oerformance of its main foreign-exchange earner
light of Malawi's apnlication for association with EEC)
iii) the diversification of its production into sugar and mining.
tobacco (in the
As to the second point, Malawi's export performance after
1974
will largely dependon it abtaining free entry for its main export products on the European Common Market,
in particular tobacco, groundnuts and sugar (production of which is quickly growing).
Malawi would further very much benefit from the scheme for the stabilization of export
earnings from tobacco, cotton, groundnuts and sugar recently proposed by the European
Commission.
However, a heavy and growing imbalance between the rich Southern Region and the poor
and ooorly inhabited Northern Region has so far contributed in limiting the size of the
local market and partly the degree of income distribution, and has been accompanied by a
very substantial drain on human resources which are at present gainfullyemo1oyed in
neighbouring countries.
Various aspects of the Government's strategy make clear its determination to offset
the concentration of economic activities in the Southern Region, and indeed it is becoming
a matter of necessity for the country to make more of its soil resources further north.
The most spectacular policy decision in this respect has been to build a new capital at
Lilongwe, in the Central region.
Concerning the financial situation, the Government has decided not to call any more
on British budgetary aid. As to the country's Development Budget, it will have to be very
largely financed by external sources, at least in the next few years. Malawi does
there-fore need much financial assistance on particularly soft terms.
I. HISTORICAL BACKGROUND
European influence in what was to become Nyasaland began with the arrival of Scottish
missionaries in the 1870s, and in 1878 the foundation of the African Lakes Company.
The territory of N,yasaland was declared a British Protectorate and the first
Commis-sioner appointed in 1891. Despite fairly intense rivalry between the settled agricultural
peoples - Chewa, Manganja, Tonga, Tumbuka - and the raiding Ngoni and Yao tribes,
terri-torial unification sowed the seeds of nationalist sentiment• out of which grew the
Nyasaland African Congress, founded in 1944.
The formation in 1953 of the Central African Federation, comprising Nyualand. and
North and South Rhodesia (the modern territories of Malawi, Zambia and Rhodeaia)
waa
thought to threaten Nyasaland's future autonomy, thus adding to growing rural discontent
and giving a new impetus to a militant independence movement. Against this background,
Dr. Kamuzu Banda was acclaimed leader of the Congress Party in 1958 after a long absence
of forty years from his home country, and in 1961 the Party achieved sweeping auocesa in
the parliamentary elections. The Federation was dissolved in 1963 and the State of
Malawi was proclaimed independent on July 6th, 1964.
The following year, Dr. Banda consolidated his dominant position as leader in
crushing an armed rebellion of the opposition and in July 1966 he was elected President of
the Republic of Malawi. Except for a brief skirmish involving a small band of erlleQ.
politicians in 1967, Dr. Banda has retained this position unchallenged to this dq •
•••
• When the nation attained Independence in 1964, the economy was very strongly
orien-tated towards the South. From the last century, European settlers had been encouraged to
set up farms and estates in the very fertile Shire valley and the draw of the RhGdeaian
settlements and mines also encouraged a substantial southern-bound migration. The
Federa-tion established in 1953 reflected, and helped to underline politically and economically,
this unequal concentration in the South. In the 1960a, Malawi's economy waa still entirely
dependent on agriculture in the Shire region ; although a major part was subsistence
production, the agricultural estates were still European dominated, producing the principal
exports - tobacco, groundnuts and tea - for which the only outlets were through Rhodesia
and the port of Be ira in Mozambique. Today, Rhodesia and South Africa remain not only
Jlalawi 's most important tn,.ding partners in Africa, but they also provide jobs for
VIII/837(73) ....
;&:At Independence therefore, a firm economic pattern was alre~ established with a large part of the economy still dependent on European resources and control. This pattern
has only now begun to be challenged by the Malawian Governaent ; economically, theae W'r7
marked historical imbalances remain while politically, Dr. Banda bas sought at firat to
maintain and encourage Malawi's links with southern African countries 1 Malawi took no
sides after Rhodesia's Unilateral Declaration of Independence in
1965,
and in1967
aheestablished diplomatic relations with the Republic of South Africa as a prelude to
"dialogue" between black and white regimes.
Very recently, however, Dr. Banda h~ somewhat modified this diplomatic stance of "entente" with southern white regimes. After a period of bitter exchanges with Zubia
and Tanzania in the
1960s
over border claims, relations have been patched up betweenMalawi and her black neighbours. In
1970,
diplomatic relations were established withZambia, with whom economic cooperation, mainly as a result of Zambia's border blockade
with Rhodesia, has been accelerating in recent years.
Malawi is a member of the Commonwealth.
II. ECONCIUC GEOGRAPHY
2.1. Natural resources and demograPhy
Malawi is a landlocked countr,y in south-eastern Africa with a total area of
118,480 km2 (90,080 km2 excluding the lake), making it a great deal smaller than ita
illlllle-diate neighbours and superficially about the size of Dahomey. It is bordered on three
sides by Mozambique and has common frontiers with Zambia to the West and Tanzania to the
North (see map) •
It is a long, narrow countr,y with a-maximum length of
830
km. and a ma.xi.IIWil width of 160km.,
lying along the West side of the East African rift valley system. The northerntwo-thirds of the valley floor are occupied by the huge Lake Malawi, which is drained by
the Shire river running into the Zambezi to the South. Malawi is a plateau country with
large variations of height : from the Nyika and Vipya plateaux in the Northern Region that rise to over 2000 metres, the land descends to the Shire valley in the South at little
above sea level, to rise again to the Mlanje Mountains reaching
3000
metres. 'l'hese largedifferences in height are accompanied by marked climatic variations through the year 1
May to August is a cool period, followed by a short, hot season in September, October of
increasing humidity when the temperature rises to 30°0., and then a wet seaaon of several
months between November and April when 90 '1> of the year's rain falls (see rainfall JD&p,
following_ page).
In the absence of significant known mineral deposits, Malawi's most important natural
resources are water and ver,y fertile soil deposits. Lake Malawi provides moderate fishing
grounds. Its waters are too deep to support heavy fish populations. However, the Shire
river and Lake Malawi represent an enormous potential in terms of irrigation and hydro-electric power which is as yet largely untapped. The soil distribution is aoaewhat uneven,
th~ best deposits being found principally in the Southern Region, round the shores of Lake Chilwa and along the Upper and Lower Shire valley, although good soils exist also in the
Nkhata Bay area and on the Lilongwe-Kasungu. plateau. As yet, however, only about one third
of the estimated total cultivatable land available is being put to use.
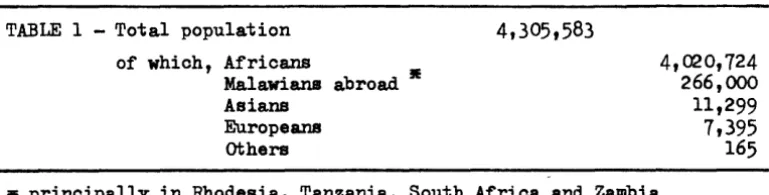
The last official estimate of Malawi's population was made in the 1966 oensua of
which the summary results are reproduced below :
TABLE 1 -
Total populationof which, Africans
Malawians abroad • Asians
Europeans others
4,~0,724 266,000
11,299
7,395
165• principally in Rhodesia, Tanzania, South Africa and Zambia
[image:17.566.41.426.662.759.2]MALAWI
CARTE DES PRECIPI-TATIONS MOYENNES ANNUELLES
SOURCE: "MALAWI,. uM ~lud• ~ographiqu•
par J. G. Pik• N G.
r
Rimming/on- London 19650
LEGENDE
mm.
-
plus de 2.000mmm
1.750- 2.000~
1.500- 1.750~
1250-1.500III1IIIID
1.000- 1.250~
870-1.000~
750-870mrn
625-750ECH~LLE
The preceding census of 1945 indicated a population of about half that
ot
1966,implying an annual average rate of growth of 3.3 ~which is extremely high. However,
even on the most conservative estimate, the population of Malawi probably exceeds 4.5
mil-lion in 1973.
Given that a high proportion of the total area is covered by water {more than a
fifth), and that only about 56
%
of the land is sui table for cul ti vat ion, Malawi haa oneof the highest population densities in Africa with more than 47 inhabitants per km2 of
land and more than 85 inhabitants per km2 of land suitable for cultivation. Moreover,
despite a very low rate of urbanisation - only 5 ~ of the population were living in
centers with more than 2000 inhabitants in 1966 (see Table 3) - there is a marked regional
settlement bias with only about 12 ~ of the total population to be found in the whole
ot
the Northern Region and more than 50~ in the Southern Region alone. (see demographic •p,
which follows).
TABLE 2 - Population in Urban and other Areas in 1966
I
Malawi : total
Urban Areas : total
Blantyre Urban Zomba Urban Lilongwe Urban Mzuzu Urban other Urban
Other Areas : total
Source : 1966 Census
4,039,583 202,057
1~,461
19,666 19,425 8,490 45,015 3,837,526
The regional imbalance reflects not only the traditional importance of agriculture,
which ptill supports about 90
%
of the population, but also the historical concentrationof farming in the southern part of the country.
Taking the population as a whole, the activity rate is rather low in Malawi with
(in 1966) only about 50
fo
of the population in the age-group 15 to 60 years, and the male population outnumbered by the female by about5
fo.
With rapid population growth, however, the rate of activity is expected to rise.2.2. Transport and Communications (see map 3)
Given the harsh geographical, climatic and relief conditions, transport is generally
good in Malawi with main roads of reasonable quality connecting all the principal town.
and a rail network linking the country with both Nacala and Beira on the Mosaabique coaat. With the landlocked geographical location of the country, external communication.,
[image:19.570.34.335.337.506.2]MALAWI
DENSITE DE LA POPULATION
SOURCE : Malawi populaf/on C•nsus august 1966 Provisional r•port
NOMBRE D' HABITANTS PAR MILLE CARRE:
D
DE 0 A 5§
DE 6 A 50[[]
DE 51 A 100lil1I1
DE 101 A 150~
DE 151 A 200~
DE 201 A 300D
DE 301 A 400Ill
DE 401 A 500Ill
PLUS DE 500ECHELLE
ECHELLE
0 50 100
SOURCE: "BRITISH CENTRAL AFRICA"
par Sir Harry Johnston .. LondOn 1897 ~f
"MALAWI" un~ #fud~ 9fographiq~
VIII/837(73)-E
as the internal communications network has recently been considerably extended,
transpor-tation representing the second largest category of public development spending.
2.2 .1. Road transport
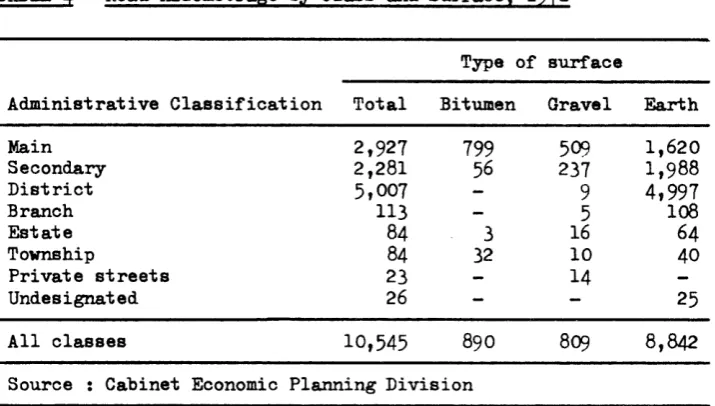
The construction and improvement of the road network has progressed rapidly since Independence and in 1971 roads covered a total of 10,600 kms.
TABLE 4 - Road Kilometrage by Class and Surface, 1971
Administrative Classification
Main Secondary District Branch Estate Township
Private streets Undesignated
All classes
Total 2,927 2,281 5,007 113 84 84 23 26 10,545
Type of surface
Bitumen 799 56 3 32 890 Gravel 509 237
9
5 16 10 14 809Source : Cabinet Economic Planning Division
Earth 1,620 1,988 4,997 loB 64 40 25 8,842
About 9% of all roads (27% of main roads) are bitumenised (1971), while 8 ~of
the roads are gravel-laid. Even on district earth roads, which are practically all
earth-surfaced, access by landrover is possible almost throughout the year, thus
provi-ding many agricultural areas with essential links to distribution centres.
The main roads join the important focal points of the principal North-South economic
axis of the country between Blantyre/Limbe, Zomba, and Lilongwe, and up until now
development efforts have been rather concentrated on the improvement of principal
existing routes, such as the upgrading of the 270 kilometres ofthe Zomba-Lilongwe road
to first-class bitumen standard (completed in 1970) and of the Liwonde-Monk:ey Bq route,
due for completion in 1974. Parallel to the North~outh Ml road linking Blantyre to Tanzania in the North, a Lakeshore road, from Salima to KA-.tronga, is under oonatnction
(the Nkhotakota-Nkhata Bay stretch should be completed in 1973). Existing road links
with external territories are, besides the North-South Ml road, the :M2 South-West link
to Rhodesia (through Tete) and the North-West M4 road linking Lilongwe with Zambia.
Two major hauliers account for about 40
%
of the road freight traffic while over60% of all operators, owning no more than one vehicle, account for about 16 ~ of total
haulage. Due to a buoyant demand, there is a lot of scope for small private enterpriae
and from 1969 to 1971 the number of private carrier permits rose by 15
%.
United [image:22.562.43.401.223.426.2]bEGENDE
ROUTE PRINCIPAbE
ROUTE EN CONSTRUCTION
. - CHEMIN DE FER
CHEMIN DE FER EN CONSTRUCTION
+ AERODROME LIMITE DE REGION
ECHEbbE
0 50 100 150km
•,
Tanzanie
Mozambique
VIII/837(73)-E
Table 6 ahova the developaent of freight and paaaenger rail traffic aince Indepen-dence. It can be seen that there ia an overall long-term upward trend up until
1971,
although this is rather slow. The sharp rise in freight traffic in
1967
and1968
wu
mainly due to the re-routing of Zambian transit consignments after the UDI in Rhodesia
this traffic fell off again markedl7 with ~he opening of the Tam-Zan oil pipeline. Recent riaea reflect the opening of the new line, and estimates also show that during
the first half of
1972
trafficwas 10
~ up on the equivalent period in1971 ;
thisgrowth-rate is certain to have accelerated since then with the rapid rise in tranait
freight.
TABLE
6 -
Traffic on Malawi Rail!!,l!,1964-71
Year Freight in net short ton-k:ma. (
•ooo)
Passengers1964
1965
1966
1967
1968
1969
1970
1971
(est.)85,300
99,200
148,600
193,200
203,500
145,500
189,500
199,600
513,400
581,990
737,180
665,300
665,000
737,500
840,600
837,000
Source : Ministry of Tra.naport and ColiDIIU.Ili.cationa
2.2.3.
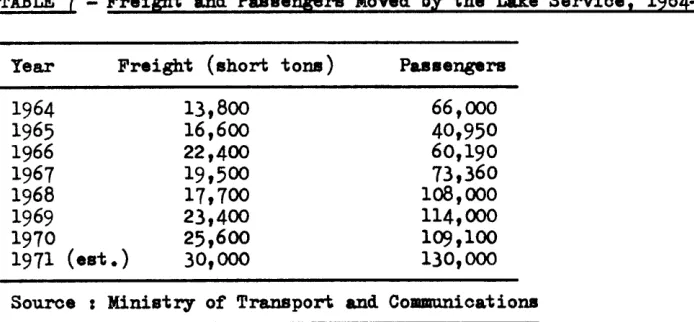
Lake ServiceMalawi Railways obtained full ownership of the assets of the Lake Service in
1968 ;
although it runs at a heavy loss, the Service has enjoyed rapid growth since Independence.TABLE
7 -
Freigb.t and Paaaene;e:ra Mo'ftd by the Lake Service,1964-71
Year
1964
1965
1966
1967
1968
1969
1970
Freight (short tons)
1971
(est.)13,800
16,600
22,400
19,500
17,700
23,400
25,600
30,000
Passengers 66,00040,950
60,190
73,360
108,000
114,000
109,100
130,000
Source : Ministry of Transport and Collllln1lli.cations
The losses of the Lake Service are principally due to under-utilisation and
ina-dequate port facilities, the latter being the oa.use of the former ; efforts are being
made to modernise and taprove the Service.
[image:24.564.73.392.252.418.2] [image:24.564.74.421.538.699.2]2.2.4. Air Transport
Air Malawi, a wholly Government-owned fleet of seven aeroplanes, operates from
Chileka both internal services to all three regions and international routes to Salisbury,
Beira, Lusaka and Johannesburg. Foreign airlines, also operating from Chileka (Air Rhode~
sia, Zambian Airways, BOAC, EAA, DETA) link Malawi directly with other capitals in Africa
and Europe. A bitumen runway also exists at Lilongwe where it is proposed to build a
second international airport.
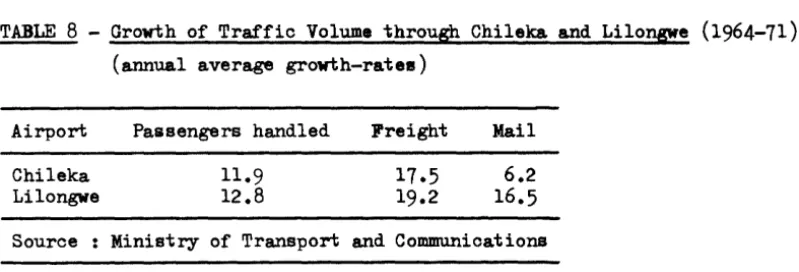
Air traffic has recently witnessed a rapid development and in 1971 nearly 200,000
passengers passed through Chileka airport., which also handled
1500
short-tons of freight.From 1964 to 1971 estimated annual growth-rates of traffic volume through Chileka and
Linlongwe airports were as follows :
TABLE
8 -
Growth of Traffic Volume through Chileka and Lilongwe (1964-71)(annual average growth-rates)
Airport
Chileka Lilongwe
Passengers handled
11.9 12.8
Freight Mail
6.2
16.5
Source : Ministry of Transport and Communications
2.2.5. Telecommunications
[image:25.573.48.448.307.443.2]VIII/837(73)-1:
III. ECONCJeiiC TRENDS AND STRUCTURES
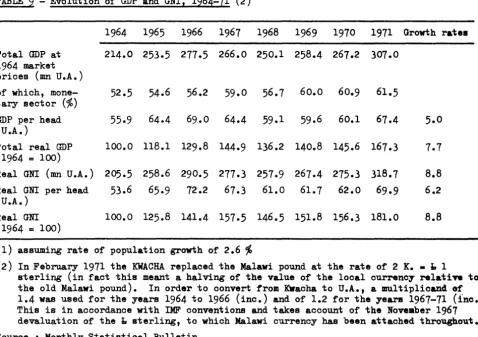
3.1.
Macro-economic TrendsMalawi is one of the poorest countries of Africa and figures on the liat of the
25
least developed countries of the world drawn up by the Santiago UNCTAD Conference.
However, growth of the economy since Independence has been rapid. Table
9
shows that, despite the setbacks caused by unfavourable weather conditions between1966
and1968
from which the recovery was impressive, total real Gross Domestic Product grew by nearly70
'%> at an average annual rate of7. 7
~between1964
and1971.
The growth of realGross National Income was even faster, and GDP per head grew at 5
%
annually (1).TABLE
9 -
Evolution of GDP and GNI,1964-71 (2)
Total GDP at
1964
market prices (mn U.A.)of which, mone-tary sector (%)
GDP per head (U.A.)
Total real GDP
(1964
=
100)
1964
1965
1966
1967
1968
1969
1970
1971
Growth ratea214.0 253.5 277.5 266.0 250.1 258.4 267.2 307.0
52.5
54.6
56.2
59.0
56.7
60.0
60.9
61.5
55.9
64.4
69.0
64.4
59.1
59.6
60.1
67.4
5.0
100.0 118.1 129.8 144.9 136.2 140.8 145.6 167.3
Real GNI (mn U.A.)
205.5 258.6 290.5 277.3 257.9 267.4 275.3 318.7
8.8
Real GNI per head
53.6
65.9
72.2
67.3
61.0
61.7
62.0
69.9
6.2
(U .A.)
Real GNI
(1964
=
100)
100.0 125.8 141.4 157.5 146.5 151.8 156.3 181.0
(1) assuming rate of population growth of
2.6
%
8.8
(2)
In February1971
the KWACHA replaced the Malawi pound at the rate of2
K. • 1.,1
sterling (in fact this meant a halving of the value of the local currency relati?e to the old Malawi pound). In order to convert from Kwacha to U.A., a multiplicaD4 of
1.4
was used for the years1964
to1966
(inc.) and of1.2
for the years1967-71
(inc.). This is in accordance with IMF conventions and takes account of the Noveaber1967
devaluation of the l:r sterling, to which Malawi currency has been attached throughout. Source : Monthly Statistical Bulletin
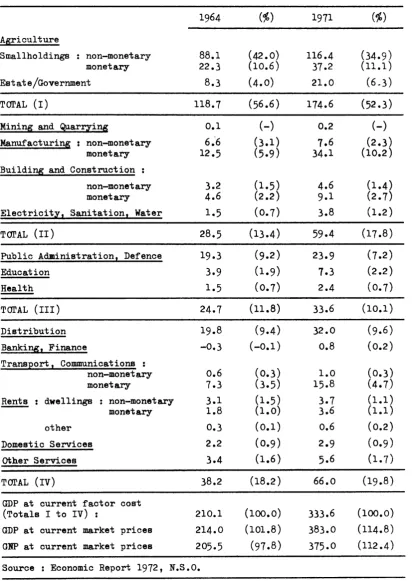
[image:26.568.58.536.303.640.2]TABLE
10 -
GDP by industrial Origin,1964
and1971
(U.A. mn. at current prices)Agriculture
Smallholdings : non-monetary monetary
Estate/Government
Tal'AL (I)
Mining and ~ar;zing
Manufacturing : non-monetary monetary
Building and Construction :
non-monetary monetary
Electricity, Sanitation, Water
Tal'AL (II)
Public Administration, Defence
Education
Health
Tal'AL (III)
Distribution
Banking, Finance
Transport, Communications non-monetary monetary
Rents dwellings non-monetary
monetary
other
Domestic Services
Other Services
Tal'AL (IV)
GDP at current factor cost (Totals I to IV) :
GDP at current market prices
GNP at current market prices
88.1
22.3
8.3118.7
3.24.6
1.528.5
24.7
0.6
7.33.1
1.8
0.3 2.23.4
38.2
210.1
214.0
205.5Source : Economic Report
1972, N.s.o.
(%)
(42.0)(10.6)
(4.0)
(56.6)
(-)
(3.1)(5.9)
(1.5) (2 .2)( o.
7) [image:27.563.47.461.115.697.2]VIII/837(73)-E
In the economy as a whole, the subsistence sector declined from nearly half of
GDP (48.4
%)
in 1964 to 40.0 ~ in 1971. !griculture remains by far the dominant •ector, accounting for more than 50% of GDP, the "subsistence" smallholdings themselves still contributing more than one third, despite a notable diminution of their relativeimpor-tance (see Table 10). Secondary sector production including mining increased by aore
than 140% (in terms of Kwachas) raising its share of total production from 13 ~to nearly 18
% ;
this represents an annual growth rate of more than 12%,
even including thesubsistence sector~which grew much more slowly.
TABLE 11 - Total Domestic E;penditure, 1964 and 1971 (market prices)
1964 •
Value 'fo GDP Value
1. Total Consumption 213.5 99.7 355.6
Monetar,y : Government (32.3) (15.1~ (51.6)
Private (73.1) (34.2 (164.4)
Non-monetar,y 108.1 50.5 139.6
2. Gross Fixed Capital Form 16.7 7.8 62.4
3. Changes in Stocks -0.8 -0.4 7.2
4. Total Domestic Expenditure 229.4 107.2 425.2
(1 + 2 + 3)
5· Tradi!!S: Surplus -15.4 -7.2 -42.2
6. GDP at Market Prices 214.0 100.0 383.0
7. Net Factor Incomes Paid -8.5 -4.0
-B.o
Abroad (minus)
8. GNP at Market Prices 205.5 96.0 375.0
• revised figures
Sources : (1) Economic Report 1972
(2) National Accounts Report (1964-68), N.s.o. 1970 N.B. : Figures are not strictly comparable
1971
'fo
GDP 92.8(13.5) (42.9) 36.4 16.3
1.9 111.0
-11.0 100.0 -2.1
98.0
The most striking feature of the brea.kdown of the GDP into expenditure ite• (Table 11) is the significant rise, both proportionately and in absolute terms, of Grose Fixed Capital Formation between 1964 and 1971. As a percentage, investment ·
fluctuated between a low of 8 to 10
%
in 1964 to a high of around 20 ~ in 1968.Currently, investment expenditure is almost equally divided between public and private sources. Given the buoyant trend in the growth of the economy, the investment figures
suggest a rather low capital-output ratio even when stocks are included in investment (for the period 1964-69, estimates of between 2.2/1.0 and 2.4/1.0 have been given relative to GNP) and this is an optimistic indication of the productiveness of capital
accWillllation.
[image:28.568.52.469.243.587.2]So far as national savings are concerned, the situation hall also been radically
transformed since 1964. Until 1969, consumption by the public and private sectora exceeded GNP and only since 1970 has the econoJV been able to generate national aavinp, In 1971 they amounted to 5 t1f, of GNP and are expected to rise to nearly 50
'J,
of inveatae!l~ requirements by 1980.3.2. Principal Sectors of Production
3.2.1. !griculture
Nine out of ten Malawians depend directly on agriculture which accounts for
about 50% of GDP and absorbs probably
to
fo
of the active male population.In Malawi it is estimated that over half (about 56 ~) of the land area ia suitable
for cultivation ; of this, as yet only about one third is actually exploited, which gina an idea of the great potential still to be realized, particularly in the North of the
country. The Central and Southern Regions account for some 90
fo
of the cultivated areaof which nearly all (between 8 and 9 tenths) is under ouatomary tenure - mainly llixed
cropping of maise, pulses, millet, sorghum, groundnuts, cassava, potatoes, aa well aa
rice, cotton, and fire-cured, sun/air cured, and oriental varieties of tobacco. The rest of the cultivated land is in specialized estates, originally maintained
exclusi-vely by European settlers, and these grow principal export crops only : tea, burley aDd
flue-cured tobacco, and tung oil.
In agriculture as a whole, a very significant proportion (about 67 fo in 1971) of total production remains within the so-called •subsistence" aeotor - although the
relative importance of this sector is in rapid decline (see Table 11 above) - and
is either consumed directly or traded locally. Thus the commodities sold to the
Agricultural Development and Marketing Corporation (ADMARC, ex-Faraers' Marketing
Board) which absorbs all estate production but a varying quantity of the total produc-tion of the respective commodities grown on amallholdings ; these latter amounts are
therefore somewhat difficult to know with any degree of exactitude.
Table 12 below outlines the relative importance of Malawi. 'a main produce in
TABLE
12 -
Principal Crops : Land Coverase in HectaresCrop
Mixed Cropping : Maize Pulses
Millet, Sorghum Qroundnuta
Cassava Potatoes
Single Cropping : Tobacco : sun/air-oured fire-cured oriental flue-cured • burley • Total
Seed cotton
Tea •
• principally estate crops
Area in '000 Hectares
1,100.0.
850.0
500.0
450.0
280.0
160.0
4.3
26.7
o.1
2.2
3.1
36.4
45-5
14.5
VIII/837{73)-1
(other important crops for which figures are not available are sugar, rice, tllllC oil ., dark-fired tobacco)
Source :
N.s.o.
The chief food crop ia maize, grown on the largest land area (78
f,
of the total in1968),
and of which only a rather small proportion enters the monetar,ysector-leas than 5
%
of total production~ bought by ADMA.RC in the year 1968-69. :Jearly all maize is thus conawaed directly or processed into traditional beer, but in certai~years production yields a s~gniticant export surplus (see Table 13 below).
Customar.y land crops sold in significant quantities to ADMARC are dark-tired tobacco (mainly grown in the Northern Region), groundnuts, a.nd cotton, and the greater part of production of these crops ia destined tor the export aarket.
Some idea of the evolution in the production of the principal crops can be
gathered from the following table, setti~ out figures of marketed production :
[image:30.564.60.441.99.412.2]c
CO TON~~
G ARACHIDEp POMME DE TERRE
CHITIP~ ~ R RIZ
G Cf
s
SESAME
"
~
TT Tbw
TABAC TURC TABAC BLE~®
em
CULTURES PERENNE:S Ct CAFE
Rb CAOUTCHOUC
T THE
li1JIIIII[]
FORETS Ce CEDREEu EUCALYPTUS Pi PIN
ECHELLE
VIII/837(73)-E
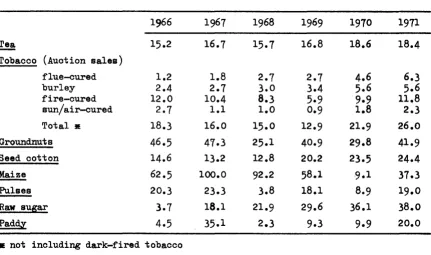
TABLE
13-
Marketed Production of Main Commodities,1966-71
('000 short tons)1966
1967
1968
1969
1970
19n
Tea
15.2
16.7
15.7
16.8
18.6
18.4
Tobacco (Auction sales)
flue-cured
1.2
1.8
2.7
2.7
4.6
6.3
burley
2.4
2.7
3.0
3.4
5.6
5.6
fire-cured
12.0
10.4
8.3
5·9
9-9
11.8
sun/air-cured
2.7
1.1
1.0
0.9
1.8
2.3
Total •
18.3
16.0
15.0
12.9
21.9
26.0
Groundnuts
46.5
41.3
25.1
40.9
29.8
41.9
Seed cotton
14.6
13.2
12.8
20.2
23.5
24.4
!!!.!.!.
62.5
100.0
92.2
58.1
·9·1
37.3
Pulses
20.3
23.3
3.8
18.1
8.9
19.0
Raw sugar
3.7
18.1
21.9
29.6
36.1
38.0
Paddy
4.5
35.1
2.3
9.3
9·9
20.0
• not including dark-fired tobacco
Source : ADMARC and Ministcy of Agriculture
In fact, as already mentioned, these figures are not (except in the case of sugar and tea) figures of total production, but refer uniquely to the monetary sector.
Thus the large variations that are apparent (see in particular maize) are not only due
to marked climatic variations (with bad seasons from
1966-68),
but also to fa~ers'reactions to price changes. ADMARC however does play a.n important role in attem.ping to keep prices steady and improve agricultural conditions in other ways.
Since their production is so closely tied to the export market, it is useful to
analyse the principal agricultural commodities' output trends in terms of exported
quantities. The relevant figures are reproduced in Table
14 (1).
(1) see also Table
25)
[image:32.564.62.493.110.365.2]TABLE 1~
-
Co~osition of AS!icultural Exportsbl
Main Commodities11264-11
(U.A. mn.)1964
1965
1966
1967
1968
1969
1970
1971
Smallholder CroEs Tobacco
1)
8.1
11.1
9.0
6.1
7.2
7.7
10.0
13.7
Ground.nuts
3.1
4.6
3.6
8.3
5.4
6.7
5.0
7.1
Cotto~)
2.8
3.1
3.1
1.7
1.6
2.0
3.4
3.0
Others
3.1
2.9
s.o
6.7
1.0
5.2
3.0
4.3
Total
17.1
21.7
20.7
22.8
21.2
21.6
21.4
28.1
Estate CrOES Tobacco
3)
3.6
3.4
3.6
4.0
5.4
7.4
9.8
12.5
Tea )
9.2
10.5
12.3
10.8
11.6
11.4
13.1
14.0
Others
4
o.8
9.8
0.8
o.8
0.4
0.5
0.5
0.4
Total
13.6
23.7
16.7
15.6
17.4
19.3
23.4
26.9
1)
dark-fired, fire-cured, sun/air-cured, oriental varieties~~
mainly maize, beans, peas, cassava, riceflue-cured and burley varieties
4)
tung oil, sugar, sisal Source :N.s.o.)
Tobacco : For a long time, Malawi's tobacco industry has been under the shadow
of the much bigger one in Rhodesia, but since
u.D.I.
it has made rema.rquable progl'ese.In fact, the embargo placed on Rhodesian tobacco after
1965
has given a considerablefillip to Malawian tobacco exports, particularly of the flue-cured variety ; the value
of estate tobacco exports as a whole increased by more than four times in terlllll of
Malawi currency from
1965
to1971,
consolidating the importance of tobacco as theprin-cipal source of foreign earnings. Malawi's future in tobacco remains good and less dependent on Rhodesia's export prospects. Malawi's flue-oured leaf has improved greatly
in quality and has now reached Rhodesia's pre~.D.I. level.
!!! :
Almost the whole of indigenous tea production is destined for the exportmarket ; expansion in output has been rather modest because of the persistence of an
excess supply on the world market, causing sharp price falls in recent years. But tea
remains the second most important export commodity and efforts are being made to improve
on quality, while production is being progressively extended to smallholdinga.
Groundnuts : Adverse weather conditions and disease depressed production after the
1967
peak, but exports have begun to catch on again to a large anticipated expansion in external demand for the confectionery variety, of which Malawi can be expected to meetabout
50
%
of world consumption.other crops that have shown rapid production expansion since
1968
are seed cotton,pulses, rice and sugar, of which the latter is to benefit considerably from a recent
[image:33.568.47.532.109.354.2]VIII/837(73)-E
15,000 tons annually from 1973 this could raise output to 60,000 tons by 1973. Sugar
yields are vary high in Malawi 15 tons per hectares of raw sugar. a ;year.
Livestock : There
are
only about 500,000 head of cattle out of a total livestockpopulation of some million and a half, but with per capita meat consumption at a low
level of less than 5 kg. a year (of which one third is beef), Malawi is able to satisfy nearly all of home demand. Annual livestock population increase baa been slightly
faster than the increase in the human population, but it will be necessary to raise this
rate of growth in order to meet future home consumption which can be expected to inoreaae
faster with the rise in personal inoom~s.
Fisheries : Table 15 shows a rapid increase in total landings since 1967.
TABLE 15 -Total Fish Landings, 1966-71 (short tons)
1968 1970 1971
Estimated landings 19,300 15,800 19,800 26,000 37,000 40,000
Source : Department of Fisheries
This increase has permitted Malawi, which consumes as mu.ch fish per head as all
other meats, to remain a net exporter. Trawling methods in Lake Malawi have greatly
contributed to this increase but further expansion is subject to the physical constraints
of existing waters, since Lake Malawi has a limited fish capacity (due to its depth),
and the other sources - which are at least as important - include Lake Chilwa which ia capable of dr,ying up as in 1967, and the Lower Shire whose fish population could be threatened by hydro-electric power development (see below, 3.2.3.).
Forestry : In 1970 the Forestry Department had some 14,000 hectares of softwood
timber plantations under its control. At present, the domestic market is unable to meet
the rapid increase in demand for wood for construction but it is planned to extend
plantations in order gradually to exclude the need for foreign timber which is being imported in substantial quantities. A pulpwood project at Vipya also provides for the
gradual elimination of imported paper and pulp from the 198<A1.
3.2 .2. Mining and Industry
3.2.2.1. Mining
Mining activity is limited to small-aeale.exploitation of limestone for cement
making, and of rare earth deposits for export. Exploration continues into the
possibi-lity of large bauxite deposits at Mlanje which, if proved, and vi th ample enough sources of electr]c power (e.g. from Cahora-Bassa) could be used for aluminium ameltinga.
Other current investigations are into monanzite deposits, and the possible existence of
copper, nickel, titanium, niobium and uranium.
3.2.2.2. Manufacturing
This is still a small sector, representing 12.5
%
of GDP in 1971 (see Table 10). However its growth since Independence has been rapid, if we exclude the cottage indus-tries : monetary manufacturing grew from about 6%
to about 10%
of total product theseven-year period 1964-71, i.e. by more than 200
%
in value terms (i.e. in KWacha). ·From 1964 to 1967, the number of enterprises with more than 20 employees progressed from
100 to 132, a.l though the increase bas been slower since then. Part of this brislcy' growth
i• due, of course, to Malawi's low starting point because of the ousto• union with
Rhodesia. (untill963) where most consumer goods industries were established and grew.
Its evolution has seen three phases. Before Independence, manufacturing consisted exclusively of processing agricultural products for export - mainly tea and tobacco.
Since 1965 the Government, mainly under the auspices of the Malawi Development Corporation
set up the previous year, has encouraged more consumer goods industries such as sugar
refining, food processing, and soap, cigarettes, soft drinks, beer, household utensil and
textile manufacturing, and transport equipment repair ; this second phase has been desicn•~
to substitute home-produced goods for imports. In a new phase, it is intended to promote
more consumer industries orientated specifically towards the export market, particularly
in food processing and textiles. other long-term possibilities for export promotion exist
in pulp and paper manufacture, and in bauxite exploitation, which were mentioned above
(3.2.1. and 3.2.2.1.).
The participation of the Government in industrial manufacturing development has t~en
various forms, including the raising of protective customs tariffs in return for
guaran-tees by the domestic industries concerned of price stability ; provision of initial and
recurrent investment allowances ; and the providing of suitably prepared industrial sites
for private enterprises. Financing of industrial expansion has come for the most part
from external private sources, which it has been the policy of the Government to encourage.
However the degree of local participation has been enhanced in recent years by the
activi-ties of the Malawi Development Corporation and the extension of the scope of such State
bodies as the Forest Industries Division, the Ministry of Agriculture and Natural
Resour-ces, and ADMARC.
3.2.2.3. Building and Construction
From 1964 to 1971 the value of buiding and construction as a whole more than
doubled, making this the second fastest growing sector after manufacturing ; in 1971 the
•ector accounted for about
4%
of GDP (see Table 10). Investment in this sector sinceVIII/837(73)-E
but from a low point in
1967,
it rose rapidly to a peak in1969 (6
~of GDP) as a resultof public spending on the Nacala rail link and the Zomba-Lilonpe road (see Table
16).
TABLE
16-
Value of Building Activity,1964-1971
(U.A. mn.)
Net Output : Building and Construction
Monetary Non-monetacy
Total
Private Contractors'
~
Ministry of Works Value of buildings completed :
Blantyre Lilongwe Cement Sales
( '000 tons)
6.4
4.0
10.4
5.9
4.3
3.6
0.2
44.1
1968
8.2
4.1
12.3
9.6
5.2
2.3
0.455.5
• estimate n.a. • not available
10.2
4.2
14.4
22.7
4.9
6.1
1.3
83.6
1970
10.1
4.3
14.4
20.2
5.3
1971
9.8.
4·9•
14.7•
17.0.
7.0
4.2
0.5
71.6
1972
n.a. n.a. n.a. n.a. n.a.5.1
0.1
81.1
Source : Economic Planning Division ; Monthly Statistical Bulletin
In real terms, the level of output has fallen back in two successive years since
1969,
but figures for the value of building plana passed in1972
for Blantyre and the n . . capital at Lilongwe indicate that a new increase in real output can be anticipated in thenear future.
The inadequacy of domestic cement output (despite a rapid rise in recent years), and the lack of skilled domestic manpower will mean that the future expansion in
cona-truction will have to continue to rely in large part on forei~aaed private contractors; the consequent repatriation of substantial proportion of construction earnings will
necessarily imply a low rate of domestic value-added return in this sector.
3.2.3.
Energy3.2.3.1.
ElectricityTotal sales by the Electricity Supply Commission of Malawi (ESCOM) of electrio
power have increased from
77.4
million KWH. in1967
to132.4
million KWH. in1971,
anincrease of more than
70
%
in four years : [image:36.568.47.442.147.443.2]TABLE
17-
Sales of Electricity Units by ESCOM (KWH mn.)Year Domestic Tariff Industrial, Commercial Total
1967
15.8
61.6
77.4
1968
18.4
75.5
93.9
1969
20.7
85.0
105.7
1970
23.2
98.7
121.9
1971
25.2
107.2
132.4
Source ESC OM
At present total output is about
36
MW, of which24
MW comes from the singlehydro-electric source at Nkala Falls (of which the second stage was opened in
1966).
Futureexpansion will rely on extension of hydro-electric power with the opening of a second
scheme in
1973
at Tedzani Falls. This will have an initail capacity of 16 MW, to beextended to
48
MW in two successive phases by1980.
Only in early1972
was the NationalGrid extended outside the Southern Region to link Lilongwe with Nkala Falls, but further
extensions of the Grid are planned in the near future.
With the initial surge of industrial growth among new enterprises over, the biggest
future additions to demand are expected to come from the Vipya pulp and paper scheme and
exploitation of the Mlanje bauxite deposits ; in the long term, further extension of
hydro-electric capacity on the Shire river is foreseen, as well as the possible
importa-tion of electrical power from the Cahora-Bassa scheme on the Zambezi.
Rural water supplies are mainly provided by boreholes, of which there has been
a large increase in recent years. Lilongwe is also adequately supplied from the Karmsu
Dam, opened in
1968,
which will have sufficient spare capacity until about1980.
Howeve:x-Blantyre, at
1000
metres, presents more of a problem since about80%
of its needs must bepumped up from Walker's Ferry,
35
kms. away on the Shire river, and its demand is expected to increase by about10%
each year. Further additions to existing pumping facilities onthe Shire river are therefore planned in order to increase the rate of flow through the
existing pipeline which still has a lot of spare capacity.
3.3.
Money and Finance3.3.1.
Banking and the Monetary SystemFrom the Bank of Rhodesia and Nyasaland. emerged the Bank of Malawi which was set
up in
1964
and which began its own note issue in the same year. The Xalawian pound stoodat par with the British pound until February
1971
when the currency unit changed its name [image:37.564.56.395.96.255.2]VIII/837(73)-E
Its present official rate of exchange to the unit of account (= to the pre-devaluation
u.s.
dollar) is of 1 K=
1,087 U.A. (1).The two commercial banks operating in Malawi - Barclays Bank D.c.o. and the Standard
Bank - were joined in 1970 by the Commercial Bank of Malawi owned by a major Portuguese
Bank and the Malawi Development Corporation. Other financial institutions are the Post
Office Saving Bank, New Building Society, and National Insurance Company.
From 1966, the total money supply has grown roughly in parallel with the growth of
GDP (see Table 18) and in 1971 it was abo~t 21% of monetary GDP. Total domestic credit
accelerated sharply again in 1971 after a very small rise in 1970 accounted for by the poor
crop season of that year ; however credit to the private sector has shown a very steady
increase throughout this period, growing generally faster than credit to the public sector.
TABLE
18
-Changes in Money Supply, 1966-1971(U.A.
mn.)
(1)
Sources
1. Supply of Money
2. Quasi-Money (2)
3. Total (1 + 2)
%
increase (year-on) Uses4. Total Domestic Credit
%
increase {year-on) 5. Total Foreign Assets%
increase (year-on) 6. Total (4 + 5)1966 26.0 9.4
22.9
+35.8 14.4 -17.0 37.3 29.5 12.9 31.1 +3.6 12.0 +9.8 43.1 1968 30.1 15.6 45.7 +9.3 32.2 +14.7 13.1+6.3
45.334.2
15.9
50.1 +15.4 37.0+2.3
13.9 +59-5 50.9 1970 39.318.5
57.8 +19.9 37.8 +30.8 22.2 +10.9 60.0 1971 46.5 22.7 49-5 24.6 74.1(1) For all years, the pre-1972 rate of conversion of K 1.0 = 1.2 U.A. was used
(2) Time and Savings deposits of commercial banks, P.O.S.B. and Reserve Bank, except government and bankers' deposits
Source : Reserve Bank of Malawi
As to price indices, are of course strongly weighted by food items {especially the
"Low Income Index") and variations tend to follow the seasons through the year (see
table 19).
(1) The Malawi Kwacha does at present fluctuate with the Pound Sterling (June 1973)
[image:38.562.36.488.325.627.2]