promoting access to White Rose research papers
White Rose Research Online eprints@whiterose.ac.uk
Universities of Leeds, Sheffield and York
http://eprints.whiterose.ac.uk/
This is the author’s version of an article published in Bioresource Technology
White Rose Research Online URL for this paper:
http://eprints.whiterose.ac.uk/id/eprint/75971
Published article:
Pimenidou, P, Rickett, G, Dupont, V and Twigg, MV (2010) High purity H2 by sorption-enhanced chemical looping reforming of waste cooking oil in a packed bed reactor. Bioresource Technology, 101 (23). 9279 - 9286. ISSN 0960-8524
1
High purity H
2by sorption-enhanced chemical looping reforming of waste
cooking oil in a packed bed reactor
P. Pimenidou1, G. Rickett1, V. Dupont1*, M. V. Twigg2 1
Energy and Resources Research Institute, SPEME, The University of Leeds, Leeds LS2 9JT, UK 2Johnson Matthey Plc, Orchard Laboratory, Orchard Road, Royston, SG8 5HE, UK
Corresponding author: V.Dupont@leeds.ac.uk
Paper accepted and published. Full reference:
Pimenidou, P., Rickett, G. L., Dupont, V, Twigg, M. V. 2010. High purity hydrogen by sorption enhanced chemical looping reforming of waste cooking oil in a packed bed reactor. Bioresource Technology 101 (2010) 9279–9286.
Abstract
High purity hydrogen (>95%) was produced at 600 °C and 1 atm by steam reforming of waste cooking oil at a molar steam to carbon ratio of 4 using chemical looping, a process that features redox cycles of a Ni catalyst with the in-situ carbonation / calcination of a CO2-sorbent
(dolomite) in a packed bed reactor under alternated feedstreams of fuel-steam and air. The fuel and steam conversion were higher with the sorbent present than without it. Initially, the dolomite carbonation was very efficient (100 %), and 98 % purity hydrogen was produced, but the
carbonation decreased to around 56% with a purity of 95% respectively in the following cycles. Reduction of the nickel catalyst occurred alongside steam reforming, water gas shift and
carbonation, with H2 produced continuously under fuel-steam feeds. Catalyst and CO2-sorbent
regeneration was observed, and long periods of autothermal operation within each cycle were demonstrated.
2
Introduction
The process of chemical looping has been the focus of growing attention in the past decade as a means of large scale power generation minimising CO2 emissions, by either producing a
sequestration-ready CO2 effluent (chemical looping combustion) or decarbonising the fuel
(chemical looping reforming). The production of hydrogen of high purity using process
intensification measures such as chemical looping is desirable in chemical plants and petroleum refineries, as well as upstream of a fuel cell to alleviate the energy burden placed on gas
separation and purification. Suitable feedstocks for steam reforming and steam gasification can be found in many commercial and industrial waste streams of biomass origins. These would typically have significant moisture content, such as the crude glycerol by-product of the
transesterification of vegetable oils (Dou et al, 2009), and other 2nd/3rd generation biofuels such as biomass pyrolysis oils, or micro algae suspensions. Used vegetable cooking oils exhibit a higher free fatty acid content, viscosity and polarity than the virgin oils, which makes their conversion to the fatty acid methyl esters of the biodiesel blend difficult. In the present study, waste cooking vegetable oil is converted to a nearly pure hydrogen gas separate from the CO2
waste stream, using an advanced steam reforming process. The latter combines the chemical looping of a Ni-based catalyst as oxygen transfer material (OTM) and of a natural CO2 sorbent
(dolomite), in a packed bed reactor. It has been shown in a previous publication that the Ni in the catalyst could repeatedly reduce and oxidise during the chemical looping reforming of waste cooking vegetable oil (WCO) in the absence of a CO2 sorbent (Pimenidou et al, in press). The
present work focuses on the ability of the CO2 sorbent to repeatedly carbonate while generating a
pure H2 gas under the fuel/steam feed, and to regenerate to its calcined oxide form under the air
3
carry out a number of cycles with high H2 purity syngas production while attempting to operate
as close to autothermal as possible, that is, with little or any heat being supplied to the reactor.
2 Materials and Methods
2.1 Materials
The OTM catalyst consisted of 18 wt % NiO supported on Al2O3 from Johnson Matthey,
originally supplied in pellet form, broken up and sieved to 0.85-2 mm size particles. The CO2
sorbent was pre-calcined dolomite from the Warmsworth quarry (South Yorkshire, England) broken up and sieved to the same size as the catalyst. 40g of fresh catalyst, with or without intimate mixing with 40 g of the calcined CO2 sorbent, were loaded at the centre of the reactor,
preceded by 25 mm thick plug of spherical Al2O3 beads. The as-received dolomite was fully
carbonated and had a composition of 21.3 wt% MgO, 30.7 wt% CaO, 0.3 wt% SiO2, 0.27 wt%
Fe2O3, and 0.1 wt% Al2O3, and 47.33 wt% CO2.
The waste cooking vegetable oil (WCO) contained 74.9 wt% C, 12.85 wt% H, 12.15 wt% O and 0.10 wt% N, had a liquid density of 920 kg m-3 at 20 °C and a gross calorific value of 39.5 MJ kg-1. Based on its elemental mass formula, its average elemental molar formula was
C1H2.04O0.122. Details of the analytical techniques used for the oil characterisation can be found in
Pimenidou et al, 2010. The molar formula was equivalent to 3(CH1.67 + C18H37.1O2.31), where
‘CH1.67’ represents the portion of non-oxygenated glycerol ‘backbone’ molecule per fatty acid
chain, and where the ‘C18’ fatty acid chain is chosen here to reflect on the WCO’s origin as
4
2.2Reactor set-up and experimental procedure
A detailed description of the reactor set up, including a diagram, is given in Pimenidou et al (2010). To summarise, a stainless steel temperature controlled and kaowool insulated reactor of ID 2.05 cm and 26.9 cm length, providing 89 cm3 volume containing the bed materials (40 g of 18wt%NiO/Al2O3 catalyst with or without 40 g calcined dolomite), was fed from the bottom via
a co-axial injector with steam in the inner pipe, preheated to 150 °C and near-vapourised WCO in the annular space at 300 °C. When not using the CO2-sorbent, the experiments were carried
out both manually diluted with Al2O3 beads (Dbeads ≈1.5 mm) to achieve the same reactor bed
volume as when using the sorbent, and undiluted, thereby achieving roughly half the bed volume than when using the CO2 sorbent. As the observed reactant conversions were very poor and
accompanied by excessive carbon deposition when using the Al2O3 beads dilution, subsequent
experiments were carried out without it. Peristaltic pumps maintained the liquid flows of WCO and water at 0.55 and 2.32 cm3 min-1 (20 °C) respectively, achieving a molar steam to carbon ratio of 4. The steam to carbon ratio of 4 provided a better operation than 2.5 in the absence of CO2 sorbent (Pimenidou et al, 2010) and thus was chosen for the present study. A gas flow of
600 cm3 min-1 (STP) of N2 was employed during the fuel/steam feed and the N2 purge period
separating the fuel/steam feed from the air feed, as in the chemical looping experiments without sorbent reported in Pimenidou et al (2010). The air flow rate was also 2000 cm3 min-1 (STP) during the air feed. The reactor effluent passed through two condensers and water traps prior to online analysis every 5 seconds of CO, CO2 and CH4 by non-dispersive infra-red absorption, H2
by thermal conductivity detection and O2 via paramagnetic analysis, using Uras 14, Caldos 15
5
(Pimenidou et al, 2010), and therefore the dry gases were also assumed here to contain N2 molar
fractions corresponding to the balance to 1 of the sum of the CO, CO2, CH4, H2 and O2 measured
mol fractions.
The procedure followed to pre-reduce the catalyst to initiate the cycling experiments is described in detail in Pimenidou et al, 2010. In the present work, the reactor temperature was set at 600 °C for all the experiments under both fuel-steam and air feeds. Three thermocouples placed in the middle of the reactor bed, above and below the middle, measured the temperatures at 1 second intervals, allowing the monitoring of the endotherms and exotherms resulting from the reactions during both feeds.
2.3 Reactions and output calculations
The reaction mechanism under each type of feed is outlined in the first two sub-sections, followed by the energetic of the process under the two feeds and a description of the equations used to derive the process outputs. A nomenclature is provided in the appendix.
2.3.1 Reaction mechanism under fuel/steam/N2 feed (reducing mode):
An oxygenated hydrocarbon fuel with a molar elemental formula of CnHmOk, reduces the oxidised catalyst via the unmixed combustion reaction henceforth termed ‘UC’ (Dupont et al, 2007), producing CO2 and H2O as by-products. While NiO undergoes reduction, significant
coking may occur from the thermal decomposition of the fuel and of its pyrolysis products. The maximum reduction rate of NiO is therefore (2n+0.5m-k) mol per mol of CnHmOk fuel converted. This emphasises the relative positive contributions of both the C and H fuel-contents to the NiO reduction rate, in contrast to the negative contribution of the O fuel-content. Once Ni is
6
Both the UC and SR/WGS reactions are then followed by the carbonation (‘Carb’) of the calcined sorbent. When using dolomite as the sorbent, this is a chemisorption reaction, where only Ca, and not Mg, acts as the active site for the carbonation.
According to Le Chatelier’s principle, by shifting the equilibria the CO2-producing reactions UC
and WGS to the right, the carbonation of the Ca-based sorbent allows not only the elimination of CO2 from the gases, promoting UC, but also a decrease in the amount of CO produced, thereby
further promoting SR. This results in an increased fuel conversion, a process termed ‘sorption enhancement’. Once SR and WGS are established, a nearly pure H2 gas evolves, eliminating the
need for the downstream high- and low- temperature water gas shift reactors required by a conventional steam reforming process. Thus sorption enhancement represents a process
intensification measure. The production of the by-products methane and carbonaceous deposits during this feed would be accompanied by a lower H2 yield, here defined by the molar ratio of
H2 produced to the theoretical maximum mol of H2 from the complete SR and WGS reactions.
Assuming complete reactions SR and WGS in the absence of UC, and notwithstanding
thermodynamic limitations (mainly due to reverse-WGS), the maximum hydrogen purity can be calculated as:
H2 max purity = 74.3%for the WCO.
) 2 / (
) 2 / (
100
k m n n n
n k m n
With a carbonation reaction achieving complete removal of CO2, and ignoring thermodynamic
limitations, the maximum H2 purity becomes 100 %. The maximum production of H2 obtainable
from sorption enhanced steam reforming the WCO, again disregarding thermodynamic limitations, is therefore 2.90 mol H2 /mol of C in the fuel-feed.
7
Upon switching to air feed, the carbon deposits burn via full or partial oxidation (Ox’ and ‘C-POx’) depending on the reactor bed temperature, magnitude of the air flow and the oxidation reactions being or not mass transfer limited. The Ni on the catalyst support then consumes oxygen via Ni oxidation to NiO (‘Ni-Ox’).
In the presence of a carbonated sorbent, the higher temperatures reached during the air feed allow the sorbent to regenerate through decarbonation, also called calcination, henceforth termed ‘Calc’.
2.3.3 Energetics under the two feeds
In the described mechanism, the UC, SR and Calc reactions are endothermic, while WGS, Carb, C-Ox, C-POx, and Ni-Ox exothermic. Of the latter, C-Ox and C-POx are more likely to occur on the outer surface of the reactor bed particles, where carbon filaments may form, where they generate a heat that may be easily swept away by the gas flows. In contrast, the Ni-Ox and Carb reactions are highly exothermic reactions which take place deeper within the particles of catalyst and sorbent respectively. Despite the ability of the sorption enhanced chemical looping
reforming process to cope with coking fuels by cyclically oxidising the carbon deposits (unlike conventional catalytic steam reforming), it remains desirable to prevent coke deposition from the point of view of both optimising heat transfer and achieving a maximum H2 yield. Without
carbon deposition, the heat transfer would be expected to move deeper in the reactor bed and allow better coupling of the oxidation of nickel with the strongly endothermic calcination (regeneration) of the sorbent.
8
While carbonation occurred, the output gas did not contain CO2, and we shall see in the results
section, that CO and CH4 concentrations were also negligible. With more time on stream, the
sorbent began to saturate, corresponding to a CO2-breakthrough period. Finally, the sorbent
reached its maximum sorption capacity for the conditions of the experiment, and a ‘CO2-steady
state’ was established, similarly to the one that occurred in the absence of sorbent (Pimenidou et al, 2010). We are mindful of not calling this regime a full steady-state as transient reactions involving NiO reduction or carbon deposition may still be occurring.
- Fuel conversion fraction during the fuel/steam/N2 feed:
Direct calculations of the fuel conversion during CO2 sorption via the carbon balance were not
possible due to the inability to measure the carbonation rate ‘nCO2,carb’ on the solid sorbent at any
given time prior to, or during CO2 breakthrough. However, assuming the expected effect of
sorption enhancement, caused by the coupling of UC with Carb, or (SR+WGS) with Carb, a minimum fuel conversion fraction ‘XWCO,PB’ during carbonation prior to- and during CO2
-breakthrough could be estimated by approximating it to the conversion reached at the CO2
-steady state (post-CO2 breakthrough):
in WCO CO CO CH SS N in N in WCO out WCO in WCO SS WCO BT WCO PB WCO n n y y y y n n n n X X X , , , , , , , , , 2 4 2 2 SS Eq.1Where the suffix ‘PB’ stands for ‘prior to CO2 breakthrough or pre-CO2 breakthrough’, ‘BT’
means ‘during CO2-breakthrough’, and ‘SS’ is ‘at CO2-steady state, post CO2-breakthrough’. In
Eq. 1 and the following equations, the n symbol is used to represent a molar rate, and y, a mol fraction, while the constants n, m and k represent the elemental molar composition of the WCO fuel (CnHmOk).
9
Using the value of XWCO,PB derived with Eq. 1, as well as the knowledge of the molar production rates of the carbon containing co-products CO and CH4, an estimate of the total molar production
rate of CO2 and thus of carbonation rate (nCO2,carb ) could be obtained via Eq. 2 below:
CO CH CO
PBBTBT PB N in N in WCO BT PB WCO carb
CO y y y
y n n nX n , , , , , , ,
, 4 2
2 2
2
Eq. 2
In the RHS of Eq. 2, the first, positive term represents the molar rate of carbon converted from the fuel, and the second, negative term, the molar evolution rates of the gaseous
carbon-containing products.
Prior to CO2-breakthrough, since none of the carbon containing products were detected, as will
be seen in the results section, the negative term in Eq. 2 was negligible, and nCO,carb 2
was able to
simplify to the first positive term only. During CO2-breakthrough, the second negative term was
significant and accounted for the simultaneous emergence of CO2, CO and CH4 in the output gas
stream.
Equation 3 gives the total carbonation efficiency as the sum of the carbonation efficiencies prior to and after CO2 breakthrough, obtained by integration of the carbonation rates over the
characteristic durations of pre-CO2 breakthrough and CO2 breakthrough regimes.
max , , , 0 , , 2 2 100 CO tt CO carbBT BT in WCO PB WCO BT PB n dt n t t n nX SS BT
Eq.3In Eq. 3, t0 is defined as the time at breakthrough of H2 , taken as evidence of onset of sorption
enhanced steam reforming, tBT was the time at breakthrough of CO2, when the sorbent began to
reach its capacity, and tSS, was the time at reaching CO2 steady state, evidencing the sorbent
10
It was of interest to split the total carbonation efficiency ‘’ during fuel and steam feed into its pre-breakthrough (PB) and breakthrough contributions (BT ) because for the former, H2 purity
was close to 100%, while for the latter, the H2 purity slowly decreased to the steady state of the
non-sorption enhanced process (ca. 70%). For some applications such as proton exchange
membrane fuel cells (PEMFC), which are very sensitive to H2 purity, maximising the duration of
the pre-CO2 breakthrough period is desirable, whereas for solid oxide fuel cells (SOFC) or
molten carbonate fuel cells (MCFC), more tolerant of other syngas compounds, H2 purity may
not be so critical.
The carbonation efficiency values were calculated for each performed cycle to assess the sorbent performance over repeated sorption enhanced chemical looping reforming cycles of the waste cooking oil.
- Steam conversion fraction during the fuel/steam/N2 feed:
In the steam reforming coupled with water gas shift, the production of hydrogen is the result of the contributions of the fuel-hydrogen and of the steam-hydrogen. Generally, for a ‘CnHmOk’ oxygenated fuel reacting with (2n-k) H2O via SR/WGS, the maximum production of H2 is ((2n
-k)+0.5m), indicating clearly that in conditions of maximum H2 production, the steam
contribution fraction is (2n-k)/(2n-k+0.5m) and that of the fuel, 0.5m/(2n-k+0.5m). For the C1H2.04O0.122 waste cooking oil, the steam contribution can therefore account for 64.9% of the H2
produced through SR/WGS, while that of the fuel is only 35.1%. Therefore steam conversions, which are rarely reported in the literature on steam reforming, have a great effect on the material efficiency of the process. Factors limiting the steam conversion are not only equilibrium
limitations, which the presence of the CO2-sorbent intend to overcome, but also the catalyst’s
11
Using the fuel conversion fraction from Eq.2 and an elemental balance on hydrogen, a minimum value for the steam conversion fraction can be estimated using Eq. 4 below:
WCOin WCOSS
SS H CH SS N in N in O H SS O H BT O H PB O
H y y mn X
y n n
X X
X , ,
, ,
, ,
,
, 4 2
2 2
2 2
2
2 4 2
2 1 Eq. 4 The first, positive term in the RHS of Eq. 4 represents the formation of the hydrogen containing products and the second, negative term accounts for the known contribution of the fuel to the hydrogen products, leaving only the contribution of water to the same.
- Selectivity of the carbon-containing products in the gas phase during the fuel-steam feed: These were defined as:
2 4 2 4 2 4 CO or CO or CH CO or CO or
CH
(%)
100
CO CO
CH
y
y
y
y
Sel
Eq.5- NiO molar reduction rate and extent of NiO reduction during fuel-steam feed:
From an elemental balance of oxygen, it is possible to also estimate a constant rate of NiO
reduction during carbonation, and thus establish whether reduction of the catalyst (UC) may have been concurrent with steam reforming (SR) and carbonation (Carb). This is expressed in Eq. 6:
CO CO
PB CO carb
H Oin H OPB
WCOin WCOPB
PBdry out PB Ni
NiO n y y n n X k n X
n , , , 2 2 2, 2 , 2 , , ,
2
Eq.6 Where the values of XWCO, PB, nCO2,carb and XH2O,PB, were pre-determined by Eqs. 1, 2 and 4.
In the RHS of Eq. 6, the first, positive term represents the molar rate of O leaving the reactor as gaseous products (no O2 is produced under these reducing conditions), the second positive term
12
However, in the pre-breakthrough regime, where H2 was the only dry gas product detected, Eq. 6
was able to simplify to Eq. 7 below:
SS H in N H SS WCO in WCO PB Ni NiO y n y k m n X n n SS , , , , , 2 2 , 2 1 5 . 0 2 Eq. 7
The equation above reflected that the NiO reduction rate prior to CO2 breakthrough, i.e. when H2
was the only gas product, was equal to the maximum rate of reduction arising from fuel
conversion (nWCO,inXWCO,SS
2n0.5mk
) through the unmixed combustion reaction, minus themolar rate of hydrogen evolving from the process. This is because one mol of H2 could
potentially have reduced an additional mol of NiO to Ni by forming water. It has to be stressed that Eq. 7 is not expected to provide an accurate value of the reduction rate of NiO at any given time prior to CO2 breakthrough, but is a time-averaged estimate, as any transient effect that the
rate may have undergone, e.g. early peak followed by drop, would not be accounted for. The purpose of this equation was to merely help assess whether the NiO reduction via unmixed combustion was more likely to have occurred prior to, or concurrently to steam reforming, its fuel-consuming competitor, where the latter situation may be preferable due to allowing H2
production earlier in the process.
3. Results and discussion
3.1Process outputs duringWCO/steam/N2 feed
13
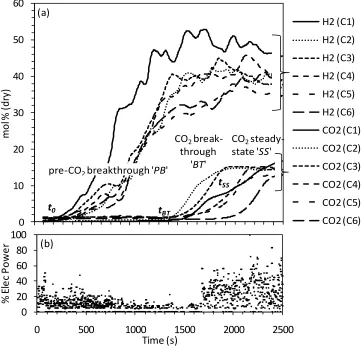
H2 and CO2 mol fractions measured during the WCO/steam/N2 feeds for 6 cycles
conducted in the presence of the CO2-sorbent dolomite are shown in Fig.1(a), with Fig. 1(b)
showing the electrical power input to the reformer in % of the maximum.
There was a long period in Fig. 1b where the power input to the reformer was automatically cut off, corresponding to a visible lack of CO2 in the products in Fig. 1a, as the heat produced in the
reactor from the carbonation reaction caused the temperature to exceed the set point of 600 °C. In the case of the first cycle, this period lasted 700 seconds. This illustrated the increased energy efficiency of the sorption enhanced chemical looping reforming process over that of the
conventional steam reforming process.
The H2 % purity, defined here as the % dry mol fraction ratio of H2 to the sum of the H2, CO,
CO2 and CH4, i.e. the H2 mol % corrected for 0 N2, is plotted with time on stream for the six
cycles in Fig. 2, focusing mainly on the pre-CO2 breakthrough period. Figures 1a and 2 indicated
that all the cycles exhibited a period of time where the only significant gas species in the reactor products was hydrogen, these corresponded to purities above 90% between 800 and 1400 s for all the cycles, and 97% purity reached for cycles 1 and 6 for more than 700 s. Therefore, as expected from sorption enhancement, during this period the effect of the sorbent was to, not only fully chemisorb CO2, but also to cause nearly complete conversion of CO and CH4, virtually
eliminating them from the syngas. The following section assesses the efficiency of the process via the fuel and steam conversion fractions, selectivity of the carbon containing products, and H2
purity in post CO2-breakthrough conditions (steady state ‘SS’), listed in Table 1. Note that the H2
14
of pre-CO2 breakthrough. These outputs are compared to the corresponding process for the same
conditions in the absence of CO2 sorbent in the reactor (results of the study published in
Pimenidou et al, 2010). We have shown in Pimenidou et al (2010), that when operating with a mass of 80 g of the NiO-Al2O3 catalyst at the same feed flows as the present work, WCO
conversion fractions of average 0.9 and steam conversion fractions of 0.27 were recorded over 6 cycles. This contrasted with the results when using only 40 g of catalyst with the same feed rates, which only achieved WCO and steam conversion fractions of 0.2 and 0.06 respectively, also averaged over 6 cycles. Unfortunately the size of the reactor meant that more than 80 g of bed material could not be accommodated in the reactor. Therefore the present conditions of 40 g catalyst with 40 g calcined dolomite using the same feed rates were not expected to yield WCO and steam fractions exceeding 0.20 and 0.06 by significant amounts. Surprisingly, a comparison of the two conditions ‘40 g of catalyst’ vs. ‘40 g catalyst + 40 g dolomite’ in Table 1 shows that
the WCO and steam conversion fractions post-CO2 breakthrough were significantly larger in the
presence of the sorbent for the 6 cycles than without the sorbent, with average values of 0.31 and 0.12 respectively. This may have been caused by the catalytic cracking activity of dolomite, and its resistance to coking, as previously observed by Simell and Son-Bredenberg (1990), Myren et al (2002), Devi et al (2005) and Srinakruang et al (2006). The first cycle with the sorbent exhibited the highest reactant conversions, with WCO and steam conversion fractions of 0.46 and 0.19. From the 2nd cycle, the process outputs lowered to nearer the average and,
15
cycles. The highest conversions observed in the first cycle were accompanied by a mid-reactor temperature lower than the average by 15 °C, reflecting the endothermicity of SR in post-CO2
breakthrough conditions. The lower temperature in turn affected the selectivity of the carbon containing products, with higher CH4 and lower CO. As the cycles settled into a less performant
fuel conversion, the heat demand in the reactor decreased accordingly and the mid reactor temperature remained close to the set temperature of 600 °C.
The H2 purity during CO2-steady state (post-CO2 breakthrough) was, with an average of 70.7 %,
close to the theoretical maximum in absence of carbonation of 74.3% and notwithstanding thermodynamic limitations quoted in section 2.3.1. A more realistic comparison can be made by using thermodynamic equilibrium calculations following the methodology outlined in Pimenidou et al (2010), and previously applied to the reactor without sorbent, using the mid-reactor
temperature as input and assuming the typical rapeseed oil composition used in Pimenidou et al (2010). This new calculation yielded H2 purities between 69.4 % and 70.2%, with an average of
70.0% over the 6 cycles, in very good agreement with the measurements. The selectivity to CO, CO2 and CH4 products with time-on-stream in post-CO2 breakthrough conditions is listed in
Table 1. The high selectivity to CO2 between 78% and 89% indicated there must have been good
conditions for sorption enhancement of the chemical looping reforming during the preceding carbonation period. The values predicted by the equilibrium calculations were SelCO, eq=21-25%,
SelCO2,eq =70%, SelCH4,eq=5-8%, which would have been less propitious for CO2 sorption. This
16 3.1.2 Carbonation efficiency
Using the mass of calcined dolomite present in the reactor (40 g) and the known mass fraction of CaO in the fully carbonated sorbent (0.307), the maximum molar capacity for CO2 capture
max ,
2
CO
n was calculated to be 0.417 mol. The characteristic times t0, tBT and tSS are indicated in Fig.1 for the first cycle, representative of all the cycles. Table 2 lists the values of (tBT - t0), (tSS -
tBT),i.e. the durations prior to- and during CO2-breakthrough, and their carbonation efficiencies
PB, BT, with the total , for the six cycles carried out with the sorbent in the reactor using Eq.
3. Given the error-propagating nature of the calculation of the total carbonation efficiency via Eq. 3, it was remarkable that the obtained value for the first cycle, at 101%, was so near 100%. It was also expected from previous dolomite carbonation studies (Pimenidou et al, 2009), that the first cycle be able to fully carbonate the sorbent, as was the case here. The values in table 3 indicate that decreased sharply in the second cycle, but more or less stabilised for the remainder of the cycles to an average of 55.9 % over cycles from 2 to 6. Decreases of
carbonation efficiency upon repeated cycling were expected for calcined dolomite, which, as all un-pretreated natural CaO-based sorbents, would have exhibited poor chemical stability due to sintering (Harrison, 2008).
With regards to the pre-CO2 breakthrough carbonation efficiency PB, it exhibited the same trend as , with a maximum obtained in the initial cycle (74 %) followed by a sharp decline and stabilisation at around 42 % to the exception of cycle 5. In the observed absence of carbon containing products during pre-CO2 breakthrough, there were two main parameters that
contributed to the value of the pre-CO2 breakthrough carbonation efficiency PB : the WCO fractional conversion XWCO, which determined the rate of CO2 production and thus controlled
17
carbonation was integrated. Table 2 indicates that the low value of PB obtained in cycle 5 (17.3%) was not due to (tBT - t0), which itself was of similar duration as cycles 3 and 4, but to the lower fraction of fuel conversion (0.23), the lowest of the 6 cycles. This suggests not a limitation of the carbonation process but a momentary abnormality in the activity of reactions UC, SR and WGS. Accordingly, this low pre-CO2 breakthrough carbonation efficiency was later
compensated by a longer CO2-breakthrough period, yielding a total efficiency close to those of
the post-initial cycles. It is difficult to find a reason for the lower WCO conversion obtained at cycle 5, as the experiments without sorbent did not exhibit this anomalous dip in conversion, and the cyclic experiments were carried out without interruption.
Sustaining the relatively high level of carbonation for six cycles is a strong indicator that regeneration of the sorbent must have occurred to a significant extent via the exotherms
generated during the air feed steps introduced between each WCO/steam/N2 feeds, which will be
verified qualitatively in the ‘air feed’ section of the results. 3.1.3 NiO reduction
Table 3 lists the pre-CO2 breakthrough values of the NiO reduction rate nNiONi,PB per cycle
using Eq. 7, derived from the elemental balance of oxygen, alongside the fuel conversion
fraction. One would expect the two parameters to follow the same trend since the H2 mol fraction
reached at CO2-steady state, yH2,SS, varied little over the six cycles, and the remaining terms in Eq. 7 were input values that remained constant for all the cycles. Nevertheless, the term
H SS
H
y y
S S
,
2 ,
2
1 1
in Eq. 7 exacerbated the small variations in yH2,SS and was responsible for the
18
moles produced (nNi), a ‘time to final reduction’ (tFR) could be obtained, where
Ni NiO Ni FR n n t .
For all the cycles, tFR was found to be either well within the pre-breakthrough period (cycles 2, 5 and 6) or to coincide with breakthrough (cycles 3 and 4). Recall that the first cycle started from a H2-reduced catalyst and thus Eq. 7 would only apply to the following cycles. On this basis, the
processes of steam reforming, carbonation and reduction of NiO to Ni would appear to have occurred alongside one another. It is noteworthy that when comparing the contributions of the two fuel consuming reactions (reduction of NiO via UC) and SR (steam reforming) to the total fuel conversion, the steam reforming was dominant across the cycles 2-6. This is illustrated in Table 3 by the % ratio ‘Rred’ of the estimated NiO reduction rate per cycle in pre-breakthrough to the maximum possible reduction rate for the same cycle via UC, defined by Eq. 8 below:
k m n X n n R SS WCO in WCO PB Ni NiO red 5 . 0 2 100 , , , Eq. 8where this maximum reduction rate is reached in the absence of steam reforming. The results in Table 3 indicate that, since Rred remained between 10 and 20 % for all the relevant cycles (2-6), most of the fuel conversion would have resulted from steam reforming. This was shown to be also the case in the study without sorbent. A possible uncertainty about the % reduction state of the bed in the initial stages of the fuel feed may arise from the fact that there was an initial time
t0 between the start of the mixture feed and the first detection of H2 by the online thermal
19
condensed in the water trap, resulting in no dry gas products being detected, in this aspect making it indistinct from a non-reactive period. The 40 g of the catalyst, corresponding to 9.64×10⁻² mol of Ni, would have fully reduced in only 63 s if a full conversion of the WCO had occurred via UC. In the absence of an accurate way of monitoring the onset of build up of water condensate, it was not possible to differentiate between non-reactive and potentially reactive periods ‘pre-t0’ due to the presence of the sorbent. To circumvent this uncertainty, we use the outputs of the experiments carried out without the sorbent to assess whether an initial reactive ‘reducing-only’ period was likely to have occurred. In the absence of sorbent, if the reduction reaction UC had initially occurred on its own, CO2 would have been detected in significant
concentrations well before H2. For instance, this was observed in a previous study using methane
as the fuel (Dupont et al, 2008). A fuel conversion would then be derived from the rate of evolution of CO2. In addition, the hydrogen elemental balance would also yield a significant
negative steam conversion, as water would have been produced by UC, (rather than consumed by SR and WGS). Further, a peak in the NiO reduction rate would result from the elemental O balance. All of these were observed in Dupont et al (2008) when using methane as the fuel in chemical looping reforming conditions. However, it was clear from observing the outputs of the experiments with 40 g of catalyst without sorbent, that none of these manifestations had occurred with the present experiments with the WCO fuel. This is shown in Figs. 3a-b, which display the dry syngas mol fractions and the water conversion fraction for cycle 4 without sorbent, as a representative of typical ‘no-sorbent’ cycle behaviour. Figure 3a shows a CO2 profile that started
slightly earlier than the H2 profile but not in significant amount, which then translated into a
20
Thus in the presence of the sorbent, a reducing-only initial period would most likely have been briefly present but with expected very small activity even if sorption enhanced by Carb, and the reduction of the NiO would have been gradual, occurring alongside the steam reforming and carbonation reactions. This then further reinforced the assumptions made earlier to derive Eq. 7 and the integration of the NiO reduction rate from time t0 and not before. This finding is
significant, as, had the reducing reaction occurred prior to the steam reforming/water gas shift reactions, the production of pure hydrogen would have been delayed. Upon up-scaling of the process, this would cause exaggerated intermittency in the production of H2. The combination of
the WCO fuel with the sorption enhanced chemical looping reforming process using this Ni-Al2O3 catalyst was therefore a beneficial one, as the Ni catalyst did not seem to require full
reduction nor full fuel conversion prior to becoming active in hydrogen production by steam reforming and water gas shift.
3.2Process outputs during air feed
During the air feed, four main reactions were susceptible to occur: the two carbon oxidation reactions (C-Ox and C-POx), the nickel oxidation reaction (Ni-Ox) and the calcination of the sorbent (Calc). Both C-Ox and Calc would have generated CO2, while the three reactions
C-Ox,C-POx and Ni-Ox consumed oxygen, therefore the carbon and oxygen elemental balances were not sufficient to determine the three unknown rates of Ni oxidation, carbon oxidation, and sorbent calcination. Thus a qualitative discussion is carried out in the following section. Figure 4(a) plots the rates of evolution of CO2 and CO with time-on-stream during the air feed of the
21
with O2 concentration in the products recovering from a low mol fraction to ca. 21% of the air
feed (not shown). A period of flushing of the products from the previous feeds was observed for the initial 200 s, as was observed and discussed in the experiments carried out without the sorbent (Pimenidou et al, 2010). This was identified thanks to the matching profiles of CH4 and
H2 (peaks not shown), which could only have formed during the WCO/steam/N2 feed. Some CO
and CO2 also evolved during this flushing period. Between 300 and 500 s, CO2 increased as a
result of carbon oxidation, followed by a CO increase when the lack of oxygen hampered complete oxidation. We have shown in the study without sorbent and using the O elemental balance, that at this stage, Ni oxidation also occurred, and began its trend to dominate the
consumption of oxygen. The exothermicity of these simultaneous oxidation reactions contributed to a rise in the reactor bed temperatures from 600 to above 800 °C (Fig. 4a).
It was expected that when the bed temperatures exceed 750 °C, de-carbonation would occur, but it is possible that larger solid temperature gradients deep in the bed material would allow for a more significant de-carbonation to take place. These solid temperature gradients would not have been accurately reflected by the thermocouple temperatures, which would have been closer to bulk gas reactor temperatures. This would explain how, when multiplying the peak rate of CO2
evolution (4×10⁻⁴ mol/s) under air feed, by the assumed duration of the de-carbonation (the 300 s indicated in Fig. 4a by temperature exceeding 750 °C), only 29% of the CO2 capacity of the
22
oxidation reactions able to better couple with the endothermic decarbonation (calcination) reaction.
Considering the WCO/steam/N2 and air feeds as the two main reactive cycle conditions, and
ignoring the potential reactivity of the N2 purge, such as carbonaceous deposits playing a role in
the reduction of NiO (Dupont et al, 2008), the advantages of the sorption enhanced chemical looping reforming process were demonstrated over a restricted number of cycles. These included production of high purity H2, improved fuel and steam conversion, and autothermality for
extended periods of time, as well as the ability to cope with partial fuel conversion without deleterious effects of carbon deposits, due to integration of the oxygen transfer catalyst and sorbent regeneration steps within the process. Thus on one hand, these features make the process very promising, and this, coupled with the fact that the chosen fuel, waste cooking oil, will remain in plentiful supply for the foreseeable future, would justify further research and development. On the other hand, the results revealed complex reaction mechanisms at work, where individual steps were difficult to isolate and quantify with the current set up and methods. For a better understanding of all the significant reactions in the process and of their interactions, fundamental studies with increased analytical capabilities in monitoring the extent of the OTM’s redox states and sorbent’s usage with time on stream appear necessary. In addition, although the process was shown to operate without obvious deterioration for six cycles, tests designed to establish the life expectancy of the OTM and sorbent in the conditions of sorption enhanced chemical looping reforming in packed bed configuration, and the extent to which their chemical reactivity influences the process would be desirable.
23
The chemical looping reforming of waste cooking vegetable oil on a Ni-Al2O3 catalyst in the
presence of dolomite for in-situ CO2 sorption has been shown to operate for six cycles at 600 °C
at a steam to carbon ratio of 4 without obvious deterioration in fuel and steam conversion, H2
purity and carbon products selectivity. Better fuel and steam conversions than in the absence of sorbent, carbonation efficiencies that stabilised around 56% of the ideal value for the following 5 cycles, and evidence of regeneration of both the catalyst and the sorbent under the two types of feeds were found.
Appendix: Nomenclature
Carbonation efficiency (%)
BT Suffix relevant to the CO2-breakthrough regime (carbonation with sorbent
saturation)
Calc Decarbonation (calcination) reaction (CaCO3 →CaO+CO2)
Carb Reaction of carbonation of the solid sorbent (CaO+CO2→ CaCO3)
C-Ox Complete carbon oxidation reaction (C+O2→ CO2)
C-POx Partial carbon oxidation reaction (C+0.5O2→ CO)
H2 % pur Hydrogen purity (%) calculated by 100×(yH2/(yH2+yCO+yCO2+yCH4))
Ni-Ox Nickel oxidation reaction (Ni+0.5O2→NiO)
Molar rate (mol s-1)
n, m, k Elemental amounts of C, H and O in the fuel (mol)
24 OTM Oxygen transfer material
PB Suffix relevant to the pre-CO2 breakthrough regime (during carbonation)
Sel Selectivity to a specific product (%)
SS Suffix relevant to CO2-steady state or post-CO2 breakthrough conditions.
SR Steam reforming reaction (CnHmOk reacting with steam producing CO and H2)
t Characteristic time (s)
Tmid Mid reactor bed temperature (°C)
UC Unmixed combustion reaction (reduction of NiO by CnHmOk, producing Ni, CO2, and
H2O)
WCO Waste cooking vegetable oil
WGS Water gas shift reaction (CO+H2O CO2+H2)
X Fractional conversion
y Gas mol fraction
Acknowledgments
25
References
Devi, L., Ptasinski, K. J., Janssen, F. J. J. G, van Paasen, S. V. B., Bergman, P. C. A., Kiel, J. H. A, 2005. Catalytic decomposition of biomass tars: use of dolomite and untreated olivine. Renew. Energ., 30, 565- 587.
Dupont, V., Ross, A. B., Hanley, I., Twigg, M. V., 2007. Unmixed Steam Reforming of Methane and Sunflower Oil: A Single-Reactor Process for H2-rich Gas. Int. J. Hydrogen Energ., 32,
67-79
Dupont, V., A. B. Ross, E. Knight, I. Hanley, M. V. Twigg, 2008. Production of hydrogen by unmixed steam reforming of methane. Chem. Eng. Sci., 63, 2966-2979.
Eder, K, and Brandsch, C., 2002. The effect of fatty acid composition of rapeseed oil on plasma lipids and oxidative stability of low-density lipoproteins in cholesterol-fed hamsters. Eur. J. Lipid Sci. Technol., 104, 3-13.
Harrison, D.P., 2008. Sorption-enhanced hydrogen production: A review. Ind. Eng. Chem. Res. 47, 6486-6501.
Kee, R.J., Miller, J.A., Jefferson, T.H., 1980. CHEMKIN: a general purpose problem-independent, transportable, FORTRAN Chemical Kinetics Code Package. Sandia National Laboratories. Report SAND80-8003.
Lutz, A.E.; Rupley, F.M.; Kee, R.J. 1999, EQUIL: a Program for Computing Chemical Equilibria. CHEMKIN Collection, Release 3.5; Reaction Design, Inc: SanDiego, pp 2-20.
26
Pimenidou, P., Rickett, G.L., Dupont, V. 2009. In-situ CO2 capture for unmixed steam
reforming. Oral presentation at WCCE8 (8th World Congress of Chemical Engineering). August 23-27 2009, Montreal, Canada.
Pimenidou, P., Rickett, G.L., Dupont, V., and Twigg, M. V., 2010. Chemical looping reforming of waste cooking oil in packed bed reactor. Accepted in Bioresource Technol. BITE-D-10-00048, in press.
27
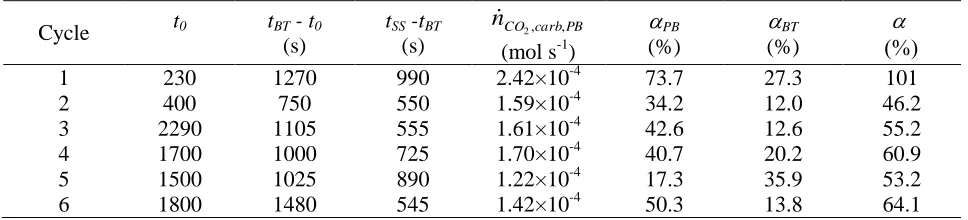
Table 1 Process outputs at steady state (post-CO2 breakthrough) for 6 cycles without (left) and
with (right) the CO2 sorbent present (40 g of catalyst, S:C ratio of 4, set reactor temperature of
600 °C).
Without sorbent With 40 g of calcined dolomite
C X WCO
X H2O
Sel CO Sel CO2 Sel CH4 H2 % pur T mid X WCO X H2O
Sel CO Sel CO2 Sel CH4 H2 % pur T mid 1 0.19 0.07 12 86 2 70.5 579 0.46 0.19 4 81 15 69.7 584
2 0.21 0.07 16 80 4 68.9 585 0.30 0.11 10 89 1 71.3 597
3 0.20 0.06 20 74 5 68.5 585 0.31 0.10 10 89 1 70.5 604
4 0.14 0.06 23 70 7 67.3 589 0.32 0.12 11 87 2 70.1 604
5 0.22 0.05 16 68 16 64.8 587 0.23 0.08 11 86 3 70.6 604
6 0.20 0.07 23 69 7 68.8 591 0.27 0.11 16 78 6 72.3 601
av 0.19 0.06 18 75 7 68.1 586 0.31 0.12 10 85 5 70.7 599
Table 2 Durations of CO2 pre-breakthroughand breakthroughperiods, pre-breakthrough rate of
carbonation, carbonation efficiencies prior to- and during CO2 breakthrough, and total
carbonation efficiency for each cycle during the chemical looping reforming of WCO at S:C of 4 with sorbent and the set reactor temperature of 600 °C.
Cycle t0 tBT - t0 (s)
tSS -tBT
(s)
PB carb CO n 2, ,
(mol s-1)
PB (%) BT (%)
1 230 1270 990 2.42×10⁻⁴ 73.7 27.3 101
2 400 750 550 1.59×10⁻⁴ 34.2 12.0 46.2
3 2290 1105 555 1.61×10⁻⁴ 42.6 12.6 55.2
4 1700 1000 725 1.70×10⁻⁴ 40.7 20.2 60.9
5 1500 1025 890 1.22×10⁻⁴ 17.3 35.9 53.2
[image:28.612.65.549.467.577.2]28
Table 3 Estimate of NiO reduction rate in pre-CO2 breakthrough conditions and % ratio of NiO
reduction rate to maximum reduction rate achievable by fuel conversion
k m n
X n
n R
SS WCO in WCO
PB Ni NiO red
5 . 0 2 100
, ,
,
for cycles 2-6 and same conditions as Table 2.
Cycle nNiONi,PB(mol s
-1
) % Rred
2 0.66 ×10⁻⁴ 14.5
3 0.84×10⁻⁴ 18.0
4 1.01×10⁻⁴ 20.5
5 0.61×10⁻⁴ 17.2
6 0.41×10⁻⁴ 10.0
29
Fig. 1(a) Dry mol % of H2 (upper curves group) and CO2 (lower curves group) for each cycle
(C1-6) measured online every 5 s during the WCO/steam/N2 feed with 40 g of catalyst and 40 g
of calcined dolomite, using a S:C of 4 at a set reactor temperature of 600 °C. (b) Electrical power input to the reactor for the first cycle (% of maximum).
0 10 20 30 40 50 60
0 500 1000 1500 2000 2500
mo l % ( d ry ) Time (s) H2 (C1) H2 (C2) H2 (C3) H2 (C4) H2 (C5) H2 (C6) CO2 (C1) CO2 (C2) CO2 (C3) CO2 (C4) CO2 (C5) CO2 (C6) t0 tSS (a)
pre-CO2breakthrough 'PB'
CO2 break-through
'BT'
tBT
CO2 steady-state 'SS'
0 20 40 60 80 100
0 500 1000 1500 2000 2500
[image:30.612.76.437.109.460.2]30
Fig. 2 H2 % purity for cycles C1-6 in same experimental conditions as Fig. 1. End values near
70% after high plateau (post CO2-breakthrough) correspond to tabulated values in Table 1.
Fig. 3 (a) Dry syngas mol fractions and (b) estimated water conversion fraction for cycle 4 without sorbent, 40 g catalyst, S:C=4, Tset=600 °C, same flows as in Fig. 1.
70 75 80 85 90 95 100
0 500 1000 1500 2000 2500
H2 p u ri ty ( % ) Time (s) C1 C2 C3 C4 C5 C6 0 5 10 15 20 25 30 35
1000 3000 5000
M o l % ( d ry ) Time (s) H2 CO2 CO CH4 (a) -0.02 0 0.02 0.04 0.06 0.08 0.1
1000 3000 5000
[image:31.612.76.348.359.555.2]31
Fig. 4 (a) Rates of CO2 and CO evolution for the air feed of the first cycle with sorbent (bottom
curves) and mid- and top-reactor temperature-time curves (top). (b) Percent electrical power input to the heater during air feed of first cycle.
300 400 500 600 700 800 0.0000 0.0001 0.0002 0.0003 0.0004 0.0005 0.0006 0.0007 0.0008
0 200 400 600 800 1000 1200 1400
Te mp e ra tu re s (° C) R ate o f e vo lu ti o n (mo l s -1) Time (s) rate CO2 rate CO Tmid Ttop decarbonation (a) flushing
C and Ni oxidation
0 20 40 60 80 100
0 200 400 600 800 1000 1200 1400
[image:32.612.78.405.87.428.2]