RESEARCH NOTE
Internal consistency and factor structure
of a brief scale assessing sensitivity to blood,
injury, and mutilation
Oscar I. Gonzalez, James A. Naifeh, Quinn M. Biggs, Tsz Hin Hinz Ng, Carol S. Fullerton and Robert J. Ursano
*Abstract
Objective: US Army soldiers and military veterans experience high rates of post-traumatic stress disorder (PTSD). However, PTSD risk factors are not fully understood. Sensitivity to blood, injury, and mutilation (SBIM), which includes fear of being injured, seeing another person injured, and exposure to mutilation-relevant stimuli (e.g., blood, wounds) may be a PTSD risk factor that is identifiable prior to trauma exposure. Building on previous research that used a sub-set of items from the Mutilation Questionnaire (MQ), the aim of this study was to examine the reliability and validity of two brief scales assessing SBIM.
Results: Data from two independent samples of male, US Army soldiers, was utilized to examine a brief 10-item SBIM measure (MQ-SBIM-10) and a shorter version 5-item SBIM measure (MQ-SBIM-5). Internal consistency was indexed by the Kuder–Richardson 20 formula. Construct validity was assessed using confirmatory factor analysis and results obtained from each sample, and from a combined sample. The MQ-SBIM-10 demonstrated acceptable internal con-sistency and the hypothesized one-factor structure. Although the MQ-SBIM-5 explained a substantial amount of the variance in the 10-item measure and had a one-factor structure, internal consistency of the 5-item measure was poor. Analyses supported the MQ-SBIM-10 as a reliable and cohesive measure of sensitivity to blood, injury, and mutilation. Keywords: Assessment, Mental health, Sensitivity to blood, injury and mutilation (SBIM), Mutilation Questionnaire (MQ), Post-traumatic stress disorder (PTSD), Risk factor, Soldiers
© The Author(s) 2019. This article is distributed under the terms of the Creative Commons Attribution 4.0 International License (http://creat iveco mmons .org/licen ses/by/4.0/), which permits unrestricted use, distribution, and reproduction in any medium, provided you give appropriate credit to the original author(s) and the source, provide a link to the Creative Commons license, and indicate if changes were made. The Creative Commons Public Domain Dedication waiver (http://creat iveco mmons .org/ publi cdoma in/zero/1.0/) applies to the data made available in this article, unless otherwise stated.
Introduction
Rates of post-traumatic stress disorder (PTSD) are high among US Army soldiers and military veterans [1, 2]. Risk factors for developing PTSD are not fully under-stood. Sensitivity to blood, injury, and mutilation (SBIM), which includes fear of being injured, seeing another per-son injured, and exposure to mutilation-relevant stimuli (e.g., blood, wounds) may be a PTSD risk factor that is identifiable prior to trauma exposure. Evidence suggests that peritraumatic responses may play an important role in the subsequent development of PTSD [3]. Exposure to injury and mutilation is associated with physiological
and behavioral reactivity, as well as self-reported arousal, negative affect, and disgust [4–9]. Considering that trau-matic events often involve actual or perceived threat of injury to oneself and others, individuals with heightened sensitivity to these stimuli may experience elevated psy-chological and/or physiological responses that increase risk for post-traumatic stress.
PTSD symptoms of intrusion and avoidance have been positively associated with fear of gruesome expe-riences and potential bodily injury [9] as measured by the 30-item Mutilation Questionnaire (MQ) [10]. First reported by Klorman et al. [10], the MQ is a self-report inventory designed to assess the cognitive-verbal com-ponent of fear of gruesome tasks or events where bodily injury is possible. However, an exploratory factor analy-sis (EFA) of the MQ using college student data revealed a heterogeneous factor structure suggesting that the MQ
Open Access
*Correspondence: [email protected]
may not be a cohesive measure of a unitary construct [11]. A recent EFA of the MQ using data from US sol-diers similarly found a heterogeneous factor structure [12]. Importantly, a subset of 10 MQ items was identified that form a cohesive SBIM scale focused on sensitivity to injury (to oneself and others) and mutilation-related stimuli that may accompany injuries (e.g., blood, wounds) [12]. The sum of those 10 MQ items (called here MQ-SBIM-10) was positively associated with PTSD symptom severity, even after controlling for well-established demo-graphic risk factors (age, education, military rank), life-time trauma exposure, and trait neuroticism [12].
The degree to which SBIM reflects a state-like or trait-like construct remains unclear. Animal and human stud-ies suggest that fear of injury and mutilation may be a fundamental psychobiological phenomenon with impli-cations for understanding anxiety-related disorders [13,
14]. While psychophysiological assessment of SBIM may be optimal, it is impractical for large-scale admin-istration. Valid and reliable measurement is vital for improving our understanding of SBIM and its potential relationships with trauma exposure, PTSD, and other mental disorders.
Continued use of the MQ-SBIM-10 requires a more extensive examination of its psychometric properties. Early identification of SBIM may be particularly impor-tant in military populations where threat of injury and mutilation-related stimuli are intrinsic to combat and other military operations. However, given the challenges of large scale military screening assessments where brev-ity is critical to inclusion, it would be advantageous to shorten the MQ-SBIM-10 even further. To these ends, we conducted a series of analyses using data from two independent samples of male US Army soldiers, Spe-cial Operations Command (SOC) and Mortuary Affairs (MA). SOC soldiers are organized, equipped, and trained to conduct unconventional, high-risk, high-value combat operations where exposure to injury and death are likely. MA soldiers recover, identify, and evacuate the remains of the dead from the theater of war, duties that expose them to dismembered, burned, and decomposed remains and potential personal injury in the combat environ-ment. We first investigated the internal consistency and construct validity of the MQ-SBIM-10 in both samples. Construct validity was assessed using confirmatory fac-tor analysis (CFA), a more rigorous test than the EFA reported in previous research [12]. We then repeated these analyses using a 5-item subset of the MQ-SBIM-10.
Main text
Methods
De-identified, cross-sectional data were obtained from 675 SOC and 750 MA soldiers, all males. All soldiers
completed a self-report questionnaire as part of their voluntary participation in one of two larger studies on mental health outcomes in military personnel. Data was collected between 2009 and 2011 for SOC soldiers [12], and between 2005 and 2015 for MA soldiers. Study par-ticipants provided written informed consent. Both stud-ies were approved by the Institutional Review Board at the Uniformed Services University of the Health Sci-ences, Bethesda, MD.
Measures
Demographic and military variables included age, race/ ethnicity (White non-Hispanic vs. other), marital status (married vs. single), education (high school or less vs. more than high school), rank (E1–E4 vs. E5 or higher), previous deployment to the Middle East region (yes vs. no). Lifetime combat exposure (e.g., Being attacked; Han-dling or uncovering remains) was based on the sum of 27 items (never = 0 and yes = 1) adapted from the Com-bat Experiences Scale (CES) [15]. The CES had excel-lent internal consistency in both samples (SOC, α = 0.95,
n= 675; MA, α = 0.92, n= 284).
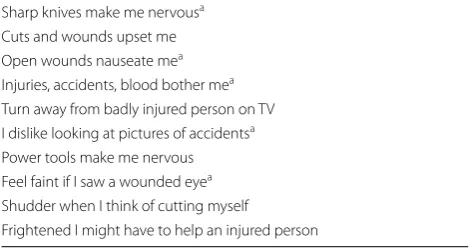
SBIM was assessed using the subset of 10 MQ items (MQ-SBIM-10; see Table 1) previously identified by Naifeh et al. [12]. Items (e.g. “Open wounds nauseate me”) are endorsed true = 1 or false = 0 and summed to generate a SBIM severity score. A 5-item version (MQ-SBIM-5) was also generated by retaining items with the highest item-total correlations among both study sam-ples (data available upon request) while excluding items with convoluted wording or highly overlapping content (Table 1).
Statistical analyses
Between-sample differences on categorical and continu-ous variables were examined using Chi square tests and unpaired t-tests, respectively. Internal consistency of the
Table 1 Item content for the MQ-SBIM-10 and MQ-SBIM-5
Items in the table are abbreviated/paraphrased
a Item included in the MQ-SBIM-5 Sharp knives make me nervousa
Cuts and wounds upset me Open wounds nauseate mea
Injuries, accidents, blood bother mea
Turn away from badly injured person on TV I dislike looking at pictures of accidentsa
Power tools make me nervous Feel faint if I saw a wounded eyea
Shudder when I think of cutting myself
[image:2.595.304.540.581.705.2]MQ-SBIM-10 and MQ-SBIM-5 was examined using the Kuder–Richardson 20 formula (KR-20), which is appro-priate for scales with dichotomous items [16], and inter-item correlations. To examine construct validity, we used confirmatory factor analysis (CFA) to estimate the hypothesized one-factor structure of each SBIM scale.
We also performed a multi-group CFA where fac-tor loadings were held constant across the SOC and MA samples (n =1425). In accordance with rec-ommendations [17], the following CFA fit indices were examined: the Tucker–Lewis fit index (TLI; > 0.90 = acceptable, > 0.95 = excellent), comparative fit index (CFI; > 0.90 = adequate), RMSEA (< 0.05 = good, 0.05–0.08 = adequate, 0.08–0.10 = marginal, > 0.10 = poor), and Chi square test of model fit. Finally, linear regression analyses examined the proportion of SBIM-10 total score variance explained by MQ-SBIM-5 total scores in each sample. Analyses were con-ducted using SAS 9.4 [18] and MPlus [19].
Results
Sample
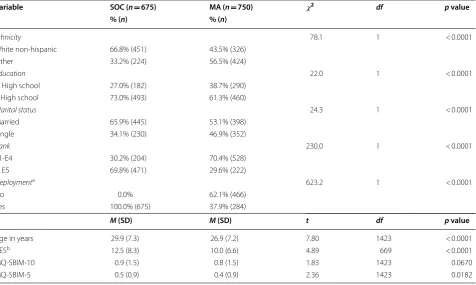
Compared to the MA, the SOC were older (29.9 vs 26.9 years) and more likely to report White non-hispanic race/ethnicity (66.8% vs 43.5%), more than high school
education (73.0% vs 61.3%), being currently married (65.9% vs 53.1%), rank E5 or higher (70% vs 30%), pre-vious deployment to the Middle East (100% vs 37.9%), and more combat exposure, t= 4.89 (669), p < 0.0001 (Table 2). The samples did not differ on MQ-SBIM-10 total score, but the MQ-SBIM-5 total score was sig-nificantly higher for SOC, t= 2.36 (1423), p= 0.0182 (Table 2).
Internal consistency and construct validity
MQ‑SBIM‑10
The MQ-SBIM-10 demonstrated acceptable internal con-sistency in both samples, with KR-20 of 0.72 and 0.78 among SOC and MA, respectively. Item-total correla-tions ranged from 0.29 to 0.50 for the SOC and from 0.34 to 0.56 for the MA. Average item-total correlations were 0.40 for SOC and 0.45 for MA, exceeding the acceptable lower limit of 0.30 [20].
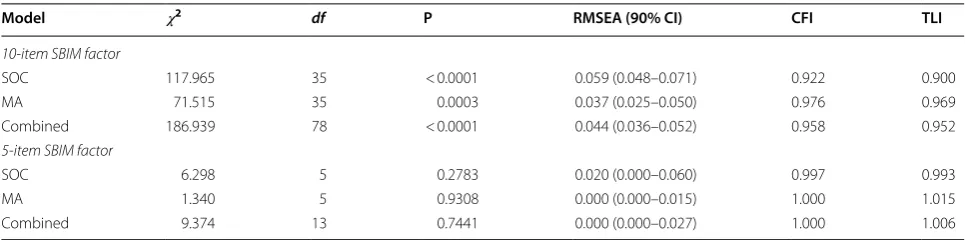
The CFA results confirmed that the one-factor model proposed for the 10-item SBIM index fit the data rea-sonably well (Table 3). The CFI and the TLI were at or above the 0.90 standard for acceptable fit in both the SOC and MA groups, and the RMSEAs were all smaller than 0.06, indicating acceptable/good fit of the model hypothesized [17]. The CFA indices obtained from the
Table 2 Sample characteristics and descriptive statistics of study variables
a Previous deployment to the Middle East region
b CES data was examined for those who had previously deployed to the Middle East region (n= 675 for SOC; n= 284 for MA)
Variable SOC (n= 675) MA (n= 750) 𝜒2 df p value
% (n) % (n)
Ethnicity 78.1 1 < 0.0001
White non-hispanic 66.8% (451) 43.5% (326)
Other 33.2% (224) 56.5% (424)
Education 22.0 1 < 0.0001
≤ High school 27.0% (182) 38.7% (290) > High school 73.0% (493) 61.3% (460)
Marital status 24.3 1 < 0.0001
Married 65.9% (445) 53.1% (398)
Single 34.1% (230) 46.9% (352)
Rank 230.0 1 < 0.0001
E1-E4 30.2% (204) 70.4% (528)
≥ E5 69.8% (471) 29.6% (222)
Deploymenta 623.2 1 < 0.0001
No 0.0% 62.1% (466)
Yes 100.0% (675) 37.9% (284)
M (SD) M (SD) t df p value
Age in years 29.9 (7.3) 26.9 (7.2) 7.80 1423 < 0.0001
CESb 12.5 (8.3) 10.0 (6.6) 4.89 669 < 0.0001
MQ-SBIM-10 0.9 (1.5) 0.8 (1.5) 1.83 1423 0.0670
[image:3.595.62.539.421.706.2]combined group also supported the one-factor structure (i.e., RMSEA ≤ 0.06, CFI ≥ 0.95, TLI ≥ 0.95) [17].
MQ‑SBIM‑5
The reliability coefficients (KR-20) for MQ-SBIM-5 were 0.57 and 0.67 among SOC and MA, respec-tively. Item-total correlations ranged from 0.22 to 0.45 in SOC, and from 0.38 to 0.48 in MA. Average item-total correlations were 0.36 for SOC and 0.43 for MA. Results also supported a single-factor conceptualiza-tion of this measure as CFA fit indexes met the recom-mended cut-offs for good fit in all three models (CFI and TLI exceeded 0.95 and RMSEA was below 0.06). A linear regression analysis indicated that MQ-SBIM-5 sum scores explains 82% and 85% of variation in MQ-SBIM-10 scores in the SOC and the MA, respectively.
Discussion
The current study provided initial examination of the reliability and validity of two brief measures of SBIM, a potential risk factor for PTSD. Building on previ-ous research [12], the MQ-SBIM-10 (10 items) and MQ-SBIM-5 (5 items) were examined using data from two independent samples of male, US Army soldiers. Between-group differences in demographic and mili-tary variables were not surprising given the nature of these units’ occupations. The average MQ-SBIM-10 score did not significantly differ between these groups, which could suggest that SBIM may be a trait-like con-struct. However, mean scores were significantly higher among SOC compared to MA for the MQ-SBIM-5. Additional research is needed to begin to elucidate the nature (state-like or trait-like) of the SBIM construct.
The MQ-SBIM-10 demonstrated acceptable inter-nal consistency (KR-20 = 0.72). Internal consistency of the MQ-SBIM-5 was low (KR-20 = 0.57). We expected some reduction in reliability due to fewer scale items. However, the poor internal consistency of the MQ-SBIM-5 limits its current utility, points to the need
for further examination, and suggests that researchers should use the MQ-SBIM-10 at the moment. Inter-item correlations were positive, and none was high enough for any item to be redundant. In both samples, the internal consistency coefficients (KR-20) were larger for the MQ-SBIM-10 than for the MQ-SBIM-5, which was also expected given that such values tend to be lower with fewer items [21].
The hypothesized one-factor structure of the MQ-SBIM-10 and MQ-SBIM-5 was supported by the CFA results obtained from the SOC, MA, and the combined group. It may be argued that unidimensional measures, by virtue of containing only items of the construct of interest, promote parsimony of scale items which reduces questionnaire length and respondent fatigue.
Limitations
Due to the use of cross-sectional data and convenience sampling, generalizability is limited and test–retest reli-ability was not assessed. Analyses were based on exist-ing data sets, hence, the MQ-SBIM-10 and MQ-SBIM-5 were not administered independent of each other or the full MQ, and results could have varied if administered separately. Further investigation of the reliability and validity of the proposed measures is warranted.
Abbreviations
PTSD: post-traumatic stress disorder; SBIM: sensitivity to blood, injury, and mutilation; MQ: Mutilation Questionnaire; EFA: exploratory factor analysis (EFA); SOC: special operations command (SOC); MA: mortuary affairs (MA); CFA: confirmatory factor analysis (CFA); CES: Combat Experiences Scale (CES); MQ-SBIM-5: 5-item measure of sensitivity to blood, injury, and mutilation; MQ-SBIM-10: 10-item measure of sensitivity to blood, injury, and mutilation; RMSEA: root mean square error of approximation; SAS: statistical analysis system; CFI: comparative fit index; TLI: Tucker Lewis Index.
Authors’ contributions
OIG, JAN, QMB, CSF and RJU, were responsible for the design and oversight of the study. THHN conducted the statistical analyses. All authors contrib-uted critically to interpretation of the data and drafting of the manuscript and approved the final submission. All authors read and approved the final manuscript.
Table 3 Properties of SBIM factor structures among SOC (n = 675), MA (n = 750), and combined sample (n = 1425)
Model 𝜒2 df P RMSEA (90% CI) CFI TLI
10-item SBIM factor
SOC 117.965 35 < 0.0001 0.059 (0.048–0.071) 0.922 0.900
MA 71.515 35 0.0003 0.037 (0.025–0.050) 0.976 0.969
Combined 186.939 78 < 0.0001 0.044 (0.036–0.052) 0.958 0.952
5-item SBIM factor
SOC 6.298 5 0.2783 0.020 (0.000–0.060) 0.997 0.993
MA 1.340 5 0.9308 0.000 (0.000–0.015) 1.000 1.015
[image:4.595.56.539.100.220.2]•fast, convenient online submission •
thorough peer review by experienced researchers in your field • rapid publication on acceptance
• support for research data, including large and complex data types •
gold Open Access which fosters wider collaboration and increased citations maximum visibility for your research: over 100M website views per year •
At BMC, research is always in progress.
Learn more biomedcentral.com/submissions
Ready to submit your research? Choose BMC and benefit from:
Acknowledgements
Not applicable.
Competing interests
The authors declare that they have no competing interests.
Availability of data and materials
For information on data availability, please contact the Uniformed Services University of the Health Sciences Institutional Review Board, 4301 Jones Bridge Road, Bethesda MD 20814.
Consent to publish
Not applicable.
Ethics approval and consent to participate
The Uniformed Services University of the Health Sciences, Bethesda, MD Institutional Review board approved the studies. All participants provided informed written consent.
Funding
This research was supported by a Grant (HT9404-13-1-0007) to Robert J. Ursano from the US Department of Defense. The funder had no role nor interest in the design and conduct of this study. The opinions expressed in this article are those of the authors and, therefore, do not necessarily reflect the views of the US Department of Defense, the Uniformed Services University of the Health Sciences, or the Center for the Study of Traumatic Stress.
Publisher’s Note
Springer Nature remains neutral with regard to jurisdictional claims in pub-lished maps and institutional affiliations.
Received: 4 October 2018 Accepted: 16 March 2019
References
1. Ramsey C, Dziura J, Justice AC, Altalib HH, Bathulapalli H, Burg M, et al. Incidence of mental health diagnoses in veterans of operations iraqi free-dom, enduring freefree-dom, and New Dawn, 2001–2014. Am J Public Health. 2017;107(2):329–35.
2. Wisco BE, Marx BP, Wolf EJ, Miller MW, Southwick SM, Pietrzak RH. Post-traumatic stress disorder in the US veteran population: results from the National Health and Resilience in Veterans Study. J Clin Psychiatry. 2014;75(12):1338–46.
3. Bovin MJ, Marx BP. The importance of the peritraumatic experience in defining traumatic stress. Psychol Bull. 2011;137(1):47–67.
4. Azevedo TM, Volchan E, Imbiriba LA, Rodrigues EC, Oliveira JM, Oliveira LF, Lutterbach LG, Vargas CD. A freezing-like posture to pictures of mutila-tion. Psychophysiology. 2005;42(3):255–60.
5. Bradley MM, Codispoti M, Cuthbert BN, Lang PJ. Emotion and motiva-tion I: defensive and appetitive reacmotiva-tions in picture processing. Emomotiva-tion. 2001;1(3):276–98.
6. Bradley MM, Sabatinelli D, Lang PJ, King W, Desai P. Activation of the visual cortex in motivated attention. Behav Neurosci. 2003;117(2):369–80. 7. Lang PJ, Bradley MM, Cuthbert BN. International affective picture system
(IAPS): affective ratings of pictures and instruction manual. Gainesville: University of Florida; 2008.
8. Levenson RW. Autonomic nervous system differences among emotions. Psychol Sci. 1992;3(1):23–7.
9. McCarroll JE, Ursano RJ, Fullerton CS, Lundy A. Anticipatory stress of han-dling human remains from the Persian Gulf War. Predictors of intrusion and avoidance. J Nerv Ment Dis. 1995;183(11):698–703.
10. Klorman R, Weerts TC, Hastings JE, Melamed BG, Lang PJ. Psycho-metric description of some specific-fear questionnaires. Behav Ther. 1974;5(3):401–9.
11. Kleinknecht RA, Thorndike RM. The Mutilation Questionnaire as a predic-tor of blood/injury fear and fainting. Behav Res Ther. 1990;28(5):429–37. 12. Naifeh JA, Ursano RJ, Benfer N, Wu H, Herman M, Benedek DM, et al. PTSD
symptom severity and sensitivity to blood, injury, and mutilation in US army special operations soldiers. Psychiatry Res. 2017;250:78–83. 13. Cisler JM, Olatunji BO, Lohr JM. Disgust, fear, and the anxiety disorders: a
critical review. Clin Psychol Rev. 2009;29(1):34–46.
14. Carleton RN, Thibodeau MA, Osborne JW, Taylor S, Asmundson GJG. Revisiting the fundamental fears: towards establishing construct inde-pendence. Pers Individ Dif. 2014;1(63):94–9.
15. Killgore WDS, Cotting DI, Thomas JL, Cox AL, McGurk D, Vo AH, et al. Post-combat invincibility: violent combat experiences are associated with increased risk-taking propensity following deployment. J Psychiatr Res. 2008;42(13):1112–21.
16. Cronbach LJ. Coefficient Alpha and the internal structure of tests. Psycho-metrika. 1951;16(3):297–334.
17. Hu L, Bentler PM. Cutoff criteria for fit indexes in covariance structure analysis: conventional criteria versus new alternatives. Struct Equ Model. 1999;6(1):1–55.
18. Institute SAS. Base SAS 9.4 procedures guide: Statistical procedures. Cary: SAS Institute; 2017.
19. Muthen LK, Muthen BO. Mplus version 7.4 software. Los Angeles: stat-model.com; 2015.
20. Nunnally JC, Bernstein IH. Psychometric theory (McGraw-Hill Series in Psychology), vol. 3. New York: McGraw-Hill; 1994.