RESEARCH NOTE
Mitochondrial genome variation
of Atlantic cod
Tor Erik Jørgensen
1, Bård Ove Karlsen
2, Åse Emblem
3, Ragna Breines
3, Morten Andreassen
3, Trine B. Rounge
4,
Alexander J. Nederbragt
4, Kjetill S. Jakobsen
4, Marianne Nymark
3, Anita Ursvik
3, Dag H. Coucheron
3,
Lars Martin Jakt
1, Jarle T. Nordeide
1, Truls Moum
1and Steinar D. Johansen
1*Abstract
Objective: The objective of this study was to analyse intraspecific sequence variation of Atlantic cod mitochondrial DNA, based on a comprehensive collection of completely sequenced mitochondrial genomes.
Results: We determined the complete mitochondrial DNA sequence of 124 cod specimens from the eastern and western part of the species’ distribution range in the North Atlantic Ocean. All specimens harboured a unique mito-chondrial DNA haplotype. Nine hundred and fifty-two polymorphic sites were identified, including 109 non-synon-ymous sites within protein coding regions. Eighteen variable sites were identified as indels, exclusively distributed in structural RNA genes and non-coding regions. Phylogeographic analyses based on 156 available cod mitochondrial genomes did not reveal a clear structure. There was a lack of mitochondrial genetic differentiation between two ecotypes of cod in the eastern North Atlantic, but eastern and western cod were differentiated and mitochondrial genome diversity was higher in the eastern than the western Atlantic, suggesting deviating population histories. The geographic distribution of mitochondrial genome variation seems to be governed by demographic processes and gene flow among ecotypes that are otherwise characterized by localized genomic divergence associated with chromosomal inversions.
Keywords: Atlantic cod, Mitogenome, Gadus morhua, Genomic resource, mtDNA, SNP
© The Author(s) 2018. This article is distributed under the terms of the Creative Commons Attribution 4.0 International License (http://creat iveco mmons .org/licen ses/by/4.0/), which permits unrestricted use, distribution, and reproduction in any medium, provided you give appropriate credit to the original author(s) and the source, provide a link to the Creative Commons license, and indicate if changes were made. The Creative Commons Public Domain Dedication waiver (http://creat iveco mmons .org/ publi cdoma in/zero/1.0/) applies to the data made available in this article, unless otherwise stated.
Introduction
The Atlantic cod (Gadus morhua) is one of the most important species for fisheries in the North Atlantic Ocean [1], and recently the nuclear genome was reported [2, 3]. The mitochondrial genome (mitogenome) is sidered the second genome of the cell, and its gene con-tent is conserved among most vertebrates [4]. The 16.7 kb Atlantic cod mitogenome encodes the standard set of 13 hydrophobic membrane proteins, 2 ribosomal RNAs (rRNAs), 22 transfer RNAs (tRNAs), as well as peptides and long non-coding RNAs, and is organized similarly to that of humans [5–7].
On average, the Atlantic cod mitogenome evolves about 14 times more rapidly at the nucleotide level than
the nuclear genome [8], and mitochondrial sequence variation in cod was previously used to trace population structures and patterns of mitogenome evolution [8–12]. Árnason [9] investigated sequence variants of a 250-bp cytochrome b (CytB) gene fragment in 1278 Atlantic cod specimens throughout the distribution range, and identified trans-Atlantic haplotype clines with more diversity in northeastern and mid-Atlantic cod as com-pared to northwestern cod. Carr et al. [10, 12] reported on mitogenome variation based on 32 cod specimens and identified 298 single nucleotide polymorphic (SNP) sites. They found similar diversities in northwest and northeast Atlantic cod, but their sample from the north-east Atlantic consisted of six specimens only [10]. In the present study, we sequenced the complete mitogenome of 124 individuals, generating a mitochondrial sequence resource for future studies of Atlantic cod. We analysed relationships among the 156 cod mitogenomes currently
Open Access
*Correspondence: steinar.d.johansen@nord.no
1 Genomics Group, Faculty of Biosciences and Aquaculture, Nord University, 8049 Bodø, Norway
available and compared mitogenome variation of the offshore migratory and stationary coastal cod ecotypes [11], both from the northeast Atlantic, and cod from the northwest Atlantic.
Main text Methods
Tissue samples, nucleic acid extraction, PCR amplification, and plasmid cloning
Atlantic cod tissue samples were collected from the western (off Nova Scotia and Newfoundland) and east-ern parts (off the British Isles, in the Baltic Sea, Irish Sea, North Sea, along the Norwegian coast and fjords, and in the Barents Sea) of the North Atlantic Ocean (Additional file 1: Table S1). DNA was extracted from fresh muscle tissue or ethanol preserved tissue (stored at − 20 °C) using the High Pure PCR Template Prepara-tion kit (Roche) or the MasterPure™ Complete DNA and RNA Purification Kit (Epicentre®) according to the man-ufacturer’s protocols. Complete mitogenomes were PCR amplified in five overlapping fragments of approximately 4–4.5 kb in size using LaTaq polymerase (TAKARA BIO INC). The PCR products were purified using USB® ExoSAP-IT® reagent (Affymetrix). Agarose gel electro-phoresis and gel extraction using Invitrogen™ PureLink® Quick Gel Extraction Kit or Invitrogen™ PureLink® PCR Purification Kit were performed according to the manu-facturer’s protocols. PCR and sequencing primers used in this study have been described previously [13]. Plas-mid cloning of the control region (CR) was performed by using Invitrogen™ TOPO® TA Cloning® Kit with One Shot® TOP10 E. coli competent cells. Positive clones were cultivated and plasmid DNA was purified using Inv-itrogen™ PureLink® Quick Plasmid Miniprep Kit.
Mitogenome sequencing and data analysis
The complete mitogenome sequences of 124 Atlantic cod specimens were determined, using Sanger, Illumina, and Roche 454 technologies (117, six, and one speci-men, respectively). The latter, based on pyrosequenc-ing, was reported previously [2]. The Illumina GAII sequencing was performed according to protocols in [14] using 2 × 10⁸ bp paired end reads, library inserts of 550–575 bp, and 3.1–6.6 times (average 4.8 times) whole genome coverage (Norwegian Sequencing Centre—Oslo, Norway). Ninety-five mitogenomes were determined by Sanger sequencing provided by Eurofins MWG Operon (Germany). Two Sanger sequenced mitogenomes (NF1 and NC3) have been reported previously [8, 15]. The 20 remaining mitogenomes were sequenced in-house by Sanger technology directly on purified PCR products or plasmid DNA using the BigDye kit (Applied Biosystems). The complete 16,696-bp NC3 Atlantic cod mitogenome
(HG514359) was used as a reference for assembly and mapping of mitogenome sequences and reads. Com-puter analyses of Sanger-generated mitogenomes were performed using DNASTAR ® Lasergene software. For mitogenome sequences generated by Roche 454 and Illu-mina platforms, reference mappings were performed on the CLC Genomics Workbench (QIAGEN®).
A total of 156 available mitogenomes were used to cal-culate population genetic parameters and reconstruct molecular relationships among Atlantic cod specimens. The CR, tRNA-Phe, and half of the tRNA-Pro sequence were excluded from these comparisons, as these sequences were not available for the 32 specimens pre-viously reported [10]. Population genetic statistics and measures of genetic differentiation were estimated for the following three subsets of specimens, defined by their geographic origin and ecotype: cod from the northwest Atlantic (NW; N = 32), cod from the north east Atlantic of the coastal stationary ecotype (NC; N = 25), and Arc-tic cod from the Barents Sea of the migratory ecotype (NA; N = 97) (Additional file 1: Table S1). Two specimens from the Baltic Sea were excluded from these analyses, since differentiation from NC due to vicariance is likely. Nucleotide sequence alignments were generated using T-coffee v/9 software [16] with manual refinements. The tree-building method of maximum likelihood (ML) in MEGA version 6 [17] was used to reconstruct molecu-lar relationships. The ML trees were built from best-fit models of nucleotide evolution generated by MEGA6 [Bayesian information criterion calculations resulted in TN93+I+G as best-fit model]. The topologies of the ML trees were evaluated by bootstrap analyses (2000 replica-tions). We analysed nucleotide diversity indices, Tajima’s D statistic, and genetic differentiation indices FST and Da
(the average number of net nucleotide substitutions), as implemented in the DnaSP version 6 software [18].
Results
Sequence variation among Atlantic cod mitogenomes
Complete mitogenome sequences of approximately 16.7 kb were obtained for 124 cod specimens sampled in the western and eastern parts of the North Atlantic Ocean. Mitochondrial sequence variation was initially assessed by considering nucleotide variants of the CytB gene fragment (250 bp) previously reported for 1278 Atlantic cod specimens throughout the species’ range [9]. Eleven haplotypes from that study, including all main haplotypes (A, C, D, E and G) were identified among the 124 specimens, as well as 12 other singleton haplotypes (Additional file 2: Table S2).
as an Atlantic cod reference, resulting in an alignment of 16,551 positions. The total number of polymorphic sites was 952 (5.7% of mitogenome positions), and these were distributed across the two rRNA genes, all 13 pro-tein coding genes, 18 of the 22 tRNA genes, and major non-coding regions (TP-spacer and CR) (Fig. 1). Only 18 variable sites (1.9%) were identified as indels (6 in struc-tural RNA genes and 12 in non-coding regions). Protein coding genes contained 756 (79.4%) substitutions, of which 109 were non-synonymous (14.4%), resulting in amino acid changes in all 13 proteins (Additional file 3: Table S3).
Key features of mitogenome sequence variation are summarized in Additional file 4: Table S4, and several features are noted. Protein coding genes have 2.3 times more SNPs per nucleotide position than RNA genes.
This reflect high sequence conservation in RNA genes at the species level. An interesting observation is that variable sites in the mitochondrial small subunit rRNA gene are mainly clustered within the 3′M structural domain (Additional file 5: Figure S1). A similar feature was not noted in the mitochondrial large subunit rRNA (Additional file 6: Figure S2). The cytochrome oxidase (CO) genes and proteins (Complex IV) are generally more conserved than the NADH dehydrogenase (ND) genes and proteins (Complex I). Here, the ND2 gene contains 7.2 times more polymporphic sites per posi-tion than, e.g. COII or the RNA genes. The ND2, ND4, ND5, and CytB genes contain the highest density of polymorphic sites.
F V L1 I
Q
Y C N A W M
S1
D K G R L2
P E
T S2
H
ND1 ND2 COI COII 8A A6 COIII L4DN ND4 ND5 ND6 Cyt B CR
3
D
N
lncCR-L lncCR-H HN
mtLSU
1.5
4.6
2.0
4.9
3.
6
4.4 0.4
3.5 1.5
3.4 1.3
3.5 0.6
2.6 2.4
6.8
9.6
1.7
7.7
3.
0
8.4
7.7
2.4
7.1 7.4
6.7
7.7
4.5 5.2
>20
mtSSU
MOTS
[image:3.595.52.541.315.616.2]Mitogenome diversity, intraspecific relationships and genetic differentiation
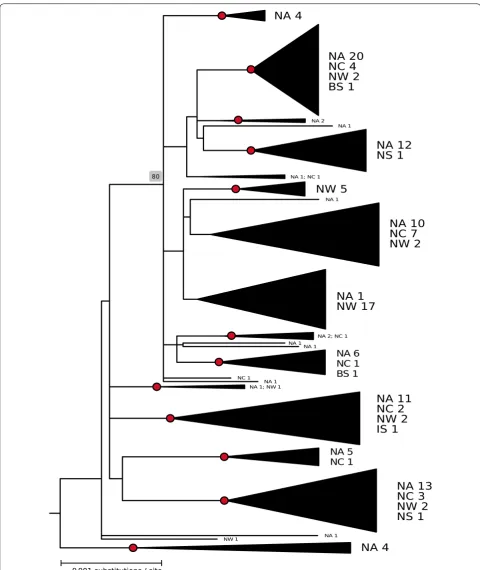
The alignment of 156 available cod mitogenomes resulted in 15,592 common sites following the exclusion of align-ment gaps. There were 1002 polymorphic sites, and 1034 substitutions in total among the mitogenome sequences. The nucleotide diversity index was slightly lower for cod in the northwest Atlantic (0.203%) compared to station-ary and migratory cod in the northeast Atlantic (0.291 and 0.285%, respectively; Table 1). Tajima’s D statis-tic was significantly negative for all population subsets, rejecting the null hypothesis of stable populations with no selection. A representative maximum likelihood (ML) tree is shown in Fig. 2. Twelve clades were supported in > 80% of bootstrap replications, but there was not a clear geographic structuring of clades. However, while some clades were dominated by NA and NC cod individuals, others harboured mainly NW cod (Fig. 2). Measures of pairwise genetic differentiation were negative (inter-preted as nil) between NA and NC cod in the northeast Atlantic, while NW cod were differentiated from both NC and NA cod (FST of approximately 0.06 and 0.09,
respectively; Additional file 7: Table S5).
Discussion
Here we provide a comprehensive SNP map of the Atlantic cod mitochondrial genome based on 124 com-pletely sequenced mtDNAs. The 952 variable sites iden-tified among 124 specimens were not evenly distributed throughout the mitogenome. Structural RNA genes have a significantly lower density of overall SNPs per site and variable sites per position compared to protein coding genes. Furthermore, the ND2 gene and the COII gene were the least and most conserved, respectively, among the protein coding genes. This feature was also observed at the protein level. Thus, the Atlantic cod mitogenome
follow a similar pattern of conservation as seen for, e.g. zebrafish [19] or humans [20, 21].
One hundred and twenty-four cod individuals har-boured substantial sequence variation in their mitog-enomes, including 349 phylogenetically informative parsimony sites. Phylogenetic analysis of 156 available mitogenomes identified ten haplotype clusters supported by high bootstrap values, but little phylogeographic structuring. Mitogenome evolution in cod seems to be nearly neutral [8, 12], suggesting that the significantly negative Tajima’s D statistic mainly signifies recent demo-graphic change, rather than selection. The differentiation of certain cod populations into so-called ecotypes defined by migratory and stationary behaviour, most notably NC and NA cod in the northeastern Atlantic, has long been a conundrum [11]. Recently, it was shown that these ecotypes are associated with genomic islands of differen-tiation, inferred to reside within chromosomal inversions in at least four linkage groups [22, 23]. It is conceivable that such genomic regions could preclude recombina-tion and break-up of co-adapted genes within them, and thus make it possible for locally adapted ecotypes to per-sist in the face of continued gene flow. Similar chromo-somal inversions, suggesting a common ancestry, were subsequently found to contribute to ecotype divergence in the western Atlantic as well [24]. The mitogenome data indicate some differentiation between western and east-ern cod, but a lack of differentiation between NC and NA cod. This would be consistent with isolation by distance and some gene flow between ecotypes in their mitochon-drial genes and neutrally evolving parts of the nuclear genome. Thus, the geographic structuring of mitoge-nome variation in cod seems to be governed mainly by demographic and stochastic processes in a species with high fecundity and variance in offspring number, much in line with Árnason’s conclusions based on CytB sequences [9].
Conclusion
Our study provides a mitochondrial genome resource obtained from Atlantic cod tissue samples collected at site of fisheries in the North Atlantic Ocean. Phylogeo-graphic analyses based on 156 mitochondrial genomes did not reveal a clear structure, but eastern and western cod were differentiated. Mitochondrial genome diversity was higher in the eastern than the western Atlantic, sug-gesting deviating population histories.
Limitations
[image:4.595.57.290.594.665.2]The SNP map of the Atlantic cod mitochondrial genome consisted of 952 polymorphic sites among the 124 specimens studied here, and 1002 polymor-phic sites among 156 available mitogenomes from Table 1 Population genetic parameters of Atlantic cod
based on the alignment of nearly complete mitochondrial DNA sequences
Sites with alignment gaps were excluded from the alignment of 16,551 positions in all subsets resulting in 15,592 common sites. NW, cod from the north west Atlantic (N = 32); NC, cod from the north east Atlantic of the coastal stationary ecotype (N = 25); NA, Arctic cod from the Barents Sea of the migratory ecotype (N = 97); π %, percent nucleotide diversity; S, number of segregating sites; η, total number of substitutions; k, average number of pairwise nucleotide differences; TD, Tajima’s D statistic. * P < 0.05; ** P < 0.01; *** P < 0.001
π % S η k TD
the western and eastern parts of the Atlantic Ocean. A more exhaustive SNP map of the cod mitogenome would most certainly require a substantial increase in the number of mitogenomes collected from the vast distribution range of the species.
Abbreviations
CO: cytochrome oxidase; CR: control region; CytB: cytochrome b; LSU: large subunit; ML: maximum likelighood; mtDNA: mitochondrial DNA; ND: NADH dehydrogenase; SNP: single nucleotide polymorphism; SSU: small subunit.
Authors’ contributions
TEJ, BOK, ÅE, RB, MA, MN, AU, DHC, TM and SDJ organized the sequencing of the mitochondrial genomes. TBR, AJN and KSJ provided mitogenomes sequenced by Illumina and 454 sequencing. TEJ, BOK, LMJ, JTN, TM, SDJ con-tributed to mtDNA sequence analyses. SDJ directed the research in collabora-tion with JTN and TM. SDJ wrote the paper in collaboracollabora-tion with all authors. All authors read and approved the final manuscript.
Author details
1 Genomics Group, Faculty of Biosciences and Aquaculture, Nord University, 8049 Bodø, Norway. 2 Research Laboratory and Department of Laboratory Medicine, Nordland Hospital, Bodø, Norway. 3 Department of Medical Biology, Faculty of Health Sciences, UiT–Arctic University of Norway, Tromsø, Norway. 4 Centre for Ecological and Evolutionary Syntheses (CEES), Department of Bio-sciences, University of Oslo, Oslo, Norway.
Acknowledgements
We thank Espen Olsen, Morten Krogstad, Espen Søreng, Ove Nicolaisen, Agnieszka Kijewska, Bill Hutchinson, Sherrylynn Rowe, Asgeir Aglen, and Fran-cois Botha for the contribution of Atlantic cod specimen samples.
Competing interests
The authors declare that they have no competing interests.
Availability of data
Accession numbers of mitogenomes are available at ENA under the study Accession Number PRJEB23234/ERP104973.
Consent for publication Not applicable. Additional files
Additional file 1: Table S1. Geographical distribution of completely sequenced Atlantic cod mitogenomes.
Additional file 2: Table S2. Mitochondrial CytB haplotypes generated from 124 complete Atlantic cod mitogenomes.
Additional file 3: Table S3. Non-synonymous substitutions in 124 Atlan-tic cod mitogenomes.
Additional file 4: Table S4. Key features of SNPs in 124 complete Atlantic cod mitogenomes.
Additional file 5: Figure S1. Complete secondary structure diagram of Atlantic cod mitochondrial small subunit rRNA. Variable positions among the 124 complete Atlantic cod mitogenomes are indicated, as well as frequency (%) and variable sites (red boxes).
Additional file 6: Figure S2. Complete secondary structure diagram of Atlantic cod mitochondrial large subunit rRNA. (A) Domains O and II. (B) Domains III and IV. (C) Domains V and VI. Variable positions among the 124 complete Atlantic cod mitogenomes are indicated, as well as frequency (%) and variable sites (red boxes).
Additional file 7: Table S5. Genetic differentiation among population subsets defined by geography and ecotype based on nearly complete mitochondrial DNA sequences.
Ethics approval and consent to participate
Fish tissue samples were obtained at site of fisheries, and do not involve research on animals. In general, this study was carried out in accordance with ethical guidelines stated by the Norwegian Ministry of Agriculture and Food through the Animal Welfare Act.
Funding
This work was supported by grants from the Norwegian Research Council (GenoFisk), Nord University, and the Arctic University of Norway-UiT.
Publisher’s Note
Springer Nature remains neutral with regard to jurisdictional claims in pub-lished maps and institutional affiliations.
Received: 18 April 2018 Accepted: 15 June 2018
References
1. Johansen SD, Coucheron DH, Andreassen M, Karlsen BO, Furmanek T, Jørgensen TE, Emblem Å, Breines R, Nordeide JT, Moum T, Nederbragt AJ, Stenseth NC, Jakobsen KS. Large-scale sequence analyses of Atlantic cod. N Biotechnol. 2009;25:263–71.
2. Star B, Nederbragt AJ, Jentoft S, Grimholt U, Malmstrøm M, Gregers TF, Rounge TB, Paulsen J, Solbakken MH, Sharma A, Wetten OF, Lanzén A, Winer R, Knight J, Vogel JH, Aken B, Andersen O, Lagesen K, Tooming-Klunderud A, Edvardsen RB, Tina KG, Espelund M, Nepal C, Previti C, Karlsen BO, Moum T, Skage M, Berg PR, Gjøen T, Kuhl H, Thorsen J, Malde K, Reinhardt R, Du L, Johansen SD, Searle S, Lien S, Nilsen F, Jonassen I, Omholt SW, Stenseth NC, Jakobsen KS. The genome sequence of Atlantic cod reveals a unique immune system. Nature. 2011;477:207–10. 3. Tørresen OK, Star B, Jentoft S, Reinar WB, Grove H, Miller JR, Walenz BP,
Knight J, Ekholm JM, Peluso P, Edvardsen RB, Tooming-Klunderus A, Skage M, Lien S, Jakobsen KS, Nederbragt AJ. An improved genome assem-bly uncovers prolific tandem repeats in Atlantic cod. BMC Genomics. 2017;18:95.
4. Boore JL. Animal mitochondrial genomes. Nucleic Acids Res. 1999;27:1767–80.
5. Johansen S, Bakke I. The complete mitochondrial DNA sequence of Atlantic cod (Gadus morhua): relevance to taxonomic studies among codfishes. Mol Mar Biol Biotechnol. 1996;5:203–14.
6. Jørgensen TE, Johansen SD. Expanding the coding potential of vertebrate mitochondrial genomes: lesson learned from the Atlantic cod. In: Mattila M, editor. Mitochondrial DNA—New Insights. New York: InTech Open; 2018.
7. Jørgensen TE, Bakke I, Ursvik A, Andreassen M, Moum T, Johansen SD. An evolutionary preserved intergenic spacer in gadiform mitogenomes generates a long noncoding RNA. BMC Evol Biol. 2014;14:182. 8. Karlsen BO, Emblem Å, Jørgensen TE, Klingan KA, Nordeide JT, Moum T,
Johansen SD. Mitogenome sequence variation in migratory and station-ary ecotypes of North-east Atlantic cod. Mar Genomics. 2014;15:103–8. 9. Árnason E. Mitochondrial cytochrome b DNA variation in the
high-fecundity Atlantic cod: trans-Atlantic clines and shallow gene genealogy. Genetics. 2004;166:1871–85.
10. Carr SM, Marshall HD. Intraspecific phylogeographic genomics from mul-tiple complete mtDNA genomes in Atlantic cod (Gadus morhua): origins of the ‘codmother’, transatlantic vicariance and midglacial population expansion. Genetics. 2008;180:381–9.
11. Nordeide JT, Johansen SD, Jørgensen TE, Karlsen BO, Moum T. Popula-tion connectivity among migratory and staPopula-tionary cod Gadus morhua in the Northeast Atlantic—a review of 80 years of study. Mar Ecol Prog Ser. 2011;435:269–83.
12. Marshall HD, Coulson MW, Carr SM. Near neutrality, rate heterogeneity, and linkage govern mitochondrial genome evolution in Atlantic cod (Gadus morhua) and other gadine fish. Mol Biol Evol. 2009;26:579–89. 13. Breines R, Ursvik A, Nymark M, Johansen SD, Coucheron DH. Complete
•fast, convenient online submission •
thorough peer review by experienced researchers in your field • rapid publication on acceptance
• support for research data, including large and complex data types •
gold Open Access which fosters wider collaboration and increased citations maximum visibility for your research: over 100M website views per year •
At BMC, research is always in progress.
Learn more biomedcentral.com/submissions
Ready to submit your research? Choose BMC and benefit from:
14. Kirubakaran TG, Grove H, Kent MP, Sandve SR, Baranski M, Nome T, De Rosa MC, Righino B, Johansen T, Otterå H, Sonesson A, Lien S, Andersen Ø. Two adjacent inversions maintain genomic differentiation between migratory and stationary ecotypes of Atlantic cod. Mol Ecol. 2016;25:2130–43.
15. Ursvik A, Breines R, Christiansen JS, Fevolden S-E, Coucheron DH, Johansen SD. A mitogenomic approach to the taxonomy of pollocks:
Theragra chalcogramma and T. finnmarchica represent one single species. BMC Evol Biol. 2007;7:87.
16. Notredame C, Higgins DG, Heringa J. T-Coffee: a novel method for fast and accurate multiple sequence alignment. J Mol Biol. 2001;302:205–17. 17. Tamura K, Stecher G, Peterson D, Filipski A, Kumar S. MEGA6: molecular
evolutionary genetics analysis version 6.0. Mol Biol Evol. 2013;30:2725–9. 18. Rozas J, Ferrer-Mata A, Sánchez-DelBarrio JC, Guirao-Rico S, Librado P,
Ramos-Onsins SE, Sánchez-Gracia A. DnaSP 6: DNA sequence polymor-phism analysis of large data sets. Mol Biol Evol. 2017;34:3299–302. 19. Flynn T, Signal B, Johnson SL, Gemmell NJ. Mitochondrial genome
diver-sity among six laboratory zebrafish (Danio rerio) strains. Mitochondrial DNA Part A. 2016;27:4364–71.
20. Ingman M, Gyllenstein U. Analysis of the complete human mtDNA genome: methodology and inferences for human evolution. J Heredity. 2001;92:454–61.
21. Diroma MA, Calabrese C, Simone D, Santorsola M, Calabrese FM, Gasparre G, Attimonelli M. Extraction and annotation of human mitochondrial genomes from 1000 genomes whole exome sequencing data. BMC Genomics. 2014;15(Suppl 3):S2.
22. Karlsen BO, Klingan K, Emblem Å, Jørgensen TE, Jüterbock A, Fur-manek T, Hoarau G, Johansen SD, Nordeide JT, Moum T. Genomic divergence between migratory and stationary Atlantic cod. Mol Ecol. 2013;22:5098–111.
23. Berg PR, Star B, Pampoulie C, Sodeland M, Barth JMI, Knutsen H, Jakobsen KS, Jentoft S. Three chromosomal rearrangements promote genomic divergence between migratory and stationary ecotypes of Atlantic cod. Scient Rep. 2016;6:23246.