R E S E A R C H A R T I C L E
Open Access
Unplanned readmission or death after
discharge for Aboriginal and
non-Aboriginal people with chronic disease in
NSW Australia: a retrospective cohort study
Amanda Jayakody
1,2,3*, Christopher Oldmeadow
4,5, Mariko Carey
1,2,3, Jamie Bryant
1,2,3, Tiffany Evans
4,5,
Stephen Ella
6, John Attia
4,5and Rob Sanson-Fisher
1,2,3Abstract
Background:Admitted patients with chronic disease are at high risk of an unplanned hospital readmission, however, little research has examined unplanned readmission among Aboriginal people in Australia. This study aimed to examine whether rates of unplanned 28 day hospital readmission, or death, significantly differ between Aboriginal and non-Aboriginal patients in New South Wales, Australia, over a nine-year period.
Methods:A retrospective cohort analysis of a sample of de-identified linked hospital administrative data was conducted. Eligible patients were: 1) aged≥18 years old, 2) admitted to an acute facility in a NSW public hospital between 30th June 2005 and 1st July 2014, and 3) admitted with either cardiovascular disease, chronic respiratory disease, diabetes or renal disease. The primary composite outcome was unplanned readmission or death within 28 days of discharge. Generalized linear models and a test for trend were used to assess rates of unplanned readmission or death over time in Aboriginal and non-Aboriginal patients with chronic disease, accounting for sociodemographic variables.
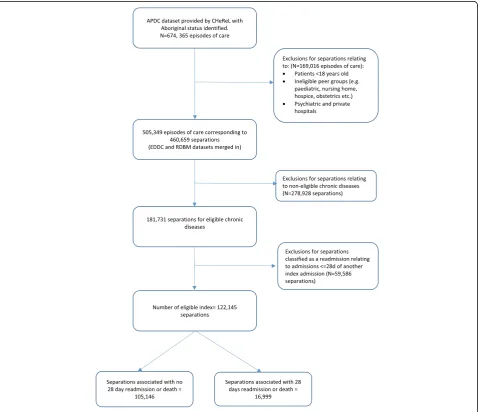
Results:The final study cohort included 122,145 separations corresponding to 48,252 patients (Aboriginal = 57.2%, n= 27,601; non-Aboriginal = 42.8%,n= 20,651). 13.9% (n= 16,999) of all separations experienced an unplanned readmission or death within 28 days of discharge. Death within 28 days of discharge alone accounted for only a small number of separations (1.4%;n= 1767). Over the nine-year period, Aboriginal separations had a significantly higher relative risk of an unplanned readmission or death (Relative risk = 1.34 (1.29, 1.40);p-value < 0.0001) compared with non-Aboriginal separations once adjusted for sociodemographic, disease variables and restricted to < 75 years of age. A test for trend, including an interaction between year and Aboriginal status, showed there was no statistically significant change in proportions over the nine-year period for Aboriginal and non-Aboriginal separations (p-value for trend = 0.176).
Conclusion:Aboriginal people with chronic disease had a significantly higher risk of unplanned readmission or death 28 days post discharge from hospital compared with non-Aboriginal people, and there has been no significant change over the nine year period. It is critical that effective interventions to reduce unplanned readmissions for Aboriginal people are identified.
Keywords:Aboriginal health, Unplanned readmission, Health services research, Data linkage, Chronic disease
* Correspondence:amanda.jayakody@uon.edu.au
1Health Behaviour Research Collaborative, School of Medicine and Public Health, Faculty of Health and Medicine, University of Newcastle, Callaghan, NSW 2308, Australia
2Priority Research Centre for Health Behaviour, University of Newcastle, Callaghan, NSW, Australia
Full list of author information is available at the end of the article
Background
On average Aboriginal and Torres Strait Islander people (Aboriginal people hereafter)1experience, on average, a 10 year gap in life expectancy compared with non-Aboriginal Australians. Two thirds of this gap is accounted for by chronic disease [1]. Chronic diseases in Aboriginal people are both more prevalent and occur at a much younger age[1,2]. Aboriginal people have higher self-reported rates of cardiovascular disease, respiratory disease, diabetes and renal disease than non-Aboriginal people [1,2].
Although most chronic diseases should ideally be managed in the community health setting, admissions to hospital related to chronic disease are common and represent the largest proportion of potentially avoidable hospitalisations [3]. Factors such as poor discharge planning, poor community follow up from health care services, and a lack of support for the patient and carer in chronic disease self-management skills mean that many hospital admissions for chronic disease are followed by an unplanned hospital readmission [4–8]. Unplanned read-missions are defined as adread-missions to hospital which were not planned and which usually occur within one month of discharge from an initial (i.e. index) admission [9,10]. Un-planned readmissions are a financial burden to the health system, and cause an emotional and time burden on pa-tients and their families [11, 12]. Admitted patients with chronic disease are known to be at high risk of an un-planned hospital readmission, with readmission highest amongst patients with cardiovascular disease, respiratory disease and diabetes [11,13,14]. In the Australian state of New South Wales (NSW) 13% of patients with COPD and 9% of patients with CHF were readmitted within 28 days [3]. In Australia, unplanned readmissions are considered an indicator relating to“high quality and affordable hos-pital and hoshos-pital related care”in the Australian National Healthcare Agreement, and unplanned readmissions are included in the NSW service performance indicators to provide a mechanism for monitoring and managing the performance of hospitals [9,15].
However there is limited knowledge of the rate of un-planned readmission for Aboriginal people with chronic disease. In a NSW Chief Health Officer’s report on the health of Aboriginal people of NSW, the all-cause (all medical and surgical) unplanned readmission rate within 28 days for Aboriginal people was 8.1% (compared with 6.3% for non-Aboriginal people) [9]. The all-cause re-admission rate has remained consistently higher for Abo-riginal people [9]. However little is known regarding the patterns over time for unplanned readmissions amongst Aboriginal people with chronic disease. An analysis of re-admission rates within one regional western NSW hospital found the proportion of Aboriginal patients readmitted to hospital had increased from 11.7% in 1996 to 18.3% in 2005, however there was no significant trend over time
[16]. This analysis did not look specifically at trends in chronic diseases for Aboriginal patients, and the data may not be representative of NSW Aboriginal people as a whole.
Given the high burden of chronic disease and high rates of unplanned readmission rates among Aboriginal people, there is a need for more specific analysis of unplanned readmissions related to chronic disease in order to identify potential differences and patterns amongst Aboriginal and non-Aboriginal people over time. The purpose of our study was to examine amongst Aboriginal and non-Aboriginal people with chronic disease in NSW from 2005/6 to 2014/15: 1) whether the proportion of separations with an un-planned 28 day readmission or death significantly differ between Aboriginal and non-Aboriginal patients; 2) the extent to which sociodemographic, disease and separ-ation factors are associated with any differences; and 3) how the proportion of separations with an unplanned 28 day hospital readmission or death changed over the nine-year period.
Methods Ethics approval
The study was approved by the NSW Population & Health Services Research Ethics Committee (HREC/15/ CIPHS/18) and the NSW Aboriginal Health and Medical Research Council Ethics Committee (1090/15).
Study design and data sources
This study was a retrospective cohort analysis of de-identified linked hospital administrative data. The linked data were derived from three datasets:
1) NSW Admitted Patient Data Collection (APDC): the APDC contains records of all admitted patient services provided by NSW public hospitals, private hospitals/centres and psychiatric hospitals. 2) NSW Emergency Department Data Collection
(EDDC): the EDDC contains records for patient presentations to emergency departments in NSW public hospitals.
3) NSW Registrar of Births, Deaths and Marriages (RBDM): the RBDM contains mortality information for the NSW population.
Study sample Eligibility criteria
or additional diagnosis: cardiovascular disease, diabetes, respiratory disease and renal diseases (See Additional file 1 for a list of ICD-10 codes). Figure 1 outlines how the dataset was generated.
Sampling
All patients meeting the eligibility criteria who had at least one APDC separation in the period of interest, and where status was recorded as Aboriginal and/or Torres Strait Islander person on any APDC record were selected. In order to obtain a comparison sample of non-Aboriginal persons, a sampling frame was then generated consisting of a list of patients meeting the eligibility criteria recorded in the APDC, excluding the list of Aboriginal persons obtained above. A random sample of person identification numbers (of the same number as the Aboriginal cases) was selected from the sampling frame, forming the
non-Aboriginal patient sample. These patients had no APDC records with Aboriginality coded as ‘yes’. EDDC and RBDM death records which linked to the patients were extracted and included in the final sample.
Data linkage
The data sources were linked by the Centre for Health Record Linkage using probabilistic record linkage methods [17]. All data were provided in a de-identified format. The data were supplied as episodes of care. Each episode of care ends with a statistical discharge; each stat-istical discharge occurs due to discharge, death, transfer, or change of care type.
Data cleaning
Duplicate records were excluded. Separations were de-fined by combining nested, overlapping and contiguous
[image:3.595.60.540.306.718.2]episodes of care creating periods for which patients were hospitalised. Therefore separations are defined as the total hospital stay (from admission to discharge from hospital). For our analyses we retained the diagnosis codes and admission data from the first episode of each separation, but our discharge date, from which 28 day readmission or death is considered, was the latest dis-charge date for the period of hospitalisation. The unit of analysis was separations.
Variables
Primary outcome: The primary composite outcome was all-cause unplanned hospital readmission or death within 28 days of separation from any acute facility in a NSW public hospital. An unplanned readmission is de-fined as occurring within 28 days of discharge from an initial (i.e. index) admission. ‘Unplanned’refers to sepa-rations coded as an ‘emergency status recode’ in the APDC. Readmissions due to mental health, cancer, hos-pital in home care, chemotherapy or dialysis were ex-cluded. Separations were excluded if death occurred during admission or if the patient was discharged to pal-liative care. Sensitivity analyses were conducted to exam-ine the effect of deaths or discharge to palliative care during admission which is described in the statistical analysis section. Each subsequent separation that fell outside of the 28 day timeframe was counted as a new index separation (see Fig. 1). All-cause readmission or death was calculated as follows: Numerator: total num-ber of 28 day unplanned readmission or death for any cause associated with an eligible index admission. De-nominator: number of admissions with an included chronic disease (principal or additional diagnosis) and an index admission.
Explanatory variables
The following explanatory variables correspond to those recorded at the beginning of each separation.
1. Sociodemographic variables: Patient’s gender, age, Aboriginal status and marital status. The
Accessibility/Remoteness Index of Australia (ARIA) and the Index of Relative Socio-economic Disad-vantage (IRSD) quintile were also included. ARIA is the standard Australian Bureau of Statistics (ABS) endorsed measure of remoteness and is derived from measures of road distances between populated localities and service centres [18]. The IRSD is a general socio-economic index that summarises a range of information about the economic and social conditions of people and households within a geographic area [19].
2. Disease-related variables: the Charlson Co-morbidity Index (CCI) was included [20]. The CCI is an index
of the risk of mortality from comorbidity during the next 12 months and calculates a score from second-ary diagnoses of admissions weighted for type of con-dition. The CCI scores were dichotomised into three groups of 0, 1 and 2 or more. Zero indicating the lowest score and 2 or more indicating the highest scores.
3. Separation variables: The following variables were included for each hospital separation: financial year of separation and length of stay (days).
Statistical analysis
Chi-square and t-tests were used to examine crude associ-ations between Aboriginal status and sociodemographic, disease and separation factors. A log-binomial generalised linear model (GLM) was used to determine the associ-ation between Aboriginal status and unplanned readmis-sion or death over the nine year period, and then restricted to patients aged≤75 years due to the differential age structures between Aboriginal and non-Aboriginal pa-tients. Exponentiated parameter estimates from this model (interpreted as relative risks) are presented together with 95% confidence intervals andp-values. A propensity score analysis was conducted to account for potential selec-tion bias due to differences in the probability of dying during admission to hospital between Aboriginal and non-Aboriginal people [21]. The propensity score was estimated using a logistic regression model (death in hospital or discharged to palliative care as the outcome, sociodemographic, disease and separation factors as predictors), and stabilised propensity scores were used as weights (inverse probability of “treatments”) in the GLM. Unplanned readmission or death within 28 days trends over the study period were assessed by including a term for financial year (as a continuous variable) in the GLM, as well as an interaction term between Abori-ginal status and year, which assessed differences in the trends by Aboriginal status. The model was adjusted for sociodemographic and disease variables. A sensitivity ana-lysis was conducted to examine any potential differences in results obtained using an all-cause compared to a chronic disease specific readmission rate. All analyses used Stata V.11.2 [22].
Results
higher proportion of female separations, compared with non-Aboriginal separations. A smaller proportion of Abo-riginal separations corresponded to individuals who were married or in a de facto relationship compared with non-Aboriginal separations. Compared to non-Aboriginal separations, there were a higher proportion of separations associated with diabetes and chronic respiratory disease among Aboriginal separations. Cardiovascular disease was significantly higher amongst non-Aboriginal separations and is evidenced in the higher Charlson comorbidity index which gives greater weight to cardiovascular disease. A
higher proportion of Aboriginal separations correspond to individuals residing in the most disadvantaged geographic and remote/very remote areas of NSW. Aboriginal separa-tions had a lower average length of stay compared with non-Aboriginal separations.
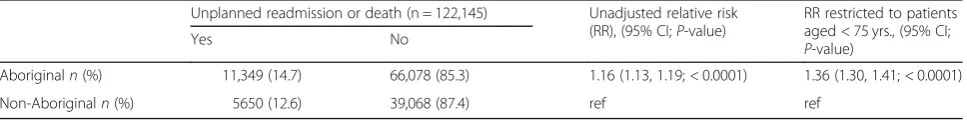
[image:5.595.58.542.100.586.2]13.9% (n= 16,999) of all separations experienced an un-planned readmission or death within 28 days of discharge. Death within 28 days of discharge accounted for only a small number of separations overall (1.4%; n= 1767). An unadjusted regression, demonstrated that Aboriginal sepa-rations had a significantly higher risk of an unplanned
Table 1Characteristics of separations by Aboriginal status (n= 122,145)
Aboriginal (n= 77,427)
n(%)
Non-Aboriginal (n= 44,718)
n(%) p
-value
Sex % Female 42,982 (55.5) 22,422 (50.1) > 0.001
Age Mean (SD) 53.5 (16.5) 66.7 (17.9) > 0.001
Marital status Married/de facto 30,992 (40.1) 23,815 (53.3) > 0.001
Single 25,178 (32.5) 5673 (12.7)
Widowed 9385 (12.1) 9884 (22.1)
Divorced/separated 10,434 (13.5) 4720 (10.6)
Not known 1372 (1.8) 592 (1.3)
Chronic diseases present at admission Diabetes 32,865 (39.5) 11,853 (26.5) > 0.001
Chronic respiratory disease 15,403 (19.9) 6135 (13.7) < 0.0001
Cardiovascular disease 41,977 (54.2) 29,231 (65.4) < 0.0001
Renal disease 20,133 (26.0) 12,638 (28.3) < 0.0001
Charlson Co-morbidity Index score 0 43,888 (56.7) 25,454 (56.9) < 0.0001
1 18,835 (24.3) 9979 (22.3)
2+ 14,704 (19.0) 9285 (20.8)
IRSD 1st quintile - most disadvantaged 19,505 (25.2) 5823 (13.0) < 0.0001
2nd quintile 22,584 (29.2) 10,529 (23.6)
3rd quintile 16,701 (21.6) 8788 (19.7)
4th quintile 14,286 (18.5) 9985 (22.3)
5th quintile - least disadvantaged 4351 (5.6) 9593 (21.4)
ARIA Highly Accessible (major cities) 29,855 (38.6) 31,521 (70.5) < 0.0001
Accessible (inner regional) 29,132 (37.6) 10,348 (23.1)
Moderately Accessible (outer regional) 13,692 (17.7) 2560 (5.7)
Remote / Very Remote 4748 (6.1) 289 (0.7)
Year of separation 2005–06 7547 (10.3) 4680 (11.2) < 0.0001
2006–07 7840 (10.7) 4719 (11.3)
2007–08 7980 (10.9) 4693 (11.2)
2008–09 6905 (9.5) 4143 (9.9)
2009–10 7041 (9.6) 4169 (10.0)
2010–11 7010 (9.6) 4061 (9.7)
2011–12 7807 (10.7) 4343 (10.4)
2012–13 10,243 (14.0) 5391 (12.9)
2013–14 10,643 (14.6) 5644 (13.5)
readmission or death within 28 days of discharge com-pared with non-Aboriginal separations (Table 2; Relative risk (RR) = 1.16; 95% confidence intervals (CI):1.13, 1.19;
p-value: < 0.0001). To account for the younger age distribution in Aboriginal people compared with non-Aboriginal people, the model was restricted to people aged < 75 years old. This resulted in the relative risk increasing to 1.36 (95% CI:1.30, 1.41;p-value: < 0.0001). A sensitivity analysis, was conducted to examine any potential differ-ences between using an all-cause compared to a chronic disease specific readmission rate, and results were broadly similar.
Propensity score weighted analyses
Aboriginal people were significantly less likely to die dur-ing admission or be discharged to palliative care compared with non-Aboriginal people (Odds ratio = 0.73; 95% CI: 0.68, 0.79; < 0.001; AUC = 0.7714; pseudo R2 = 0.1096). Sample weights were created using a stabilised propensity score to account for the potential selection bias due to the difference in probability of dying during admission. The propensity score sample weight was included in the fol-lowing regression analyses whilst separations which ended in death during admission or the patient being discharged to palliative care were excluded from the analysis (2.84%,
n= 3570).
Adjusted regression analyses
Table 3 shows the unadjusted and adjusted regression models examining the effect of sociodemographic and disease variables on the association of Aboriginal status and unplanned readmission or death. Aboriginal sepa-rations continued to have a significantly higher risk of an unplanned readmission or death compared with non-Aboriginal separations once adjusted for sociode-mographic (including the age restriction) and disease variables, including the propensity score sampling weight (RR = 1.34; CI:1.29, 1.40; p < 0.0001). Length of stay was not included in the final model because of the direction of its relationship with Aboriginal status and readmission. Although it was associated with both Abo-riginal status and readmission, a sensitivity analysis in-cluding length of stay in the adjusted model showed that the overall results were broadly similar. Apart from fi-nancial year, all sociodemographic and disease variables
remained significantly associated with readmission after controlling for all variables in the table.
Figure 2 displays the raw proportions and predicted probabilities (obtained from the final GLM model shown in Table4) of unplanned readmission or death by Aborigi-nal status. There was no statistically significant change in the proportion of separations that resulted in an un-planned readmission or death over the nine-year period for Aboriginal and non-Aboriginal separations (p-value for trend = 0.176). The apparent gap between the fitted values and raw proportions are due to the fact that the fit-ted values are adjusfit-ted for sociodemographic variables.
Discussion
This paper provides unique data on unplanned hospital readmission or death over a nine year period amongst a large cohort of Aboriginal and non-Aboriginal patients with chronic disease. To our knowledge, such an over-view of unplanned readmission by Aboriginal people with chronic disease has not been undertaken before in Australia.
[image:6.595.57.541.672.732.2]Aboriginal people with chronic disease have a signifi-cantly higher risk of an unplanned readmission or death within 28 days of discharge compared with non-Aboriginal people. This higher rate of unplanned readmission or death has remained unchanged over the nine year period ex-amined. Direct comparisons of our estimates with other studies are challenging because of a paucity of compar-able data analyses for unplanned readmissions in Abori-ginal Australians with chronic disease. However when considering readmissions for any-cause, our findings are consistent with NSW government data which re-ports significantly higher rates of all-cause (medical and surgical) unplanned readmissions rates between Abori-ginal and non-AboriAbori-ginal people, and that this rate has not significantly changed from 2005 to 2011 [9]. How-ever the chronic disease readmission rates reported in our analysis are higher compared to readmissions for any cause. Our findings are consistent with other broader ana-lyses of hospitalisation patterns among Aboriginal people with chronic disease which also report significantly higher rates of unavoidable or potentially preventable hospita-lisations in Aboriginal with chronic disease compared with non-Aboriginal people [23, 24]. Yet these studies do not consider unplanned readmissions which measure a distinctly different indicator compared to unavoidable
Table 2Differences in separations that resulted in an unplanned readmission or death by Aboriginal status, for the period 2005/ 6–2013/14
Unplanned readmission or death (n = 122,145) Unadjusted relative risk (RR), (95% CI;P-value)
RR restricted to patients aged < 75 yrs., (95% CI;
P-value)
Yes No
Aboriginaln(%) 11,349 (14.7) 66,078 (85.3) 1.16 (1.13, 1.19; < 0.0001) 1.36 (1.30, 1.41; < 0.0001)
hospitalisations which generally reflects sub-optimal com-munity health care, compared to unplanned readmissions which reflect a combination of poor hospital care as well as poor community follow up.
Our findings showed that unplanned readmission or death in Aboriginal people remained significantly higher than the non-Aboriginal rates, even once ad-justed for sociodemographic, disease and admission variables, and for potential selection bias. The fact that Aboriginal status remains a significant risk factor, even after accounting for other variables, is consistent with chronic disease preventable hospitalisation studies in
[image:7.595.57.540.109.569.2]Aboriginal people, [23,25] and the international literature which shows significant associations with ethnicity and readmission even after adjusting for sociodemographic or disease factors [26–28]. However considering the socio-demographic profile of Aboriginal patients with chronic disease is informative for program planning. Our study found a higher proportion of Aboriginal patients were fe-male, younger, more likely to be single, live in the most disadvantaged and remote areas of NSW. This difference in socio-demographic profile should be considered in strategies aimed at reducing unplanned readmissions in Aboriginal people with chronic disease.
Table 3Unadjusted and adjusted GLM regression models of unplanned readmission or death by Aboriginal status for the study period 2005/6 to 2013/14
Unplanned readmission or death Relative risks (RR) (95% CI)
Unadjusted RR with propensity score (PS) weight
Unadjusted RR without PS weight
AdjustedaRR with PS weight
AdjustedaRR without PS weight
AdjustedaRR with PS weight and restricted to < 75 years
P-value
Aboriginal status
Non-Aboriginal ref ref ref Ref red
Aboriginal 1.15 (1.12, 1.19) 1.16 (1.13, 1.20) 1.29 (1.24, 1.33) 1.29 (1.24, 1.33) 1.34 (1.29, 1.40) < 0.0001
Year 1.00 (0.99, 1.01) 1.00 (0.99, 1.01) 1.00 (0.99, 1.01) 1.00 (0.99, 1.01) 1.00 (0.99, 1.01) 0.529
Gender – – –
Male – – ref ref ref
Female – – 0.89 (0.86, 0.92) 0.89 (0.86, 0.91) 0.87 (0.84, 0.90) < 0.0001
Age – – 1.01 (1.01, 1.01) 1.01 (1.01, 1.01) 1.01 (1.00, 1.01) < 0.0001
Marital status – –
Married – – ref ref ref
Single – – 1.19 (1.15, 1.24) 1.20 (1.15, 1.24) 1.20 (1.15, 1.25) < 0.0001
Widowed – – 1.18 (1.13, 1.23) 1.18 (1.13, 1.23) 1.21 (1.13, 1.28) < 0.0001
Divorced/separated – – 1.15 (1.10, 1.20) 1.15 (1.10, 1.20) 1.18 (1.12, 1.24) < 0.0001
Not known – – 0.92 (0.81, 1.05) 0.93 (0.82, 1.06) 0.97 (0.84, 1.12) 0.685
IRSD
1st quintile - most disadvantaged – – ref ref ref
2nd quintile – – 0.94 (0.90, 0.98) 0.94 (0.90, 0.98) 0.94 (0.90, 0.99) < 0.05
3rd quintile – – 0.94 (0.90, 0.99) 0.94 (0.90, 0.99) 0.93 (0.88, 0.98) < 0.05
4th quintile – – 0.93 (0.88, 0.98) 0.93 (0.88, 0.98) 0.94 (0.88, 0.99) < 0.05
5th quintile–least disadvantaged – – 0.88 (0.83, 0.94) 0.88 (0.83, 0.94) 0.80 (0.74, 0.87) < 0.0001
ARIA
Highly Accessible – – ref ref ref
Accessible – – 0.93 (0.89, 0.96) 0.93 (0.89, 0.96) 0.93 (0.90, 0.97) > 0.01
Moderately Accessible – – 0.87 (0.84, 0.93) 0.87 (0.84, 0.93) 0.87 (0.82, 0.92) < 0.0001
Remote/Very Remote – – 0.67 (0.61, 0.73) 0.67 (0.61, 0.73) 0.65 (0.59, 0.72) < 0.0001
Charlson Index score
0 – – ref ref ref
1 – – 1.43 (1.38, 1.48) 1.43 (1.38, 1.48) 1.45 (1.39, 1.51) < 0.0001
2+ – – 1.63 (1.57, 1.69) 1.63 (1.57, 1.69) 1.69 (1.62, 1.77) < 0.0001
a
The fact that the significant difference in readmission or death rates has consistently remained over the nine years highlights the ongoing disparity between Aboriginal and non-Aboriginal health outcomes. Therefore, further tar-geted programs need to address the gap in effective care for high risk Aboriginal patients with chronic disease. The high prevalence of chronic diseases among patients, par-ticularly the presence of multiple comorbidities in adults, requires intensive case management in both hospital and community settings, to ensure follow up post discharge is adequately conducted [29]. Qualitative work on the effect-iveness of discharge planning and post-acute care for Abo-riginal patients in improving health outcomes such as readmission, suggests good outcomes are dependent on the availability, knowledge and use of post-acute services and better access to primary health care [30]. One current NSW Health program targets Aboriginal patients recently discharged from hospital with a chronic disease and pro-vides telephone follow-up within 48 h. It demonstrated a significant decrease in emergency department presenta-tions, but not in unplanned readmissions, in Aboriginal people who received the follow up compared with eligible Aboriginal people who did not [31]. Further research is needed to determine the types of interventions that are ef-fective in reducing unplanned readmissions in Aboriginal people with chronic disease.
Our finding that length of stay was shorter for Abori-ginal people compared to non-AboriAbori-ginal differs to other studies. Banham and colleagues in their study of
potentially preventable hospitalisations in Aboriginal people with chronic disease report higher length of stay compared to non-Aboriginal people [23]. Although shorter length of stay is often considered more effi-cient, it may indicate either a higher risk of discharge against medical advice in this group of patients, or that they are not receiving the sufficient care resulting in poorer health outcomes and increased risk of readmis-sion [32,33]. Further research should investigate length of stay in Aboriginal people with chronic disease.
Limitations
Study findings should be considered in light of several limitations. There may be an underrepresentation in unplanned readmission rates due to underreporting of Aboriginality in hospital data, and therefore caution is needed in interpreting all hospital-level data for Abori-ginal people. Further, not all data on non-AboriAbori-ginal separations is included in this analysis, only a sample of non-Aboriginal separations were included who met the eligibility criteria (compared to all Aboriginal cases where all cases meeting the criteria were selected). Therefore it is possible that the non-Aboriginal sample is not representative of all non-Aboriginal people meet-ing the study eligibility criteria.
[image:8.595.58.539.87.339.2]sample such that the distribution of selection confounders was similar to those that died during admission, however there may have been unmeasured confounders which biased the results. Caution should also be used in inter-preting data on unplanned readmission as these data do not differentiate between avoidable and unavoidable un-planned readmissions, and therefore inevitably includes some readmissions which are appropriate and unavoid-able. Finally, while it is likely that some patients had
readmissions prior to 2005, our retrospective cohort study design allows us to only examine admissions within a de-fined time period only.
Conclusion
[image:9.595.58.540.110.608.2]Aboriginal people with chronic disease had a signifi-cantly higher risk of unplanned readmission or death compared with non-Aboriginal people, and there has been no significant change over the nine year period. It is
Table 4Testing for a trend over time in unplanned readmission or death: Unadjusted and adjusted GLM regression models of unplanned readmission or death by Aboriginal status including an interaction term for year and Aboriginal status (2005/6 to 2013/14)
Unplanned readmission or death with interaction term Relative risks (RR) (95% CI)
Unadjusted RR with propensity score (PS) weight
Unadjusted RR without PS weight
AdjustedaRR with PS weight
AdjustedaRR without PS weight
AdjustedaRR with PS weight and restricted to < 75 years
P-value
Aboriginal status
Non-Aboriginal ref ref ref Ref red
Aboriginal 1.15 (1.11, 1.19) 1.16 (1.12, 1.20) 1.28 (1.23, 1.32) 1.28 (1.23, 1.33) 1.33 (1.27, 1.39) < 0.0001
Year 1.00 (0.99, 1.01) 1.00 (0.99, 1.01) 1.00 (0.99, 1.01) 0.99 (0.99, 1.01) 1.01 (0.99, 1.02) 0.140
Interaction term
Year and Aboriginal status 1.00 (0.99, 1.02) 1.01 (0.99, 1.02) 1.01 (0.99, 1.02) 1.01 (1.00, 1.02) 0.99 (0.97, 1.00) 0.176
Gender – – –
Male – – ref ref ref
Female – – 0.89 (0.86, 0.92) 0.89 (0.86, 0.92) 0.88 (0.84, 0.91) < 0.0001
Age – – 1.01 (1.00, 1.01) 1.01 (1.01, 1.01) 1.00 (1.00, 1.01) < 0.0001
Marital status – –
Married – – ref ref ref
Single – – 1.19 (1.15, 1.24) 1.20 (1.15, 1.25) 1.21 (1.16, 1.26) < 0.0001
Widowed – – 1.18 (1.12, 1.23) 1.18 (1.13, 1.24) 1.24 (1.16, 1.32) < 0.0001
Divorced/separated – – 1.15 (1.10, 1.21) 1.15 (1.10, 1.21) 1.20 (1.13, 1.26) < 0.0001
Not known – – 0.93 (0.81, 1.07) 0.94 (0.82, 1.07) 0.97 (0.83, 1.13) 0.714
IRSD
1st quintile - most disadvantaged – – ref ref ref
2nd quintile – – 0.95 (0.91, 0.99) 0.95 (0.91, 0.99) 0.95 (0.90, 1.00) 0.061
3rd quintile – – 0.94 (0.90, 0.99) 0.94 (0.90, 0.99) 0.94 (0.90, 0.99) < 0.05
4th quintile – – 0.92 (0.87, 0.97) 0.93 (0.87, 0.98) 0.94 (0.87, 0.98) 0.051
5th quintile–least disadvantaged
– – 0.88 (0.82, 0.94) 0.88 (0.82, 0.94) 0.80 (0.74, 0.87) < 0.0001
ARIA
Highly Accessible – – ref ref ref
Accessible – – 0.93 (0.89, 0.97) 0.93 (0.89, 0.97) 0.94 (0.90, 0.98) > 0.01
Moderately Accessible – – 0.88 (0.83, 0.93) 0.88 (0.83, 0.93) 0.86 (0.81, 0.92) < 0.0001
Remote / Very Remote – – 0.67 (0.61, 0.73) 0.67 (0.61, 0.73) 0.65 (0.59, 0.72) < 0.0001
Charlson Index score
0 – – ref ref ref
1 – – 1.43 (1.38, 1.49) 1.43 (1.38, 1.49) 1.46 (1.40, 1.52) < 0.0001
2+ – – 1.63 (1.57, 1.70) 1.63 (1.57, 1.69) 1.69 (1.62, 1.77) < 0.0001
a
critical that effective interventions to reduce unplanned readmissions for Aboriginal people are identified.
Endnotes 1
The importance of using correct, respectful and appro-priate terminology for Aboriginal and Torres Strait Islander people is acknowledged. In keeping with NSW Health rec-ommendations and acknowledging that Aboriginal people are the original habitants of NSW, the term Aboriginal people will be used (NSW Health “Communicating posi-tively: A guide to appropriate Aboriginal terminology”, NSW Department of Health 2004).
Additional file
Additional file 1:ICD-10 codes. A list of ICD-10 codes for eligible chronic diseases for this retrospective cohort study. (DOCX 18 kb)
Abbreviations
ABS:Australian Bureau of Statistics; APDC: NSW Admitted Patient Data Collection; ARIA: Accessibility/Remoteness Index of Australia; CCI: Charlson Co-morbidity Index; CI: confidence interval; RR: relative risk;
EDDC: Emergency Department Data Collection; GLM: generalised linear model; IRSD: Index of Relative Socio-economic Disadvantage; NSW: New South Wales; RBDM: NSW Registrar of Births, Deaths and Marriages
Acknowledgements
We would like to acknowledge the traditional custodians of NSW, Australia, the Aboriginal people and pay our respects to the Elders past, present and future.
Funding
This study received funding from the Priority Research Centre for Health Behaviour, University of Newcastle. The funder had no role in the research study.
Availability of data and materials
The data that support the findings of this study (The Centre for Health Record Linkage linked NSW government administrative datasets) are available from NSW Health but restrictions apply to the availability of these data and so are not publicly available. Access to the data is available by application to the data custodians, NSW Health.
Authors’contributions
AJ, CO and MC contributed to the design of the study. AJ drafted the manuscript. AJ and CO conducted the analysis, with advice from JA, and TE prepared the datasets. JB, CO, MC, TE, R S-F and SE provided critical review of the manuscript. All authors contributed to the interpretation of findings, and have read and approved the final manuscript.
Ethics approval and consent to participate
The study was approved by the NSW Population & Health Services Research Ethics Committee (HREC/15/CIPHS/18) and the NSW Aboriginal Health and Medical Research Council Ethics Committee (1090/15). The Ethics Committees granted a waiver of the usual requirement for the consent of the individual to the use of their health information in a research project, in line with the State Privacy Commissioner’s Guidelines for Research and the Health Records and Information Privacy Act 2002 (NSW). The Centre for Health Record Linkage preserve privacy and maintain robust data governance. As researchers are only able to access de-identified linked data, the Centre for Health Record Linkage enable ethically approved research in the public interest to be carried out without consent.
Consent for publication
Not applicable.
Competing interests
The authors declare no competing interests.
Publisher’s Note
Springer Nature remains neutral with regard to jurisdictional claims in published maps and institutional affiliations.
Author details
1Health Behaviour Research Collaborative, School of Medicine and Public Health, Faculty of Health and Medicine, University of Newcastle, Callaghan, NSW 2308, Australia.2Priority Research Centre for Health Behaviour, University of Newcastle, Callaghan, NSW, Australia.3Hunter Medical Research Institute, New Lambton Heights, NSW, Australia.4CREDITSS—Clinical Research Design, Information Technology and Statistical Support Unit, Hunter Medical Research Institute, HMRI Building, New Lambton Heights, NSW, Australia.5School of Medicine and Public Health, University of Newcastle, Callaghan, NSW 2308, Australia.6Nunyara Aboriginal Health Unit, Central Coast Local Health District, Ward Street, Gosford, NSW, Australia.
Received: 3 August 2018 Accepted: 16 November 2018
References
1. Australian Institute of Health and Welfare: The health and welfare of Australia's Aboirginal and Torres Strait islander people: 2015. Cat. no: IHW 147. Canberra: AIHW; 2015.
2. Vos T, Barker B, Begg S, Stanley L, Lopez AD. Burden of disease and injury in aboriginal and Torres Strait islander peoples: the indigenous health gap. Int J Epidemiol. 2009;38:470–7.
3. Bureau of Health Information: Chronic disease care: another piece of the picture. 2(2). Sydney (NSW); 2012.
4. Dennis SM, Zwar N, Griffiths R, Roland M, Hasan I, Powell Davies G, Harris M. Chronic disease management in primary care: from evidence to policy. Med J Aust. 2008;188:S53–6.
5. Rothman AA, Wagner EH. Chronic illness management: what is the role of primary care? Ann Intern Med. 2003;138:256–61.
6. Hansen LO, Young RS, Hinami K, Leung A, Williams MV. Interventions to reduce 30-day rehospitalization: a systematic review. Ann Intern Med. 2011; 155:520–8.
7. Jack BW, Chetty VK, Anthony D, Greenwald JL, Sanchez GM, Johnson AE, Forsythe SR, O'Donnell JK, Paasche-Orlow MK, Manasseh C, et al. A reengineered hospital discharge program to decrease RehospitalizationA randomized trial. Ann Intern Med. 2009;150:178–87.
8. Australian Council on Healthcare Standards: Australasian clinical indicator report: 15th Edition 2006-2013. Sydney, Australia; ACHS; 2014; 2014. 9. Centre for Epidemiology and Evidence. The health of aboriginal people
of NSW: report of the chief health officer. Sydney: NSW Ministry of Health; 2012.
10. Vest JR, Gamm LD, Oxford BA, Gonzalez MI, Slawson KM. Determinants of preventable readmissions in the United States: a systematic review. Implement Sci. 2010;5:88.
11. Jencks SF, Williams MV, Coleman EA. Rehospitalizations among patients in the Medicare fee-for-service program. N Engl J Med. 2009;360:1418–28. 12. Robert Wood Foundation. The revolving door: a report on U.S. Hospital Readmissions. The Dartmouth Institute for Health Policy and Clinical Practice; 2013.
13. Brand C, Sundararajan V, Jones C, Hutchinson A, Campbell D. Readmission patterns in patients with chronic obstructive pulmonary disease, chronic heart failure and diabetes mellitus: an administrative dataset analysis. Intern Med J. 2005;35:296–9.
14. Weinberger M, Oddone EZ, Henderson WG. Does increased access to primary care reduce hospital readmissions? Veterans affairs cooperative study group on primary care and hospital readmission. N Engl J Med. 1996;334:1441–7.
15. Australian Institute of Health and Welfare: Australian hospital statistics 2012– 13. Health services series no. 54. Cat. no. HSE 145. Canberra: AIHW; 2014. 16. McLean R, Mendis K, Canalese J. A ten-year retrospective study of
unplanned hospital readmissions to a regional Australian hospital. Aust Health Rev. 2008;32:537–47.
18. Commonwealth Department of Health and Aged Care. Revised Edition: Measuring remoteness: accessibility/remoteness index of Australia (ARIA). Occasional papers: new series Number14. Canberra, Australia; 2001. 19. Australian Bureau of Statistics: IRSD: census of population and housing:
socio-economic indexes for areas (SEIFA). ABS, Australia. Accessed 1 November 2017. 2011.
20. Charlson ME, Pompei P, Ales KL, MacKenzie CR. A new method of classifying prognostic comorbidity in longitudinal studies: development and validation. J Chronic Dis. 1987;40:373–83.
21. Ye Y, Kaskutas LA. Using propensity scores to adjust for selection bias when assessing the effectiveness of alcoholics anonymous in observational studies. Drug Alcohol Depend. 2009;104:56–64.
22. StataCorp.: Stata Statistical Software: Release 11. College Station, TX: StataCorp LP. 2009.
23. Banham D, Chen T, Karnon J, Brown A, Lynch J. Sociodemographic variations in the amount, duration and cost of potentially preventable hospitalisation for chronic conditions among aboriginal and non-aboriginal Australians: a period prevalence study of linked public hospital data. BMJ Open. 2017;7:e017331. 24. Trivedi AN, Bailie R, Bailie J, Brown A, Kelaher M. Hospitalizations for chronic
conditions among indigenous Australians after medication copayment reductions: the closing the gap copayment incentive. J Gen Intern Med. 2017;32:501–7.
25. Li SQ, Gray NJ, Guthridge SL, Pircher SL. Avoidable hospitalisation in aboriginal and non-aboriginal people in the Northern Territory. Med J Aust. 2009;191:411. 26. Calvillo-King L, Arnold D, Eubank KJ, Lo M, Yunyongying P, Stieglitz H, Halm EA.
Impact of social factors on risk of readmission or mortality in pneumonia and heart failure: systematic review. J Gen Intern Med. 2013;28:269–82. 27. Joynt KE, Orav EJ, Jha AK. Thirty-day readmission rates for Medicare
beneficiaries by race and site of care. JAMA. 2011;305:675–81.
28. Laditka JN, Laditka SB, Mastanduno MP. Hospital utilization for ambulatory care sensitive conditions: health outcome disparities associated with race and ethnicity. Soc Sci Med. 2003;57:1429–41.
29. Katzenellenbogen JM, Miller LJ, Somerford P, McEvoy S, Bessarab D. Strategic information for hospital service planning: a linked data study to inform an urban aboriginal health liaison officer program in Western Australia. Aust Health Rev. 2015;39:429–36.
30. Taylor KP, Thompson SC, Smith JS, Dimer L, Ali M, Wood MM. Exploring the impact of an aboriginal health worker on hospitalised aboriginal experiences: lessons from cardiology. Aust Health Rev. 2009;33:549–57. 31. Jayakody A, Passmore E, Oldmeadow C, Bryant B, Carey M, Simons E,
Cashmore A, Maher L, Hennessey K, Bunfield J, et al. The impact of telephone follow up on adverse events for aboriginal people with chronic disease in New South Wales, Australia: a retrospective cohort study. Int J Equity Health. 2018;17.
32. Kossovsky MP, Sarasin FP, Chopard P, Louis-Simonet M, Sigaud P, Perneger TV, Gaspoz JM. Relationship between hospital length of stay and quality of care in patients with congestive heart failure. Qual Saf Health Care. 2002;11: 219–23.