R E S E A R C H A R T I C L E
Open Access
Loss of
BRCA1
leads to an increase in epidermal
growth factor receptor expression in mammary
epithelial cells, and epidermal growth factor
receptor inhibition prevents estrogen
receptor-negative cancers in
BRCA1
-mutant mice
Laura N Burga
1,2†, Hai Hu
1,2†, Ashish Juvekar
1, Nadine M Tung
1, Susan L Troyan
3, Erin W Hofstatter
1and
Gerburg M Wulf
1,2*Abstract
Introduction:Women who carry aBRCA1mutation typically develop “triple-negative”breast cancers (TNBC), defined by the absence of estrogen receptor (ER), progesterone receptor and Her2/neu. In contrast to ER-positive tumors, TNBCs frequently express high levels of epidermal growth factor receptor (EGFR). Previously, we found a disproportionate fraction of progenitor cells inBRCA1mutation carriers with EGFR overexpression. Here we examine the role of EGFR in mammary epithelial cells (MECs) in the emergence ofBRCA1-related tumors and as a potential target for the prevention of TNBC.
Methods:Cultures of MECs were used to examine EGFR protein levels and promoter activity in response toBRCA1 suppression with inhibitory RNA. EGFR was assessed by immunoblot and immunofluorescence analysis, real-time reverse transcriptase-polymerase chain reaction assay (RT-PCR) and flow cytometry. Binding of epidermal growth factor (EGF) to subpopulations of MECs was examined by Scatchard analysis. The responsiveness of MECs to the EGFR inhibitor erlotinib was assessedin vitroin three-dimensional cultures andin vivo. Mouse mammary tumor virus-Cre recombinase (MMTV-Cre)BRCA1flox/floxp53+/-mice were treated daily with erlotinib or vehicle control, and breast cancer-free survival was analyzed using the Kaplan-Meier method.
Results:Inhibition ofBRCA1in MECs led to upregulation of EGFR with an inverse correlation ofBRCA1with cellular EGFR protein levels (r2 = 0.87) and to an increase in cell surface-expressed EGFR. EGFR upregulation in response to BRCA1suppression was mediated by transcriptional and posttranslational mechanisms. Aldehyde dehydrogenase 1 (ALDH1)-positive MECs expressed higher levels of EGFR than ALDH1-negative MECs and were expanded two- to threefold in theBRCA1-inhibited MEC population. All MECs were exquisitely sensitive to EGFR inhibition with erlotinibin vitro. EGFR inhibition in MMTV-Cre BRCA1flox/floxp53+/-female mice starting at age 3 months increased disease-free survival from 256 days in the controls to 365 days in the erlotinib-treated cohort.
Conclusions:We propose that even partial loss ofBRCA1leads to an overall increase in EGFR expression in MECs and to an expansion of the highly EGFR-expressing, ALDH1-positive fraction. Increased EGFR expression may confer a growth advantage to MECs with loss ofBRCA1at the earliest stages of transformation. Employing EGFR inhibition with erlotinib specifically at this premalignant stage was effective in decreasing the incidence of ER-negative breast tumors in this mouse model.
* Correspondence: gwulf@bidmc.harvard.edu
†Contributed equally
1
Division of Hematology/Oncology, Beth Israel Deaconess Medical Center, 330 Brookline Avenue, Boston MA 02215, USA
Full list of author information is available at the end of the article
Introduction
Primary prevention of breast cancer has traditionally centered on estrogen receptor (ER) blockade, largely because the vast majority of breast cancers express ER and because ER antagonists are both easily administered and well-tolerated. However, ER antagonists do not pre-vent the most aggressive form of breast cancer: tumors that are ER- and progesterone (PR)-negative [1]. These tumors account for 15% to 20% of all breast cancers, occur with disproportionately high frequency in African-Americans and carry the worst prognosis [2,3]. The sub-group of women who are at highest risk for ER- and PR-negative breast cancers are women who carry a germline mutation in BRCA1. These women typically develop “triple-negative”breast cancers (TNBCs), which are defined by the absence of ER, PR and Her2 expres-sion and are thought to be caused by genetic instability that results from a germline mutation inBRCA1[4].
Though nominally classified as a diagnosis of exclu-sion (thus “triple-negative”), TNBC tumors frequently (72-75%) [5] overexpress epidermal growth factor recep-tor (EGFR), whereas only a minority (16%) of ER-positive breast cancers overexpress EGFR [5,6]. The high frequency of EGFR expression in TNBCs suggests that loss of BRCA1 may be coupled, either directly or indirectly, with EGFR overexpression in breast cancer [6]. This connection is further supported by the finding that sporadic TNBCs frequently exhibit both epigenetic silencing ofBRCA1[7] and overexpression of EGFR [5]. However, how TNBCs enrich for tumor cells with high EGFR expression is unknown.
Previously, we examined the proliferation and differ-entiation properties ofBRCA1-mutant primary human MECs (hMECs) [8] and found a disproportionate frac-tion of progenitor cells inBRCA1 mutation carriers with concomitant EGFR overexpression and absence of ERa. Here we report that inhibition ofBRCA1in MECs leads to the upregulation of EGFR and the expansion of an aldehyde dehydrogenase 1 (ALDH1)-positive mammary epithelial progenitor cell population. We show that these MECs are exquisitely sensitive to EGFR inhibition with erlotinib and that EGFR inhibition in vivocould prevent the emergence of TNBCs.
Materials and methods Reagents
Phycoerythrin (PE)-conjugated mouse EGFR anti-body (EGFR.1, 555997), PE-conjugated mouse immuno-globulin G2b (IgG2b) isotype control antibody (27-35; 555744) were obtained from BD Biosciences, San Diego, CA, USA, and QuantiBrite beads (340495) were obtained from BD Biosciences, San Jose, CA, USA. The ALDEFLUOR assay kit was purchased from STEMCELL Technologies, Durham, NC, USA. Rhodamine (Rh)-EGF
(E-3481) was purchased from Invitrogen, Carlsbad, CA, USA. For immunofluorescence analysis, we used a mouse anti-EGFR antibody (EGFR.1, 555997) obtained from BD Biosciences, San Diego, CA, USA. For immu-nohistochemical analysis, we used anti-EGFR antibody (ab52894, rabbit monoclonal antibody EP38Y; Abcam, Cambridge, MA, USA), anti-ALDH1A1 antibody (ab52492, rabbit monoclonal antibody, EP1933Y; Abcam, Cambridge, MA, USA), anti-cleaved caspase 3 antibody (9661S, rabbit polyclonal antibody, Asp175; Cell Signaling Technology, Danvers, MA, USA), anti-Ki-67 antibody (9106-S, rabbit monoclonal antibody SP6; ThermoScientific, Fremont, CA, USA) and mouse anti-ERaantibody (MC-20, SC-524; Santa Cruz Biotech-nology, Santa Cruz, CA, USA). For immunoblot analysis, mouse anti-BRCA1 antibody (MS110) was purchased from Calbiochem (manufactured by EMD Biosciences Inc., San Diego, CA, USA). Erlotinib was purchased from LC Laboratories (Woburn, MA, USA).
Cell culture
Informed consent was obtained for the collection of
pri-mary hMECs from mastectomy specimens of BRCA1
mutation carriers (DFHCC-IRB legacy 04-405), and cells were isolated as described previously [8]. MECs were cultured in Mammary Epithelial Cell Growth Medium (MEGM; Lonza, Walkersville, MD, USA) or HuMEC medium (Gibco, Invitrogen, Carlsbad, CA, USA) supple-mented with bovine pituitary extract. MCF-10A human epithelial cells (American Type Culture Collection (ATCC), Manassas, VA, USA), hMEC-expressing human telomerase reverse transcriptase (hTERT) cells and immortalized human mammary epithelial cells (HMLE cells) (gift from Dr. Robert Weinberg) were cultured in a mixture of Dulbecco’s modified Eagle’s medium-Ham’s F-12 medium supplemented with 5% horse serum, 20 ng/ml EGF, 0.5 mg/ml hydrocortisone, 100 ng/ml cholera toxin and 10 μg/ml insulin. MCF-7 cells, the
HCC1937 BRCA1-mutant breast cancer cell line
(ATCC) and HCC1937 cells stably transfected with green fluorescent protein (GFP)-BRCA1 (gift from Dr. Ralph Scully) were kept in RPMI 1640 medium with 10% fetal bovine serum. For three-dimensional cultures, the cells were embedded in 40μl of Geltrex (Invitrogen, Carlsbad, CA, USA) and cultured in eight-chamber cul-ture slides (BD Falcon, San Diego, CA, USA).
Cell viability and luciferase assays
hMEC or MCF-7 cells were seeded into 24-well plates on day 1, transfected with BRCA1 small interfering RNA 1 (BRCA1 si1) or small interfering RNA 2 (BRCA1 si2) or control small interfering RNA (siRNA) on day 2 and with control or the full-length EGFR luciferase con-struct on day 3, followed by a luciferase assay performed on day 4. For each experiment, 2 μg of reporter con-struct were transfected in combination with either 1 ng of hMEC or 10 ng of Renilla thymidine kinase (Renilla TK) (MCF-7), and luciferase activity was determined using a Wallac 3 plate reader.
Plasmids and inhibitory RNA constructs
The full-length EGFR promoter inserted 5’from a luci-ferase reporter [9] was a gift from Drs. Benjamin Purow and AC Johnson. The following sequences were used for the production of lentiviruses generating small hairpin
RNA (shRNA): CAGCAGTTTATTACTCACTAA
(Brca1si1), CAGGAAATGGCTGAACTAGAA (Brca1 si2) and GCTAAACTCGTAATTCAACTT (scrambled control RNA interference (RNAi)). Transient transfec-tion of siRNA was performed using siRNA and Hyper-Fect transfection protocol (QIAGEN, Valencia, CA, USA) according to the manufacturer’s instructions. Stably infected cells lines were produced using lenti-viruses. The sh sequences were cloned into the pLKO.1 vector, and lentiviruses were produced in the 293FT cell line (Invitrogen, Carlsbad, CA, USA). The cells were infected and selected with puromycin as previously described [10].
Flow cytometry
To measure the kinetics of binding of EGF, cells were grown for 24 hours in 6-cm dishes and serum-deprived for 4 to 6 hours at 37°C, followed by a 1-hour incuba-tion on ice with indicated amounts of Rh-EGF. For uptake and binding, cells were incubated on ice with 10 ng of Rh-EGF, then the excess Rh-EGF was removed with an ice-cold phosphate-buffered saline (PBS) wash and the cells were incubated at 37°C for the indicated time intervals. The reaction was stopped on ice, and the noninternalized receptor was stripped with a light acid buffer (50 mM glycine, 150 mM NaCl, pH 3.0). The cells were gently dissociated with trypsin replacement TrypLE (Invitrogen, Carlsbad, CA, USA) and resus-pended in PBS. The ALDEFLUOR assay kit was used to identify the stem and progenitor cell populations according to manufacturer’s instructions. BODIPY ami-noacetaldehyde (BAAA) was used as a substrate, and diethylaminobenzaldehyde was used as an inhibitor for negative controls. Cell surface-bound EGFR was mea-sured using a phycoerythrin (PE)-conjugated EGFR anti-body and PE-conjugated mouse IgG2b isotype control antibody. Following gentle cell dissociation or
ALDEFLUOR assay, the cells were washed, resuspended in 80 μl of PBS with bovine serum albumin (BSA) or ALDEFLUOR assay buffer and 20μl of either antibody or isotype control solution were added. Reactions were incubated on ice for 30 minutes, the cells were washed with either PBS and BSA or ALDEFLUOR assay buffer and resuspended in 0.5 ml of PBS or ALDEFLUOR assay buffer. QuantiBrite beads were used to estimate the number of EGFR molecules per cell. Samples were measured using a FACSAria™ II Cell Sorter 5-laser SORP instrument (BD Biosciences, San Jose, CA, USA) or sorted using a MoFlo sorter (Beckman-Coulter, Inc, Miami FL, USA).
Immunofluorescence
Cells cultured on coverslips for 24 hours were fixed for 10 minutes at room temperature in 3% paraformalde-hyde/2% sucrose solution, rinsed twice with PBS and per-meabilized with ice-cold Triton X-100 solution (0.5% Triton X-100, 20 mM HEPES ((4-(2-hydroxyethyl)-1-piperazineethanesulfonic acid )), pH 7.4, 50 mM NaCl, 3 mM MgCl2, 300 mM sucrose) for 3 minutes on ice. The
cells were rinsed for 5 times with PBS and blocked for 20 minutes with 10% goat serum followed by incubation with primary antibody EGFR (EGFR.1) and anti-ALDH1A1 (EP1933Y) for 20 minutes at 37°C. Cells were washed two times and incubated for 20 minutes at 37°C with secondary antibody Alexa 488-conjugated anti-rabbit or Alexa 594-conjugated anti-mouse antibody (1:1,000 dilution; Invitrogen). The nuclei were stained with DAPI (1:10,000 dilution; 4’ ,6-diamidino-2-phenylin-dole), and the slides were examined using a Nikon fluorescence microscope (Nikon, Tokyo, Japan). For quantification of the fluorescence signal, the mean inten-sity was determined using ImageJ software in four differ-ent fields for each sample. Experimdiffer-ents were performed in triplicate, and the means and standard deviations of the signal intensities were calculated for each condition.
Real-time RT-PCR
Total RNA was extracted using the RNeasy Plus Mini Kit (QIAGEN). RNA was reverse-transcribed using the AccuScript enzyme in the AccuScript High Fidelity RT-PCR System (Agilent Technologies, Stratagene Products Division, La Jolla, CA, USA). A quantitative real-time RT-PCR assay was carried out on a Rotor-Gene 6000 cycler (Corbett Life Science, San Francisco, CA, USA) using SYBR Green Supermix (Bio-Rad Laboratories, Hercules, CA, USA). The PCR reaction (15μl) was per-formed under the following conditions: 95°C for 10 min-utes followed by 45 cycles at 95°C for 20 seconds, at 56°C for 25 seconds and at 72°C for 40 seconds. The
expression of the EGFR gene was normalized to
levels. The primer sequences for human EGFR cDNA (70 bp) were forward primer 5’ -GCACCTACGGATG-CACTGG-3’and reverse primer 5’ -GGCGATGGACGG-GATCTTA-3’.
Immunohistochemistry, morphometry and statistics Immunohistochemistry was performed as described pre-viously [11]. Scoring for EGFR expression was done according to the following system: Score 0 no staining or staining in less than 10% of cells. Score 1+, a faint perceptible membrane staining can be detected in more than 10% of cells. Score 2+, a weak to moderate com-plete membrane staining is observed in more than 10% of cells. Score 3+, a strong complete membrane staining is observed in more than 10% of the cells. Colonies were documented using ACT-1 software connected to an Olympus SZX12 or a Nikon EclipseS100 microscope and analyzed using SIGNATURE software [12].
A two-sided t-test was used to determine statistical significance. Kaplan-Meier analysis was done using the GraphPad Prism software package (GraphPad Software, La Jolla, CA, USA), and survival statistics were calcu-lated using the log-rank test. Scatchard analysis of Rh-EGF binding was done as described previously [13,14].
Animal experiments
All animal experiments were conducted in accordance with Institutional Animal Care and Use Committee-approved protocols. Experimental female mice,Brca1flox/ flox, MMTV-Cre andp53
+/-, were obtained by breeding Brca1 conditional knockout mice from the National Institutes of Health repository (01XC8, strain C57BL/6), originally generated by Xuet al. [15], who made these mice available to us via the National Cancer Institute repository, with MMTV-Cre mice (B6129-TgN(MMTV-Cre)4Mam; Jackson Laboratory, Bar Harbor, ME, USA) [16] and p53-knockout mice (P53N12-M, C57BL/6; Taconic Farms, Germantown, NY, USA) [17]. At the time of the study, the mice had been inbred for 2 years (seven generations). The floxed or wild-type status of Brca1, the presence of the MMTV-Cre transgene and p53 heterozygosity were determined by PCR as pre-viously described [15]. Mice were examined for the occurrence of tumors twice weekly. When tumor metrics were performed, the length and width of the tumor were determined using calipers and the tumor volume was determined by calculating width2 × length/ 2. Tumor growth was recorded as the ratio of tumor growth to tumor volume at the time of diagnosis.
Results
BRCA1inhibition results in increased EGFR expression
To examine whether EGFR upregulation is directly related to the loss ofBRCA1, we suppressedBRCA1 in
different MEC lines, including MCF-10A [18], hMEC-hTERT and HMLE [19]. These MEC lines have not yet undergone transformation, and instead are propagated as immortalized cells. hMECs were transfected with control or BRCA1-directed siRNA and analyzed 72 to 120 hours after transfection. MCF-10A and HMLE cells showed poor transfection efficiency upon transient transfection with siRNA, and therefore these cells were infected with lentiviruses that expressed shRNAi against BRCA1 (Figure 1A) and selected for pools of infected cells with puromycin. Asynchronously growing cells were lysed and analyzed for EGFR expression. Through-out these experiments, the effects observed after short-term suppression of BRCA1 with transient transfection in hMECs were similar to the results obtained in MCF-10A and HMLE cells with longer-term suppression of BRCA1 after lentiviral infection and puromycin selection.
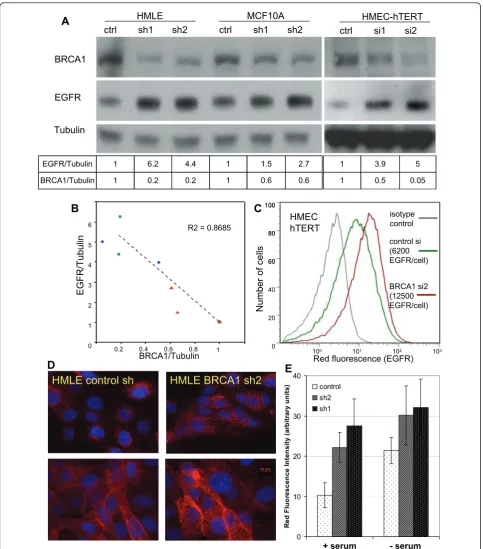
In all three cell lines and with either approach, we found that EGFR protein levels as measured by immu-noblotting with anti-EGFR antibodies increased when BRCA1 was inhibited (Figure 1A). We measured the density of the immunoblotting signals and found that, with BRCA1inhibition, EGFR levels increased by up to five times over baseline (Figure 1A). In addition, there appeared to be a tight negative correlation of BRCA1 and EGFR levels (r2 = 0.87), suggesting a regulatory role of BRCA1for EGFR (Figure 1B). Next, we examined EGFR levels in response to BRCA1suppression under conditions of steady-state growth or serum starvation using immunofluorescence and quantification of the EGFR fluorescence signal (Figure 1D, bar graph). We found that BRCA1 inhibition led to EGFR upregulation under both conditions, as well as asynchronous growth and starvation, suggesting that the effect ofBRCA1 sup-pression on EGFR exsup-pression is not mediated by the absence or presence of growth factors (Figure 1D).
We then used flow cytometry to examine whether the increase in total cellular EGFR protein was accompanied by an increase in EGF binding sites on the cell surface as opposed to intracellular accumulation. We found that hMEC-hTERT expressed an average of 6 × 10³ EGFR per cell, which increased up to twofold after siRNA inhi-bition of BRCA1 (Figure 1C). A similar increase of cell surface EGFR was seen with a second BRCA1-targeted siRNA (si1) in hMECs and using BRCA1-directed shRNA in MCF-10A cells (Figures 4G and 4H). Immu-nofluorescence of EGFR using anti-EGFR antibodies in
hMEC-hTERT confirmed that BRCA1 inhibition
A
EGFR BRCA1
Tubulin
MCF10A HMLE
ctrl sh1 sh2 ctrl sh1 sh2
1 1
0.6 1.5
0.6 2.7
0.2 0.2
1 BRCA1/Tubulin
4.4 6.2
1 EGFR/Tubulin
1 1
0.5 3.9
0.05 5 HMEC-hTERT ctrl si1 si2
Red fluorescence (EGFR)
B
C
BRCA1/Tubulin
EG
FR/Tubuli
n
5 6
4
3
2
1
0 0.2 0.4 0.6 0.8 1
R2 = 0.8685
HMEC hTERT
100
80
60
100 101 102 103 isotype control
control si (6200 EGFR/cell)
BRCA1 si2 (12500 EGFR/cell)
Number of cells
40
20
0 100
80
60
HMLE control sh
HMLE BRCA1 sh2
+ serum - serum 0
10 20 30 40
R
e
d
F
lu
o
resc
en
ce
In
ten
sit
y (
ar
b
itr
ar
y u
n
it
s) control
sh2 sh1
D
E
[image:5.595.57.541.87.637.2]Fig 1
Figure 1BRCA1suppression in mammary epithelial cells (MECs) leads to an increase in epidermal growth factor receptor (EGFR)
expression.(A)MECs were transfected withBRCA1control or small interfering RNA 1 or 2 (si1, si2), or they were infected with
lentivirus-expressing control orBRCA1-specific small hairpin RNA (sh1, sh2) and lysed for immunoblot analysis..(B)The intensities of the
fivefold increase in EGFR protein and to an approxi-mately twofold increase in the number of EGFR expressed on the MEC surface. Thus, the increase in intracellular EGFR was more pronounced than the increase in cell surface-expressed EGFR upon BRCA1 inhibition.
BRCA1inhibition increases EGFR expression through both
an increase in transcription as well as stabilization of the EGFR protein
We next examined the molecular mechanisms by which BRCA1 inhibition caused an increase in EGFR protein. Given earlier reports thatBRCA1can function as a tran-scriptional regulator and that it specifically regulates another receptor tyrosine kinase, insulin-like growth fac-tor I recepfac-tor (IGF-IR) [20,21], we analyzed mRNA levels using quantitative RT-PCR. We found that in MEC lines with stably suppressed BRCA1levels, EGFR mRNA was upregulated 1.5- to twofold in HMLE and two- to threefold in MCF-10A cells, indicating an increase in EGFR transcription in response to BRCA1 downregulation (Figure 2A). We next examined the effects of BRCA1 suppression on EGFR promoter activ-ity to determine whether the increase in EGFR mRNA was due to direct transcriptional activation. As these luciferase assays required transient transfection of siRNA and reporter plasmid, they could be performed only in hMECs, not in MCF-10A or HMLE cells. There-fore, we performed a second set of luciferase assays in MCF-7 breast cancer cells. We found that EGFR promo-ter activity increased up to twofold upon BRCA1 sup-pression (Figure 2B), consistent with the increase in mRNA levels observed (Figure 2A) and confirming that BRCA1 exerts a negative regulatory role on EGFR transcription.
Because BRCA1 also has ubiquitin ligase activity toward tubulin [22], ERa[23] and phosphorylated Akt [24], and because we observed a pronounced increase in intracellular EGFR upon BRCA1 suppression (Figure 1D), we tested whether BRCA1 suppression affects EGFR stability after blockade of protein biosynthesis with cycloheximide (Figures 2C and 2D). Interestingly, BRCA1 suppression increased the half-life of the EGFR protein from less than 30 minutes to over 75 minutes (Figure 2D). Thus, there appear to be at least two mechanisms that result in an increase in EGFR protein levels upon BRCA1suppression, transcriptional regula-tion and protein stabilizaregula-tion.
ALDH1-positive cells show an increase in EGFR expression Using immunofluorescence imaging, we noted heteroge-neity with regard to EGFR expression in both control MECs as well as in MECs afterBRCA1 inhibition (Fig-ures 1D and 3D). An increased expression of EGFR in
basal cells was previously observed in murine MECs [25] and hMECs [26], and a drift toward high EGFR expression was seen in cell line models of basaloid breast cancer [27], which led us to examine whether the EGFR levels differed between stem and non-stem cells as defined by the expression of ALDH1 [28,29]. We found that mean numbers of EGFR were higher in the positive fractions of MECs than in the ALDH1-negative fractions. (Figure 3A, top, and Figure 4G). Con-sistently, ALDH1-positive MECs showed an increased binding of Rh-labeled EGF when compared to the ALDH1-negative fraction (Figure 3A, bottom, and Figures 3B and 3C). Given these differences in cell sur-face-expressed EGFR, we compared the kinetics of EGF binding and internalization between ALDH1-positive and ALDH1-negative MECs. For the binding assay, cells were incubated with increasing concentrations of Rh-labeled EGF, and binding was analyzed using flow cyto-metry (Figure 3B). Scatchard analysis of Rh-EGF binding at 4°C showed that both the ALDH1-positive and ALDH1-negative population bound EGF with similar affinity (Kd = 0.32 nM) (Figure 3B, inset). For binding
and internalization (Figure 3C), cells were preincubated with Rh-EGF at 4°C to allow for binding, followed by removal of unbound Rh-EGF incubated for the indicated times and concentrations with Rh-labeled EGF at 37°C, and then washed with either PBS or an acidified buffer as described previously [30], followed by ALDH1 stain-ing. While the PBS wash removes only unbound Rh-EGF, the acidified buffer removes both receptor-bound and receptor-unbound EGF, that is, fluorescence after the acidic wash is representative of internalized EGF. We found that EGF binding was biphasic, both in ALDH1-positive and ALDH1-negative cells, with an initial saturation of EGF binding sites after 5 minutes, followed by a second, slower phase of binding and inter-nalization. Internalization was complete after 30 minutes at 37°C (Figure 3C).
In summary, binding and internalization kinetics were similar in ALDH1-positive and ALDH1-negative MECs, while the total number of circulating EGF receptors was increased in the ALDH1-positive fraction.
BRCA1inhibition increases EGFR expression in both the
ALDH1-negative and the expanded ALDH1-positive cell pool
EGFR mRNA l
ev
el
(r
el
ativ
e units
RT-P
CR)
0 2 4 6 8
MCF10A c sh1 sh2
HMLE c sh1 sh2 A
BRCA1 sh2
HA-EGFR
Tubulin
30 60 90 120 150 180 210 240
0 0.2 0.4 0.6 0.8 1.0
Control sh BRCA1 sh2
Time (min)
OD ratio (EGFR/Tubulin)
0 30 60 120 240
0 30 60 120 240
Time (min)
Control sh
B
C
HMEC MCF7
Lucifer
as
e
Activity
(
Rel
ativ
e
Units)
D
0 10 20 30 40 50 60
0 10 20 30 40
[image:7.595.59.539.88.609.2]c si1 si2 c si1 si2
the percentage of ALDH1-positive cells increased four-fold in hMEC-hTERT and doubled in MCF-10A cells in response to inhibition ofBRCA1(Figures 4C and 4F). In addition, we found a corresponding increase in the CD24low/CD44highpopulation in both HMLE and MCF-10A cells expressing BRCA1 shRNA (Additional file 1, Figure S1), thus confirming an increased MEC progenitor cell pool in response to BRCA1 inhibition [29,32]. Using two-color flow cytometry and QuantiBrite beads [33], we found that ALDH1-positive MECs carried two to three times the number of EGF receptors compared with ALDH1-negative cells (Figures 3A, 4G and 4H). Upon
BRCA1inhibition with siRNA in hMECs or with shRNA in MCF-10A cells, a significant increase of EGFR was observed in ALDH1-negative and ALDH1-positive MECs (Figures 4G and 4H, dark bars). Thus, our data show that BRCA1inhibition affects EGFR expression in two ways: BRCA1suppression leads to the expansion of the highly EGFR-expressing ALDH1-positive MEC pool (Figures 4C and 4F through 4H), and, second,BRCA1 inhibition raises the numbers of EGF receptors per cell in all MECs (ALDH1-positive and ALDH1-negative cells), likely through transcriptional activation (Figure 2A) and post-translational mechanisms (Figure 2B).
EGFR (red)
ALDH1 (green) merge
Rhodami
ne-EGF (mean ds-red)
0 200 400 600 800 1000 1200 1400 1600 1800
1 2 3 10 20
Time (min) PBS acid ALDH1-acid ALDH1+
PBS ALDH1+
0 100 200 300 400
20 40 60 80 100
Rhodamine-EGF (ng/ml)
Rhodamin-EG
F (mean ds-red)
R2 = 0.97 R2 = 0.98
0 200 400 600 800 1000 1200
0 100 200 300 400 500
Bound (mean fluorescence)
Bound/
Fr
e
e (
m
e
an
fl
u
o
resce
nce/
nM
)
A B
C
D
R
ed fluo
rescence
:
P
hycoeryt
hrin
(PE)
Green fluorescence: ALDH1
red: EGFR-PE green: ALDH1
red: Rhodamine EGF green: ALDH1 red: unstained
green: ALDH1+DEAB
R
ed fluo
rescence
:
R
hodamine
-EG
F
Green fluorescence: ALDH1
[image:8.595.57.540.86.444.2]red: isotype-PE green: ALDH1+DEAB
Figure 3Heterogeneity and kinetics of epidermal growth factor receptor (EGFR) expression in mammary epithelial cells (MECs).
(A)Dual staining of aldehyde dehydrogenase 1 (ALDH1)-positive cells (green fluorescence) with anti-EGFR antibodies (top) or rhodamine (Rh)-labeled epidermal growth factor (EGF) (bottom) in human MEC-human telomerase reverse transcriptase (hMEC-hTERT). Negative controls used to adjust compensation settings are shown (left). ALDH1-positive cells show higher EGF binding and a higher number of EGF receptors (right). DEAB, diethylaminobenzaldehyde.(B)Binding of EGF in ALDH1-negative or ALDH1-positive MECs. Cells were incubated at 4°C with the indicated amounts of EGF and labeled with ALDH1 reagent. Inset: Scatchard analysis of EGF binding.Kdvalues were 0.32 nM for both the ALDH1+and
ALDH1-fractions. The intensity of the red fluorescence was measured using the channel for red fluorescence (Discosoma Red - ds-red) of the
B
D
E
F
C
A
MCF10A
Green fluorescence: ALDH1
ALDH1+DEAB Control si
ALDH1
BRCA1 si2 ALDH1 HMEC-hTERT
Green fluorescence: ALDH1
SSC
SSC
ALDH1 +DEAB
Control sh ALDH1
BRCA1 sh2 ALDH1
MCF10A HMEC-hTERT
M
ean number
of
sur
face-bound EG
FR/
cell
c si1 si2 p<0.05
p<0.05 p<0.05
c si1 si2 ALDH1-neg ALDH1-pos 0
5000 10000 15000 20000 25000
p<0.05 p<0.05
c sh1 sh2 c sh1 sh2 ALDH1-neg ALDH1-pos 0
500 1000 1500 2000 2500 3000
p<0.05
[image:9.595.59.540.90.641.2]G
H
EGFR inhibitor erlotinib blocks the outgrowth of normal
andBRCA1-deficient MECs
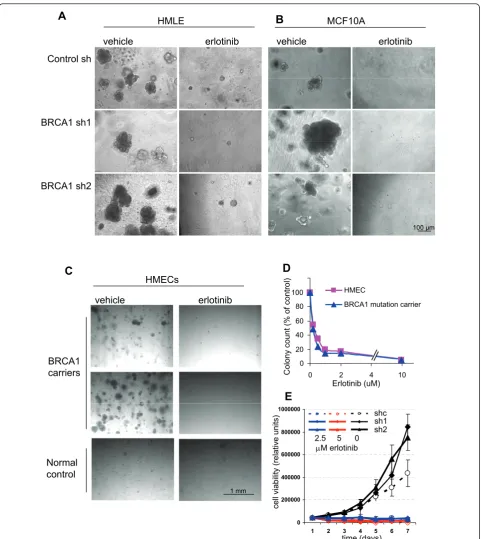
Given our findings of EGFR upregulation in MECs upon BRCA1 inhibition, as well as our previous findings of altered growth and differentiation patterns of EGFR-expressing MECs isolated fromBRCA1 mutation car-riers [8], we asked whether EGFR inhibition could block this phenotype. First, we examined the growth charac-teristics of control andBRCA1-suppressed orBRCA1 -mutant MECs. Consistent with our previous data, we found that after experimental suppression of BRCA1, MECs formed larger colonies with greater efficiency than control cells in the three-dimensional Matrigel-based cultures (Figures 5A and 5B). Similar findings were obtained with primary MECs fromBRCA1 muta-tion carriers, which yielded a higher number of larger colonies than controls (Figure 5C) [8]. Finally, our results were further confirmed by MEC cultures from MMTV-Cre BRCA1flox/floxmice, in which even the het-erozygote loss of BRCA1 led to increased clonality of MECs (Figure 6B). Thus, our data in primary hMECs, murine MECs and immortalized MECs with experimen-talBRCA1suppression all confirm that even partial sup-pression or heterozygote loss of BRCA1 causes an increase in the clonogenicity and proliferative potential of MECs.
Next, we treated MECs with the EGFR inhibitor erlo-tinib and found that erloerlo-tinib efficiently blocked the out-growth of colonies from all MECs, controls as well as BRCA1-suppressed MECs (Figures 5A and 5B), of nor-mal and BRCA1-mutant primary MECs (Figure 5C), as well as of murine MECs that were wild-type orBRCA1 -deficient (Figure 6C). In dose-response experiments, we found that <1 μM erlotinib was sufficient to suppress MEC outgrowth in both hMECs (Figure 5D) and murine MECs (Figure 6C), indicating that MECs carrying a wild-type EGFR are highly sensitive to the growth-inhibitory effect of erlotinib. In addition, we used a 3-(4,5-dimethylthiazol-2-yl)-2,5-diphenyltetrazolium bro-mide (MTT)-based cell viability assay to determine the effects of erlotinib on MEC growth. Cells were seeded at equal densities, and cell viability was measured daily over a period of 7 days (Figure 5E). This quantitative cell viability assay confirmed that both cell types that expressedBRCA1-inhibitory shRNA grew significantly faster and reached double the cell number after 7 days of culture compared to controls (Figure 5E), thus con-firming that loss of BRCA1leads to accelerated prolif-eration of MECs. In the quantitative cell viability assay, MECs with loss of BRCA1were equally as sensitive to erlotinib as wild-type cells (Figure 5E), confirming our observations in the colony formation assays (Figures 5A through 5D and Figure 6). In summary, both readout methods, colony formation assay as well as cell viability
assay, confirmed that MECs with loss of BRCA1 that express higher EGFR levels proliferate more rapidly than controls and that this increase in proliferation remains highly sensitive to the growth-inhibitory effect of erlotinib.
MECs fromBRCA1-mutant mice show proliferation and differentiation patterns similar to MECs from human
BRCA1mutation carriers
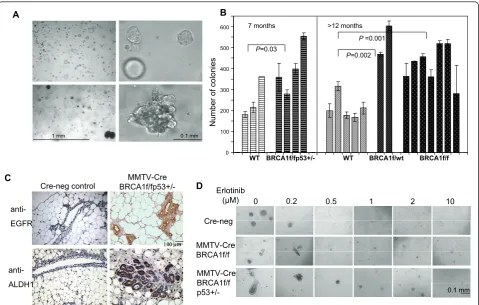
The model of MMTV-Cre flox-directed deletion of BRCA1 was first developed by Xu et al. [15] and has been used extensively to examineBRCA1-related tumor-igenesis. When grown in three-dimensional Matrigel-based cultures, murine MECs grew in patterns similar to those of hMECs, that is, cells from wild-type mice formed hollow acini after 10- to 14-day culture periods (Figure 6A, top). In cells isolated from MMTV-Cre BRCA1flox/flox p53
+/-mice, we found large, complex, solid structures (Figure 6A, bottom), similar to those that we found in human BRCA1mutation carriers [8]. Next, we examined the mammary gland tissues of five MMTV-CreBRCA1 flox/floxp53+/-mice and seven Cre-negative, age-matched control mice for the expression of EGFR and ALDH1 (Figure 6C). We found that the mammary glands of BRCA1-mutant mice in general contained more acini than the controls. In each of the MMTV-Cre BRCA1flox/flox p53+/-mammary glands, we found entire acini that stained positive for both EGFR and ALDH1, while only occasional single cells were positive in any of the Cre-negative control glands.
MMTV-CreBRCA1flox/floxp53+/-mice develop breast cancer with a latency of about 8 to 10 months, while MMTV-Cre BRCA1flox/flox mice develop tumors with relatively low penetrance beyond age 1 year or older [34], and MMTV-CreBRCA1 flox/wt mice rarely develop spontaneous breast cancers. Therefore, we examined the clonogenicity of murine MECs that had not yet formed tumors at age 7 months for MMTV-Cre BRCA1flox/flox
p53+/- mice and at age 12 months for MMTV-Cre
BRCA1flox/floxor MMTV-CreBRCA1flox/wt. In compar-ison to wild-type cells, all three mutant cell types showed significantly increased colony formation (Figure 6B). Interestingly, this increase in clonogenicity was observed not only in cells from mice with homozygotic loss ofBRCA1 but also in cells from mice with hetero-zygotic loss of BRCA1 (MMTV-Cre BRCA1 flox/wt), indicating that loss of a single allele, which is a situation analogous to a humanBRCA1mutation carrier, leads to an increase in colony formation (Figure 6B).
BRCA1 sh1
BRCA1 sh2 Control sh
MCF10A HMLE
vehicle erlotinib vehicle erlotinib
A
100 ȝm
C
I J
BRCA1 carriers
Normal control
1 mm HMECs
erlotinib vehicle
C
B
Fig. 5
0 20 40 60 80 100
0 2 4 10
HMEC
BRCA1 mutation carrier
Erlotinib (uM)
C
olon
y count (
%
of
contro
l)
D
0 200000 400000 600000 800000 1000000
1 2 3 4 5 6 7
cell viability (r
el
ativ
e
unit
s)
time (days)
E
shc sh1 sh2 2.5 5 0
PM erlotinib
Figure 5BRCA1inhibition leads to increased colony formation and size that is completely blocked by epidermal growth factor
receptor (EGFR) inhibition. Mammary epithelial cells (MECs) expressing either(A and B)control small hairpin RNA (shRNA) orBRCA1-directed
[image:11.595.58.540.86.626.2]the efficacy of erlotinib for the primary prevention of breast cancer inBRCA1-mutant mice.
EGFR inhibitor erlotinib prevents the development of ER-negative, but not of ER-positive, breast cancers inBRCA1 -mutant mice
Starting at age 3 months, MMTV-Cre BRCA1 flox/flox p53
+/-mice were treated with either the EGFR inhibitor erlotinib at 100 mg/kg/day orally (treatment cohort) or vehicle control (control cohort) as dosed previously [35]. End points were tumor-free survival and tolerability of the prophylactic erlotinib treatments. The mice tolerated the treatments well, with the only adverse effect being partial alopecia in about 30% of the mice. Mice were examined daily, and tumors were diagnosed by palpa-tion. Upon necropsy, tumors were counted, fixed and
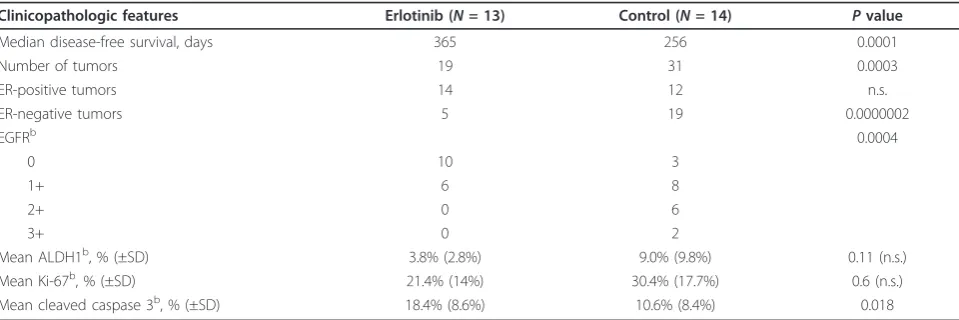
examined for ER expression. Survival analysis (Figure 7) showed a median disease-free survival of 365 days in the erlotinib-treated cohort versus 256 days in the control cohort, that is, erlotinib treatments delayed tumor devel-opment by an average of 3 months. Only 19 tumors were observed in the erlotinib-treated cohort versus 31 tumors in the control cohort, a significant reduction (P = 0.0003). Upon necropsy, tumors were fixed and pro-cessed for immunohistochemistry (Table 1 and Addi-tional file 2, Figure S2). As expected on the basis of previous studies [34,36], the mice in the control cohort developed both ER-positive and ER-negative breast cancers, with a predominance of ER-negative tumors. Interestingly, while the number of ER-positive tumors was not significantly different in both cohorts, the num-ber of ER-negative breast cancers was sharply reduced
A B
7 months >12 months
WT BRCA1f/fp53+/- WT BRCA1f/wt BRCA1f/f
Number of coloni
es
D 0 100 200 300 400 500 600
1 mm 0.1 mm
P=0.03
P=0.002 P =0.001
10
Cre-neg
MMTV-Cre BRCA1f/f p53+/-MMTV-Cre BRCA1f/f
0 0.2 0.5 1 2
Erlotinib
(ȝM)
0.1 mm
C
anti-EGFR
anti-ALDH1
MMTV-Cre BRCA1f/fp53+/-Cre-neg control
[image:12.595.59.539.88.393.2]Pm
Figure 6Proliferation and differentiation properties of MECs from MMTV-Cre BRCA1-mutant mice . (A and B)Growth and proliferation properties of mammary epithelial cells (MECs) isolated from mouse mammary tumor virus-Cre recombinase (MMTV-Cre)BRCA1-mutant mice are similar to MECs isolated from humanBRCA1mutation carriers. MECs were harvested and plated as described previously [8].(A, top)Cultures from wild-type (WT) control mice resulted in round acinar structures, whereas(A, bottom)cultures from MMTV-CreBRCA1flox/floxp53+/-mice showed complex and irregular features.(B)The overall colony-forming efficiency of murineBRCA1-mutant MECs is increased. Non-tumor-bearing WT and MMTV-BRCA1flox/floxp53+/-MECs were compared at age 7 months, and non-tumor-bearing mice from MMTV-CreBRCA1flox/WT
(heterozygous loss ofBRCA1) MMTV-CreBRCA1flox/floxwere compared at age 12 to 13 months.(C)Mammary glands from MMTV-Cre BRCA1flox/ floxp53+/-mice contain epidermal growth factor receptor (EGFR) and aldehyde dehydrogenase 1 (ALDH1)-positive acini. Immunohistochemistry
for EGFR and ALDH1 was performed on fiveBRCA1-mutant mammary glands and seven Cre-negative controls. Representative images are shown at × 20 original magnification.(D)Erlotinib is active in suppressing the growth of murine MECs from mice of WT, MMTV-CreBRCA1flox/floxor
MMTVBRCA1flox/floxp53+/-background. All MECs were seeded in Matrigel-based cultures and photographed and analyzed for colony formation
100 200 300 400 500 0
25 50 75 100
Time of disease-free survival (days)
Cumul
ative disease-free survival
Erlotinib 100 mg/kg/day
Vehicle control
B
0 5 10 15 20 25
0 10 20 30 40
Treatment duration (days)
Rel
ative Tu
mor Vol
ume
ER-pos tumorsER-neg tumors vehicle control
(trendline)
[image:13.595.56.538.88.606.2]A
Figure 7Erlotinib as a chemopreventative agent in (MMTV-Cre) BRCA1flox/floxp53+/-mice.(A)Erlotinib prevents the emergence of
estrogen receptor-negative (ER-) but not estrogen receptor-positive (ER+) breast cancers in mouse mammary tumor virus-Cre recombinase
(MMTV-Cre)BRCA1flox/floxp53+/-mice. Virgin female mice were treated as controls or with 100 mg/kg erlotinib via oral gavage once daily, seven days per week. Tumors were recorded when they were first palpated. Kaplan-Meier graphing and analysis of disease-free survival were
in the erlotinib-treated cohort (n = 5 versus n = 19, respectively), indicating that erlotinib was effective in preventing the emergence of negative, but not ER-positive, breast cancers in this mouse model (Table 1). Importantly, EGFR staining showed that the erlotinib-treated cohort had a much lower number of EGFR-posi-tive tumors than the control group, again confirming that erlotinib treatments selected for EGFR-negative tumors (Table 1). ALDH1 staining was observed in nests and at the edges of the tumors in clusters (Addi-tional file 2, Figure S2) and was highly variable among tumors. There was a trend toward lower ALDH1 expression in the erlotinib-treated cohort; however, given the high variability of ALDH1 expression, statisti-cal significance was not reached. The Ki-67 labeling index as a marker for proliferation [37] was also highly variable between tumors and did not differ significantly between the erlotinib-treated and control cohorts, although there was a trend toward higher Ki-67 expres-sion in control tumors (Table 1). The cell death index as assessed by cleaved caspase 3 expression [37] was less variable, and we found a higher cell death index in the erlotinib-treated cohort than in controls, possibly indi-cating that a fraction of the tumor cells still responded to EGFR inhibition while the majority of tumor cells were resistant. Finally, we examined whether erlotinib had any effect on the growth of established tumors in this mouse model (Figure 7B). Tumor metrics showed that once tumors were established, erlotinib did not shrink these tumors, and tumors grew similarly to the vehicle control-treated tumors. The lack of efficacy of erlotinib on established tumors was seen in ER-negative and ER-positive tumors, further confirming that EGFR inhibition prevented the emergence of ER-negative tumors but likely did not kill nascent ER-negative tumors. In summary, we found that tumors that
emerged in erlotinib-treated mice tended to be positive for ER and negative for EGFR and ALDH1. Once tumors were established, their growth was not delayed by treatments with erlotinib, indicating that the majority of tumor cells are resistant to erlotinib treatment and grow independently of EGFR signaling.
Discussion
Haploinsufficiency phenotype ofBRCA1includes enhanced proliferation of MECs
We previously found that that the nonmalignant MECs fromBRCA1mutation carriers contain a subpopulation of progenitor cells with significantly increased clonal and proliferative potential compared with normal con-trols [8]. Of these cells, 79% had not undergone loss of heterozygosity but had remained heterozygous for BRCA1 (retention of heterozygosity), and these cells tended to differentiate into ER-negative, EGFR-positive colonies compared to controls. Our observations con-firm that even partial loss ofBRCA1 leads to an increase a MECs’ clonal proliferation (Figures 5 and 6), lending further support to the concept that haploinsufficiency of BRCA1with reduced protein levels ofBRCA1leads to a differentiation block coupled with enhanced prolifera-tion of MECs [8,38].
BRCA1wt andBRCA1-haploinsufficient MECs depend on
EGFR for proliferation
MECs rely on EGFR activation for migration, prolifera-tion and survival of mammary epithelial progenitor cells. However, the role that EGFR plays in either the initia-tion or the maintenance of the malignant phenotype is largely unknown. Regardless of whether the progenitor cell population expanded through the loss of BRCA1is defined by expression of ALDH1 [8,29] or Epcam
+
[image:14.595.58.538.99.259.2]/CD49+ [31], the progenitor cell population expanded
Table 1 Clinicopathologic features of observed tumors in erlotinib-treated prevention cohort and controlsa
Clinicopathologic features Erlotinib (N= 13) Control (N= 14) Pvalue
Median disease-free survival, days 365 256 0.0001
Number of tumors 19 31 0.0003
ER-positive tumors 14 12 n.s.
ER-negative tumors 5 19 0.0000002
EGFRb 0.0004
0 10 3
1+ 6 8
2+ 0 6
3+ 0 2
Mean ALDH1b, % (±SD) 3.8% (2.8%) 9.0% (9.8%) 0.11 (n.s.) Mean Ki-67b, % (±SD) 21.4% (14%) 30.4% (17.7%) 0.6 (n.s.) Mean cleaved caspase 3b, % (±SD) 18.4% (8.6%) 10.6% (8.4%) 0.018
a
ER, estrogen receptor; n.s., not significant; EGFR, epidermal growth factor receptor; ALDH1, aldehyde dehydrogenase 1; SD, standard deviation;b
only 16 tumors
in the erlotinib-treated cohort and 19 tumors in the control cohort could be processed for EGFR, ALDH1, cleaved caspase 3 and Ki-67. A two-sidedt-test was
in BRCA1mutation carriers shows high EGFR expres-sion relative to the control cells [8,31]. Here we show that suppression ofBRCA1leads directly to an increase in EGFR expression with increased clonal growth of MECs (Figure 5), which can be entirely suppressed by the EGFR inhibitor erlotinib (Figures 5 to 7), suggesting that while loss ofBRCA1 leads to an increase in EGFR activity, loss of BRCA1does not convey growth factor independence.
Multiple mechanisms contribute to theBRCA1-related increase in EGFR expression
A direct regulatory role ofBRCA1for the transcription of a receptor tyrosine kinase has been reported for the IGF-IR gene [20,21,39]. Abramovitchet al.[17] and Maor et al.[18] found that IGF-IR and IGF-IIR mRNA expres-sion levels are elevated in the tissues of women with a genetic predisposition to breast cancer. They showed that BRCA1interacts with and prevents the binding of the specificity protein 1 (Sp1) transcription factor to the IGF-IR receptor. Sp1 is a general transcription factor with a wide range of target promoters, with EGFR being among them [40]. Our data show that downregulation ofBRCA1 directly increased EGFR mRNA as well as EGFR promo-ter activity, suggesting transcriptional regulation (Figures 2A and 2B). Whether the regulation of EGFR transcrip-tion is also mediated by binding ofBRCA1to Sp1 is cur-rently unclear. In addition, we have shown a posttranslational effect ofBRCA1on EGFR protein stabi-lity (Figures 2C and 2D). The fact that two independent mechanisms converge to increase cellular EGFR levels afterBRCA1inhibition suggests the functional impor-tance of this regulatory axis.BRCA1 levels fluctuate throughout the cell cycle, and they are highest during the S phase and mitosis [41]. Downstream signaling from EGFR, however, is tightly suppressed during mitosis, as tyrosine phosphorylation of EGFR is highest in the G0/G1
phase, then gradually decreases during the S and G2
phases and reaches its lowest levels during the M phase [42]. Negative regulation of EGFR by BRCA1 would ensure the temporal separation between phases when demand for mitogenic signaling is high, that is, G0/G1,
and between phases when mitogenic signaling might interfere with DNA synthesis and repair, that is, the S phase. Such regulatory loops might be dysfunctional in MECs that have lost one or both alleles ofBRCA1, allow-ing for an increase in mitogenic signalallow-ing of MECs with inherent genetic instability and increased vulnerability to oncogenic transformation. In this scenario, the primary effects of loss ofBRCA1, that is, an increase in genetic instability, would cooperate with the secondary effect, an increase in EGFR signaling, toward proliferation and eventual transformation of cells with increased genetic instability.
This BRCA1-EGFR cooperation concept could poten-tially be broadly applicable to mitogenic signaling and might explain why not only EGFR but also IGF-IR [43] is increased in MECs that have lostBRCA1. It may also explain whyBRCA1 has a negative regulatory effect on the stability of phosphorylated Akt [24] and attenuates extracellular signal-regulated kinase activation in response to estrogen or EGF stimulation [44,45]. The hypothesis that even heterozygotic loss of BRCA1 may allow for an increase in mitogenic signaling and thereby convey a growth advantage to MECs with genetic instability is further supported by the fact thatBRCA1 mutation carriers have a strikingly high frequency of atypical ductal hyperplasia (38% inBRCA1carriers ver-sus 4% in control tissues) and ductal carcinomain situ (13% inBRCA1 carriers versus none in control tissues) [46], which most often is negative for ER and positive for EGFR [47].
EGFR inhibition is effective for the prevention but not for the treatment ofBRCA1-related breast cancers
The expression of EGFR in breast cancer has been linked to endocrine resistance and poor outcomes [48-50]. It has also been postulated that EGFR activation may be an important step in the progression to estrogen independence [51]. EGFR overexpression appears to cor-relate with the basaloid phenotype and is found in 67% of BRCA1-related cancers versus only 18% of non-BRCA1-related breast cancers [6]. These findings have prompted the launching of several clinical trials to examine the therapeutic efficacy of the EGF inhibitors gefitinib and erlotinib in ER-negative breast cancer. Early outcome data do not point toward major activity of EGFR inhibitors in unselected patients with meta-static breast cancer [52]. Similarly, presurgical exposure studies have shown only modest or no activity of erloti-nib on the proliferative index of TNBCs [53]. Our stu-dies confirm that while erlotinib prevents the emergence of TNBCs, manifest breast tumors grow independently of EGFR signaling (Figure 7B).
EGFR inhibition prevents the emergence of ER-negative but not of ER-positive breast cancers inBRCA1-mutant mice
have been successfully used for the prevention of breast cancer in experimental mouse models [54-57]. However, these mice wereBRCA1-proficient and at risk for breast cancer because of overexpression of transgenic erbB2 (Her2), which is a member of the EGFR family and a direct target for the drugs used in those studies, that is, lapatinib or gefitinib. However, in humans, erbB2 ampli-fication is the result of a somatic mutation. Thus, it is currently not possible to identify women at risk for the development of Her2-positive breast cancer, thereby limiting the applicability of these data. On the other hand, there is a need to develop medicinal therapeutic strategies for the prevention of TNBC, especially in BRCA1 mutation carriers, and our mouse model data suggest that targeting the EGFR pathway might be pro-mising. While erlotinib has a relatively benign toxicity profile, the expected dermatological complications [58] and unknown long-term effects will likely still make it prohibitive to use this particular drug for preventive purposes without time limits. An as yet unsolved ques-tion is whether a shorter, limited time period of EGFR inhibition would be protective beyond the actual treat-ment time, and we are planning to address this issue in this mouse model. However, as increasingly naturally occurring compounds that suppress EGFR signaling are discovered, substances such as allophycocyanins might hold promise for use as chemopreventive agents [59,60]. Our studies suggest that the window of opportunity for effective breast cancer prevention using EGFR inhibitors is a state at which loss of BRCA1 and gain of EGFR have occurred, but the growth factor independence of cancer cells has not yet been established.
Conclusions
We have identified a cooperative effect of loss ofBRCA1 with gain of EGFR expression that leads to increased clonal proliferation of MECs and may render these cells vulnerable to malignant transformation. This coopera-tive effect is achieved by transcriptional upregulation as well as posttranslational stabilization of EGFR upon BRCA1 downregulation. In addition, cells with loss of BRCA1 are enriched for the highly EGFR-expressing ALDH1-positive population. The tumorigenic effect of the cooperation of loss of BRCA1with gain of EGFR in nonmalignant MECs can be disrupted by the preventive use of the EGFR inhibitor erlotinib. Thus, at the prema-lignant stage, EGFR inhibition may provide a window of opportunity for breast cancer prevention.
Additional material
Additional file 1: Figure S1. Loss ofBRCA1leads to an increase in the
CD24lowCD44highstem cell population in mammary epithelial cells
(MECs). MCF-10A or human MEC (HMLE) cell lines expressing either
control orBRCA1-inhibitory small hairpin (shRNA) constructs were examined for CD24 and CD44 expression using dual color flow cytometry. Gates were set using isotype controls for the respective antibodies. Note that the increase in CD24 and loss of CD44 were more pronounced in HMLE cells than in MCF-10 cells. However, in both cell lines, inhibition ofBRCA1led to a notable increase in CD24lowCD44high
cells (from 1.1% (control) to 3.8% (sh1) and 8% (sh2) in MCF-10 cells and from 2.6% (control) to 9.2% (sh1) and 11.6% (sh2) in HMLE cells, respectively).
Additional file 2: Figure S2. Immunohistochemistry of tumors in the
erlotinib prevention cohort or controls. Aldehyde dehydrogenase 1 (ALDH1) staining tended to be cytoplasmic and to occur in nests and clusters of cells, as well as at the edges of tumors. Epidermal growth factor receptor (EGFR) staining was seen at the cell membrane and to some extent in the cytoplasm. Estrogen receptor and Ki-67 staining were nuclear, and anti-cleaved caspase 3 antibodies stained cells entirely.
Abbreviations
3D: three-dimensional; ADH: atypical ductal hyperplasia; ALDH1: aldehyde dehydrogenase 1; ATCC: American Type Culture Collection; BAAA: BODIPY aminoacetaldehyde;BRCA1: breast cancer gene 1; cDNA: complementary deoxyribonucleic acid; Cre: Cre recombinase; DAPI: 4’ ,6-diamidino-2-phenylindole; DCIS: ductal carcinomain situ; DEAB:
diethylaminobenzaldehyde; EGF: epidermal growth factor; EGFR: epidermal growth factor receptor; EpCam: epithelial cell adhesion molecule; ER: estrogen receptor; Erk: extracellular signal-regulated kinase; f: floxed; FBS: fetal bovine serum; GFP: green fluorescent protein; hMEC: human mammary epithelial cell; IGF-IR: type I insulin-like growth factor receptor; IgG2b: immunoglobulin G2b; MEC: mammary epithelial cell; MMTV, mouse mammary tumor virus; mRNA: messenger RNA; MTT: 3-(4,5-dimethylthiazol-2-yl)-2,5-diphenyltetrazolium bromide; PBS: phosphate-buffered saline; PCR: polymerase chain reaction; PE: phycoerythrin; PR: progesterone receptor; Renilla TK: Renilla thymidine kinase; RNA: ribonucleic acid; RT-PCR: real-time polymerase chain reaction; shRNA: small hairpin RNA; siRNA: small interfering RNA; Sp1: specificity protein 1; TNBC: triple-negative breast cancer; wt: wild type.
Acknowledgements
We thank Drs. Lewis C. Cantley, Christina Gewinner, Susmu Kobayashi and Kun Ping Lu for their advice. We thank Drs. Xiaoling Xu and Chu-Xia Deng, who generated mice with the conditionalBRCA1mutation and made these available to us via the National Cancer Institute repository. We thank Dr. Robert Weinberg for hMEC-hTERT and HMLE cells. We thank Dr. Mihnea Bostina for his adaptation of the Signature software package. We thank Drs. Benjamin Purow and AC Johnson for the EGFR luciferase construct. This study and manuscript preparation were funded by research grants to the corresponding author (GW) from the Susan G Komen Foundation (BCTR0601030), a Career Development Award through the Specialized Programs of Research Excellence in Breast Cancer CA089393 (National Institutes of Health (NIH)), a Concept Award from the Department of Defense (BC 046321) and a K08 Clinician Scientist Award (K08 CA093655-04, NIH). The funding agencies did not have a role in the collection, analysis or interpretation of data; in the writing of the manuscript; or in the decision to submit the manuscript for publication.
Author details 1
Division of Hematology/Oncology, Beth Israel Deaconess Medical Center, 330 Brookline Avenue, Boston MA 02215, USA.2Cancer Biology Program,
Beth Israel Deaconess Medical Center, Brookline Avenue, Boston MA 02215, USA.3Department of Surgery, Brigham and Women’s Hospital, Boston, MA
02115, USA.
Authors’contributions
Competing interests
The authors declare that they have no competing interests.
Received: 23 July 2010 Revised: 30 December 2010 Accepted: 11 March 2011 Published: 11 March 2011
References
1. Fisher B, Costantino JP, Wickerham DL, Cecchini RS, Cronin WM, Robidoux A, Bevers TB, Kavanah MT, Atkins JN, Margolese RG,et al:
Tamoxifen for the prevention of breast cancer: current status of the National Surgical Adjuvant Breast and Bowel Project P-1 study.J Natl Cancer Inst2005,97:1652-1662.
2. Cleator S, Heller W, Coombes RC:Triple-negative breast cancer: therapeutic options.Lancet Oncol2007,8:235-244.
3. Trivers KF, Lund MJ, Porter PL, Liff JM, Flagg EW, Coates RJ, Eley JW:The epidemiology of triple-negative breast cancer, including race.Cancer Causes Control2009,20:1071-1082.
4. Foulkes WD:Clinically relevant biology of hereditary breast cancer.Semin Oncol2007,34:379-383.
5. Collins LC, Martyniak AJ, Kandel MJ, Stadler ZK, Masciari S, Miron A, Richardson AL, Schnitt SJ, Garber JE:Basal Cytokeratin and Epidermal Growth Factor Receptor Expression Are Not Predictive of BRCA1 Mutation Status in Women With Triple-negative Breast Cancers.Am J Surg Pathol2009,33:1093-1097.
6. van der Groep P, Bouter A, van der Zanden R, Siccama I, Menko FH, Gille JJ, van Kalken C, van der Wall E, Verheijen RH, van Diest PJ:Distinction between hereditary and sporadic breast cancer on the basis of clinicopathological data.J Clin Pathol2006,59:611-617.
7. Birgisdottir V, Stefansson OA, Bodvarsdottir SK, Hilmarsdottir H, Jonasson JG, Eyfjord JE:Epigenetic silencing and deletion of the BRCA1 gene in sporadic breast cancer.Breast Cancer Res2006,8:R38.
8. Burga LNTN, Troyan SE, Bostina M, Miron A, Konstantinopoulos P, Fountzilas H, Spentzos D, Lee B, Wulf GM:Altered Differentiation and Proliferation Properties of Primary Mammary Epithelial Cells (PMECs) from BRCA1 mutation Carriers.Cancer Res2009,69:1273-1278. 9. Nishi H, Senoo M, Nishi KH, Murphy B, Rikiyama T, Matsumura Y, Habu S,
Johnson AC:p53 Homologue p63 represses epidermal growth factor receptor expression.J Biol Chem2001,276:41717-41724.
10. Ben-Dor I, Itsykson P, Goldenberg D, Galun E, Reubinoff BE:Lentiviral vectors harboring a dual-gene system allow high and homogeneous transgene expression in selected polyclonal human embryonic stem cells.Mol Ther2006,14:255-267.
11. Burga LN, Tung NM, Troyan SL, Bostina M, Konstantinopoulos PA, Fountzilas H, Spentzos D, Miron A, Yassin YA, Lee BT, Wulf GM:Altered proliferation and differentiation properties of primary mammary epithelial cells from BRCA1 mutation carriers.Cancer Res2009,
69:1273-1278.
12. Chen JZ, Grigorieff N:SIGNATURE: a single-particle selection system for molecular electron microscopy.J Struct Biol2007,157:168-173. 13. Carraway KL, Cerione RA:Fluorescent-labeled growth factor molecules
serve as probes for receptor binding and endocytosis.Biochemistry1993,
32:12039-12045.
14. Schmitz G, Wulf G, Bruning T, Assmann G:Flow-cytometric determination of high-density-lipoprotein binding sites on human leukocytes.Clin Chem1987,33:2195-2203.
15. Xu X, Wagner KU, Larson D, Weaver Z, Li C, Ried T, Hennighausen L, Wynshaw-Boris A, Deng CX:Conditional mutation of Brca1 in mammary epithelial cells results in blunted ductal morphogenesis and tumour formation.Nat Genet1999,22:37-43.
16. Wagner KU, Wall RJ, St-Onge L, Gruss P, Wynshaw-Boris A, Garrett L, Li M, Furth PA, Hennighausen L:Cre-mediated gene deletion in the mammary gland.Nucleic Acids Res1997,25:4323-4330.
17. Donehower LA, Harvey M, Slagle BL, McArthur MJ, Montgomery CA Jr, Butel JS, Bradley A:Mice deficient for p53 are developmentally normal but susceptible to spontaneous tumours.Nature1992,356:215-221. 18. Miller FR, Soule HD, Tait L, Pauley RJ, Wolman SR, Dawson PJ, Heppner GH:
Xenograft model of progressive human proliferative breast disease.J Natl Cancer Inst1993,85:1725-1732.
19. Elenbaas B, Spirio L, Koerner F, Fleming MD, Zimonjic DB, Donaher JL, Popescu NC, Hahn WC, Weinberg RA:Human breast cancer cells
generated by oncogenic transformation of primary mammary epithelial cells.Genes Dev2001,15:50-65.
20. Abramovitch S, Glaser T, Ouchi T, Werner H:BRCA1-Sp1 interactions in transcriptional regulation of the IGF-IR gene.FEBS Lett2003,
541:149-154.
21. Maor SB, Abramovitch S, Erdos MR, Brody LC, Werner H:BRCA1 suppresses insulin-like growth factor-I receptor promoter activity: potential interaction between BRCA1 and Sp1.Mol Genet Metab2000,69:130-136. 22. Parvin JD:The BRCA1-dependent ubiquitin ligase, gamma-tubulin, and
centrosomes.Environ Mol Mutagen2009,50:649-653.
23. Ma Y, Fan S, Hu C, Meng Q, Fuqua SA, Pestell RG, Tomita YA, Rosen EM:
BRCA1 regulates acetylation and ubiquitination of estrogen receptor-alpha.Mol Endocrinol24:76-90.
24. Xiang T, Ohashi A, Huang Y, Pandita TK, Ludwig T, Powell SN, Yang Q:
Negative Regulation of AKT Activation by BRCA1.Cancer Res2008,
68:10040-10044.
25. Asselin-Labat ML, Shackleton M, Stingl J, Vaillant F, Forrest NC, Eaves CJ, Visvader JE, Lindeman GJ:Steroid hormone receptor status of mouse mammary stem cells.J Natl Cancer Inst2006,98:1011-1014.
26. Burke PM, Wiley HS:Human mammary epithelial cells rapidly exchange empty EGFR between surface and intracellular pools.J Cell Physiol1999,
180:448-460.
27. Agelopoulos K, Greve B, Schmidt H, Pospisil H, Kurtz S, Bartkowiak K, Andreas A, Wieczorek M, Korsching E, Buerger H, Brandt B:Selective regain of egfr gene copies in CD44+/CD24-/low breast cancer cellular model MDA-MB-468.BMC Cancer10:78.
28. Wright MH, Calcagno AM, Salcido CD, Carlson MD, Ambudkar SV, Varticovski L:Brca1 breast tumors contain distinct CD44+/CD24- and CD133+ cells with cancer stem cell characteristics.Breast Cancer Res2008,
10:R10.
29. Liu S, Ginestier C, Charafe-Jauffret E, Foco H, Kleer CG, Merajver SD, Dontu G, Wicha MS:BRCA1 regulates human mammary stem/progenitor cell fate.Proc Natl Acad Sci USA2008,105:1680-1685.
30. Schmidt-Glenewinkel H, Reinz E, Eils R, Brady NR:Systems biological analysis of epidermal growth factor receptor internalization dynamics for altered receptor levels.J Biol Chem2009,284:17243-17252. 31. Lim E, Vaillant F, Wu D, Forrest NC, Pal B, Hart AH, Asselin-Labat ML,
Gyorki DE, Ward T, Partanen A,et al:Aberrant luminal progenitors as the candidate target population for basal tumor development in BRCA1 mutation carriers.Nat Med2009,15:907-913.
32. Ginestier C, Hur MH, Charafe-Jauffret E, Monville F, Dutcher J, Brown M, Jacquemier J, Viens P, Kleer CG, Liu S,et al:ALDH1 is a marker of normal and malignant human mammary stem cells and a predictor of poor clinical outcome.Cell Stem Cell2007,1:555-567.
33. Pannu KK, Joe ET, Iyer SB:Performance evaluation of QuantiBRITE phycoerythrin beads.Cytometry2001,45:250-258.
34. Brodie SG, Xu X, Qiao W, Li WM, Cao L, Deng CX:Multiple genetic changes are associated with mammary tumorigenesis in Brca1 conditional knockout mice.Oncogene2001,20:7514-7523. 35. Higgins B, Kolinsky K, Smith M, Beck G, Rashed M, Adames V, Linn M,
Wheeldon E, Gand L, Birnboeck H, Hoffmann G:Antitumor activity of erlotinib (OSI-774, Tarceva) alone or in combination in human non-small cell lung cancer tumor xenograft models.Anticancer Drugs2004,
15:503-512.
36. Ludwig T, Fisher P, Ganesan S, Efstratiadis A:Tumorigenesis in mice carrying a truncating Brca1 mutation.Genes Dev2001,15:1188-1193. 37. Shah C, Miller TW, Wyatt SK, McKinley ET, Olivares MG, Sanchez V,
Nolting DD, Buck JR, Zhao P, Ansari MS,et al:Imaging biomarkers predict response to anti-HER2 (ErbB2) therapy in preclinical models of breast cancer.Clin Cancer Res2009,15:4712-4721.
38. Furuta S, Jiang X, Gu B, Cheng E, Chen PL, Lee WH:Depletion of BRCA1 impairs differentiation but enhances proliferation of mammary epithelial cells.Proc Natl Acad Sci USA2005,102:9176-9181.
39. Shukla V, Coumoul X, Cao L, Wang RH, Xiao C, Xu X, Ando S, Yakar S, Leroith D, Deng C:Absence of the full-length breast cancer-associated gene-1 leads to increased expression of insulin-like growth factor signaling axis members.Cancer Res2006,66:7151-7157.
40. Xu J, Thompson KL, Shephard LB, Hudson LG, Gill GN:T3 receptor suppression of Sp1-dependent transcription from the epidermal growth factor receptor promoter via overlapping DNA-binding sites.J Biol Chem
41. Chen Y, Farmer AA, Chen CF, Jones DC, Chen PL, Lee WH:BRCA1 is a 220-kDa nuclear phosphoprotein that is expressed and phosphorylated in a cell cycle-dependent manner.Cancer Res1996,56:3168-3172.
42. Kiyokawa N, Lee EK, Karunagaran D, Lin SY, Hung MC:Mitosis-specific negative regulation of epidermal growth factor receptor, triggered by a decrease in ligand binding and dimerization, can be overcome by overexpression of receptor.J Biol Chem1997,272:18656-18665. 43. Maor S, Yosepovich A, Papa MZ, Yarden RI, Mayer D, Friedman E, Werner H:
Elevated insulin-like growth factor-I receptor (IGF-IR) levels in primary breast tumors associated with BRCA1 mutations.Cancer Lett2007,
257:236-243.
44. Razandi M, Pedram A, Rosen EM, Levin ER:BRCA1 inhibits membrane estrogen and growth factor receptor signaling to cell proliferation in breast cancer.Mol Cell Biol2004,24:5900-5913.
45. Yan Y, Haas JP, Kim M, Sgagias MK, Cowan KH:BRCA1-induced apoptosis involves inactivation of ERK1/2 activities.J Biol Chem2002,
277:33422-33430.
46. Kauff ND, Brogi E, Scheuer L, Pathak DR, Borgen PI, Hudis CA, Offit K, Robson ME:Epithelial lesions in prophylactic mastectomy specimens from women with BRCA mutations.Cancer2003,97:1601-1608. 47. van der Groep P, van Diest PJ, Menko FH, Bart J, de Vries EG, van der
Wall E:Molecular profile of ductal carcinoma in situ of the breast in BRCA1 and BRCA2 germline mutation carriers.J Clin Pathol2009,
62:926-930.
48. Klijn JG, Berns PM, Schmitz PI, Foekens JA:The clinical significance of epidermal growth factor receptor (EGF-R) in human breast cancer: a review on 5232 patients.Endocr Rev1992,13:3-17.
49. Fox SB, Harris AL:The epidermal growth factor receptor in breast cancer. J Mammary Gland Biol Neoplasia1997,2:131-141.
50. Rampaul RS, Pinder SE, Nicholson RI, Gullick WJ, Robertson JF, Ellis IO:
Clinical value of epidermal growth factor receptor expression in primary breast cancer.Adv Anat Pathol2005,12:271-273.
51. Gee JM, Hutcheson IR:Understanding endocrine resistance: the critical need for sequential samples from clinical breast cancer and novel in vitro models.Breast Cancer Res2005,7:187-189.
52. Dickler MN, Cobleigh MA, Miller KD, Klein PM, Winer EP:Efficacy and safety of erlotinib in patients with locally advanced or metastatic breast cancer.Breast Cancer Res Treat2009,115:115-121.
53. Guix M, Granja Nde M, Meszoely I, Adkins TB, Wieman BM, Frierson KE, Sanchez V, Sanders ME, Grau AM, Mayer IA,et al:Short preoperative treatment with erlotinib inhibits tumor cell proliferation in hormone receptor-positive breast cancers.J Clin Oncol2008,26:897-906. 54. Lu C, Speers C, Zhang Y, Xu X, Hill J, Steinbis E, Celestino J, Shen Q, Kim H,
Hilsenbeck S,et al:Effect of epidermal growth factor receptor inhibitor on development of estrogen receptor-negative mammary tumors.J Natl Cancer Inst2003,95:1825-1833.
55. Li Y, Brown PH:Prevention of ER-negative breast cancer.Recent Results Cancer Res2009,181:121-134.
56. Strecker TE, Shen Q, Zhang Y, Hill JL, Li Y, Wang C, Kim HT, Gilmer TM, Sexton KR, Hilsenbeck SG,et al:Effect of lapatinib on the development of estrogen receptor-negative mammary tumors in mice.J Natl Cancer Inst
2009,101:107-113.
57. Lenferink AE, Simpson JF, Shawver LK, Coffey RJ, Forbes JT, Arteaga CL:
Blockade of the epidermal growth factor receptor tyrosine kinase suppresses tumorigenesis in MMTV/Neu + MMTV/TGF-alpha bigenic mice.Proc Natl Acad Sci USA2000,97:9609-9614.
58. Rhee J, Oishi K, Garey J, Kim E:Management of rash and other toxicities in patients treated with epidermal growth factor receptor-targeted agents.Clin Colorectal Cancer2005,5(Suppl 2):S101-106.
59. Afaq F, Zaman N, Khan N, Syed DN, Sarfaraz S, Zaid MA, Mukhtar H:
Inhibition of epidermal growth factor receptor signaling pathway by delphinidin, an anthocyanidin in pigmented fruits and vegetables.Int J Cancer2008,123:1508-1515.
60. Zhang Y, Vareed SK, Nair MG:Human tumor cell growth inhibition by nontoxic anthocyanidins, the pigments in fruits and vegetables.Life Sci
2005,76:1465-1472.
doi:10.1186/bcr2850
Cite this article as:Burgaet al.:Loss ofBRCA1leads to an increase in epidermal growth factor receptor expression in mammary epithelial cells, and epidermal growth factor receptor inhibition prevents
estrogen receptor-negative cancers inBRCA1-mutant mice.Breast Cancer
Research201113:R30.
Submit your next manuscript to BioMed Central and take full advantage of:
• Convenient online submission
• Thorough peer review
• No space constraints or color figure charges
• Immediate publication on acceptance
• Inclusion in PubMed, CAS, Scopus and Google Scholar
• Research which is freely available for redistribution