T E C H N I C A L N O T E
Open Access
A collection of bioconductor methods to visualize
gene-list annotations
Gang Feng
†, Pan Du
†, Nancy L Krett, Michael Tessel, Steven Rosen, Warren A Kibbe, Simon M Lin
*Abstract
Background:Gene-list annotations are critical for researchers to explore the complex relationships between genes and functionalities. Currently, the annotations of a gene list are usually summarized by a table or a barplot. As such, potentially biologically important complexities such as one gene belonging to multiple annotation categories are difficult to extract. We have devised explicit and efficient visualization methods that provide intuitive methods for interrogating the intrinsic connections between biological categories and genes.
Findings:We have constructed a data model and now present two novel methods in a Bioconductor package, “GeneAnswers”, to simultaneously visualize genes, concepts (a.k.a. annotation categories), and concept-gene connections (a.k.a. annotations): the“Concept-and-Gene Network” and the“Concept-and-Gene Cross Tabulation”. These methods have been tested and validated with microarray-derived gene lists.
Conclusions:These new visualization methods can effectively present annotations using Gene Ontology, Disease Ontology, or any other user-defined gene annotations that have been pre-associated with an organism’s genome by human curation, automated pipelines, or a combination of the two. The gene-annotation data model and associated methods are available in the Bioconductor package called“GeneAnswers “described in this publication.
Findings
The gene list from a microarray study is usually sum-marized by Gene Ontology [1] or Disease Ontology [2] annotations to provide a higher-level understanding of the functionalities of the genes identified in such an experiment. We explored the existing methods available in Bioconductor http://www.bioconductor.org to visua-lize the annotation results, and then extended those methods to create the GeneAnswers package.
The Gene-annotation Data Model
Formally, the annotation is a mapping between the two sets: genes G and concepts C,
: .
Note that these mappings are usually many-to-many, i. e., one gene belongs to multiple concepts and one con-cept includes multiple genes.
Accordingly, we implement the following Gen-eAnswers class in our Bioconductor package of “ Gen-eAnswers“(Table 1).
The GeneAnswers package calls different modules to
generate the figures depending on the users’
requirements.
Testing Data Set
The testing dataset was obtained from a microarray experiment running on Affymetrix human HG-U133A + version 2.0 chips for a multiple myeloma cell line treated with dexamethasone for 24 hours (three biolo-gical replicates). Dexamethasone is a synthetic gluco-corticoid. Glucocorticoids are used to treat several hematologic malignancies including multiple myeloma, however the mechanism of action is not completely understood. The gene list from the microarray experi-ment can help us gain a better understanding of the glucocorticoid-induced gene regulation in myeloma cell lines.
In this dataset, there were 319 genes identified as sig-nificantly differentially expressed, based on cut-off cri-teria of fold change more than 2 and False Discovery Rate (FDR) less than 0.01. Using our new Bioconductor * Correspondence: [email protected]
†Contributed equally
Northwestern University Biomedical Informatics Center (NUBIC, part of the Northwestern CTSA) and The Robert H. Lurie Comprehensive Cancer Center, Northwestern University, Chicago, IL 60611, USA
package - GeneAnswers, a hypergeometic test [3] for over-represented Gene Ontology (GO) terms of the input gene list was conducted. The final GeneAnswers output, describing the GO analysis results of the input gene list (including GO identifiers, GO terms, gene numbers, hypergeometric test p-values and genes), was generated and the results sorted by hypergeometic test p-values. Six relevant GO terms were selected for further analysis based on their biological importance and statistical significance. This testing data set is included in the GeneAnswers package as an example.
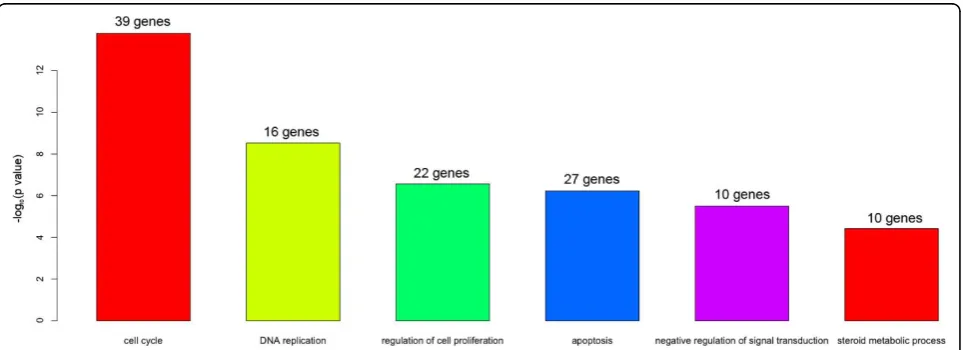
Barplots
As discussed above, we selected six GO terms and tested their significance in the list of 319 genes via a hypergeometic test. The result is shown as a barplot in Figure 1, which includes the test statistics and the num-ber of genes in each category. However, the barplot can-not provide more details about additional relationships between the genes and the GO terms. For instance, the gene DHCR24 (full name: 24-dehydrocholesterol
reductase) is involved in three biologically relevant GO categories (cell cycle, apoptosis and steroid metabolism). From the barplot, it is not clear how many genes belong to multiple categories.
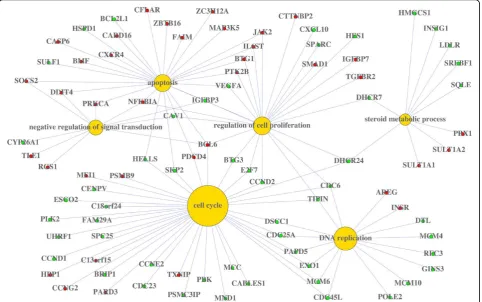
Concept-and-Gene Networks
One of the most important contributions of the eAnswers package is to formally introduce the Gen-eAnswers class (the concept-to-gene mapping class) into Bioconductor. With this class, the package can visually represent the relationship between genes and any given concepts (gene ontology, disease ontology, and etc.) in two different ways: a concept-and-gene-network, high-lighting the involvement of a gene in multiple annota-tion concepts; and the concept-and-gene cross tabulation, which enables a more traditional heat map visualization with annotations.
The concept-and-gene network shows the complex relationship between the genes and the given concepts (Figure 2). It can also include more information, such as gene expression levels, by adding colors to the gene sym-bols. This type of presentation can visually highlight the key genes that are involved in several different concepts. Unlike the previous barplot, one can easily find the gene DHCR24 involved in three different categories: cell cycle, apoptosis and steroid metabolic process in Figure 2.
Researchers might be more interested in the relation-ship between gene expression profile and relative GO terms. Therefore, the GeneAnswers package also sup-plies another way, the “concept-and-gene cross tabula-tion”, to show such details.
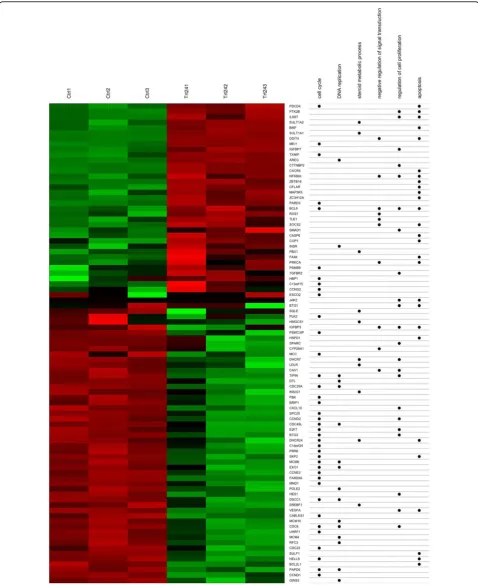
Concept-and-Gene Cross Tabulations
[image:2.595.57.292.99.253.2]The“concept-and-gene cross tabulation” combines the traditional heat map with the annotation table. For example, researchers can identify that DHCR24, down regulated in the treatment samples, is related to three Table 1 The GeneAnswers Class
GeneAnswers Class
Slots:
* Category list ()
* Gene list (): Gene IDs (required)
Fold Change (optional) Expression profile (optional) Hypergeometric test result (calculated) () Methods:
* Barplot
[image:2.595.58.540.529.704.2]* Concept-and-gene network * Concept-and-gene cross tabulations
relevant biological processes (Figure 3). Note that the order of the concepts (columns on the right side) can be rearranged by clustering the presence/absence matrix of the genes associated with each concept; users have the option to turn on or off the clustering.
Users can combine these two types of visualization tools to identify which genes and biological pathways are potentially involved in the treatment effects. For instance, it is clear from Figure 2 and Figure 3 that genes associated with DNA replication- such as CDC6, CDC45L, CDC25A, MCM4, MCM10, and MCM6 - are all down regulated after dexamethasone treatment.
Conclusion
The “Concept-and-Gene Network” and the “ Concept-and-Gene Cross Tabulation” visualization methods pro-vided by the new Bioconductor package“GeneAnswers” are powerful tools that generate a macroscopic view for investigators to understand the relationships between a given gene list and relevant annotations. In addition to seeing an easy to understand blueprint for all genes and statistically significant annotation categories, researchers are also able to identify key genes involved in several different categories and visualize how the gene
expression patterns relate to each potential pathway and biological functions. These visualization methods can be incorporated into large-scale genomic data processing pipelines. As of this release, the GeneAnswers Biocon-ductor package only generates static images. As the number of genes reaches to the magnitude of thousands, the gene symbols and concept categories in the figure will be cramped, although the overall structure can be legible. Such a limitation can be addressed by interactive figures with zooming or scrolling capabilities.
Availability and requirements Project name: GeneAnswers
Project home page: http://bioconductor.org/packages/ 2.5/bioc/html/GeneAnswers.html
[image:3.595.58.541.390.692.2]Operating system(s): Platform independent Programming language: R version 2.9.0 or higher Other requirements: annotate 1.20.0, AnnotationDbi 1.6.0, Biobase 2.2.0, DBI 0.2.4, GO.db 2.2.11, KEGG.db 2.2.11, the most updated Megadata packages, org.Hs.eg. db, org.Mm.eg.db, org.Rt.eg.db in Bioconductor and igraph 0.5.1, RSQLite 0.7.1, XML 1.98.1, xtable 1.5.4 Heatplus 1.12.0, MASS 7.2.44, RColorBrewer 1.0.2 in R
Figure 2Concept-and-gene network. Green and red solid circles represent down and up regulation of genes, respectively. Yellow solid circles stand for the given GO categories. The size of each yellow dot is proportional to the statistical significance of the identified genes in
Acknowledgements
The authors would like to thank Drs. Spencer Huang, Hongmei Jiang, and Julie Zhu for critical reading of the manuscript. This project was supported in part by Award Number UL1RR025741 from the National Center for Research Resources, National Institutes of Health; Senior Investigator award from the Multiple Myeloma Research Foundation to NK; and RO1 CA085915 to SR. The content is solely the responsibility of the authors and does not necessarily represent the official views of the National Center for Research Resources, the Multiple Myeloma Research Foundation, or the National Institutes of Health.
Authors’contributions
GF, DP, SL and WK participated in the GeneAnswers package coding and drafted the manuscript. NK, MT, and SR designed and conducted the Affymetrix experiment. All authors read and approved the final manuscript.
Competing interests
The authors declare that they have no competing interests.
Received: 25 August 2009
Accepted: 19 January 2010 Published: 19 January 2010
References
1. Ashburner M, Ball CA, Blake JA,et al:Gene ontology: tool for the unification of biology. The Gene Ontology Consortium.Nat Genet2000,
25:25-29.
2. Du P, Feng G, Flatow J,et al:From disease ontology to disease-ontology lite: statistical methods to adapt a general-purpose ontology for the test of gene-ontology associations.Bioinfomatics2009,25:i63-8.
3. Adams WT, Skopek TR:Statistical test for the comparison of samples from mutational spectra.J Mol Biol1987,194:391-6.
doi:10.1186/1756-0500-3-10
Cite this article as:Fenget al.:A collection of bioconductor methods to visualize gene-list annotations.BMC Research Notes20103:10.
Submit your next manuscript to BioMed Central and take full advantage of:
• Convenient online submission
• Thorough peer review
• No space constraints or color figure charges
• Immediate publication on acceptance
• Inclusion in PubMed, CAS, Scopus and Google Scholar
• Research which is freely available for redistribution