Open Access
Technical Note
Evaluation of errors and limits of the 63-μm house-dust-fraction
method, a surrogate to predict hidden moisture damage
Christoph Baudisch
1, Ojan Assadian*
2and Axel Kramer
3Address: 1State Health and Social Office of Mecklenburg-Pomerania, Branch Office Schwerin, Germany, 2Clinical Institute for Hygiene and Medical
Microbiology of the Medical University of Vienna, Department of Hospital Hygiene, Vienna General Hospital, Waehringer Guertel 18-20, 1090 Vienna, Austria and 3Institute for Hygiene and Environmental Medicine, Ernst Moritz Arndt University, Greifswald, Germany
Email: Christoph Baudisch - [email protected]; Ojan Assadian* - [email protected]; Axel Kramer - [email protected]
* Corresponding author
Abstract
Background: The aim of this study is to analyze possible random and systematic measurement errors and to detect methodological limits of the previously established method.
Findings: To examine the distribution of random errors (repeatability standard deviation) of the detection procedure, collective samples were taken from two uncontaminated rooms using a sampling vacuum cleaner, and 10 sub-samples each were examined with 3 parallel cultivation plates (DG18). In this two collective samples of new dust, the total counts of Aspergillus spp. varied moderately by 25 and 29% (both 9 cfu per plate). At an average of 28 cfu/plate, the total number varied only by 13%.
For the evaluation of the influence of old dust, old and fresh dust samples were examined. In both cases with old dust, the old dust influenced the results indicating false positive results, where hidden moist was indicated but was not present. To quantify the influence of sand and sieving, 13 sites were sampled in parallel using the 63-μm- and total dust collection approaches. Sieving to 63-μm resulted in a more then 10-fold enrichment, due to the different quantity of inert sand in each total dust sample.
Conclusion: The major errors during the quantitative evaluation from house dust samples for mould fungi as reference values for assessment resulted from missing filtration, contamination with old dust and the massive influence of soil. If the assessment is guided by indicator genera, the percentage standard deviation lies in a moderate range.
Background
Quantitative measurements of mould colonizing in the 63-μm fraction of house dust is a suitable surrogate method to evaluate present or hidden moisture damage [1]. As there always will be an influence by the outdoor air, we assessed methodological possibilities to control this influence at the level of interpretation of the measure-ments. The further development of the assessment model
was based on two facts influenced by the outdoor air: first, the background load of all species increases in summer. This is compensated through a percent evaluation of moulds relative to the total number. Second, the indicator genera Aspergillus spp., Eurotium spp., or Penicillium spp. occur "relatively" constantly throughout the year in rooms. Hence, the increased amounts of these genera indicate moisture damage. The percent evaluation of Published: 24 October 2009
BMC Research Notes 2009, 2:218 doi:10.1186/1756-0500-2-218
Received: 9 April 2009 Accepted: 24 October 2009
This article is available from: http://www.biomedcentral.com/1756-0500/2/218
© 2009 Assadian et al; licensee BioMed Central Ltd.
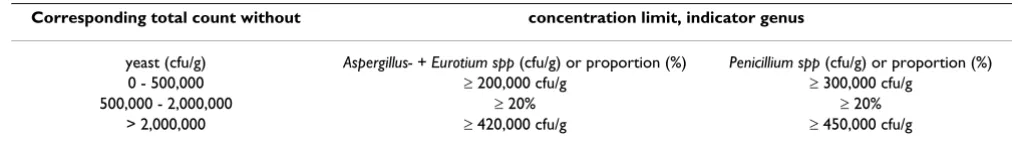
indicator genera is intended - above a base load in winter - to eliminate the summer influence (Table 1).
Our previous measurements allowed generation of refer-ence values for a house dust monitoring method to detect hidden moisture damage controlling widely for the influ-ence of outdoor air, accumulated old dust, and dust swirled up from room surfaces. The aim of the present study was to analyze possible random and systematic measurement errors and to detect methodological limits of the previously established method caused by statistical broad standard deviations, influence of old dust, sand and sieving, contamination with soil, stability of samples, mass or surface relation, assessment by indicator genera, sampling with filter holder or with vacuum-cleaner.
Findings
Random errors
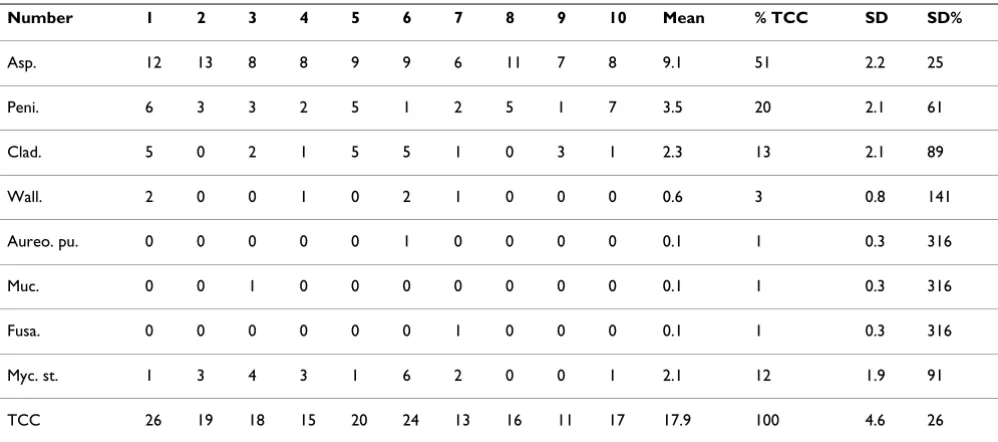
To evaluate the distribution of random errors (repeatability occurring standard deviation) of the measurement, a col-lective sample was taken from a non-colonized (non-mouldy) room using a sampling vacuum-cleaner (Vam-pirette, Siemens, Germany), and 10 sub-samples each were examined with 3 parallel plates (DG18) from the fil-tered 63-μm dust fraction. Rooms were defined as non-colonized if no moisture damage was visible and no plants or caged animals were present. In this room with low concentrations (average total colony count 17,900 cfu/g), the relative standard deviation for Aspergillus spp. was moderate (25%) with an average of 9 cfu/plate. Below 4 cfu/plate, the relative standard deviation markedly increased (between 60 and 100%), and was above 100% at < 1 cfu/plate (Table 2). In another non-colonized (non-mouldy) room with higher concentrations (average total count 280,000 cfu/g) and averages of 3-9 cfu/plate for all yielded genus, the relative standard deviations varied between 29 and 39%. At an average of 28 cfu/plate, the total count varied only by 13% (Table 3).
These results indicate that the higher the contamination of rooms is with mould fungi, the more reliable the detec-tion method becomes. For measurements of the back-ground concentration (Table 2), the method quickly reaches its detection limits because of low concentrations and very high standard deviations, which however, have no implication for measurements within the
concentra-tions limits. According to ISO/DIS 16000-17:2006 and Gabrio T et al. [2,3], the best results are achieved if more than 10 cfu per plate and less than 100 cfu per plate (90 mm diameter) are yielded. Generally, the best yield ranges within 20 to 40 cfu per plate, a range where the standard deviation of the results is at a minimum. Indeed, as shown in table 1, our results for optimal assessment of moulds in the environment range between 200,000 to 450,000 cfu per gram dust, corresponding to 20 to 45 cfu per plate in a dilution of 1:10,000, result in the lowest standard devi-ations. By counting species as indicator genera, the total count, together, the random error diminishes.
Old Dust
To investigate potential problems with old dust, dust sam-ples were vacuumed from the carpet (fresh dust, 2 weeks old) and from top of a closet (old dust, 1 year old) in a bedroom. The fresh dust showed no physical enrichment (Aspergillus spp. and Eurotium spp. = 23,000 cfu/g, Penicil-lium spp. = 33,000 cfu/g). In contrast, the indicator genera in the old dust exceeded concentration limits according to table 1 (measurement 500,000 and 700,000 cfu/g). The indicator genera Aspergillus spp. + Eurotium spp., and Peni-cillium spp. were each enriched by the factor of 21. There-fore, the sample of old dust would have to be classified as contaminated, and does not represent the true and actual condition of the environment.
Guideline VDI 4300 Part 8, 2001 [4] distinguishes between fresh (definite age, according to our method one week) and old dust (indefinite age). Generally, old dust contains much higher fungal concentrations, because it has been enriched longer and is usually much finer in par-ticle size. The smaller the parpar-ticle size of dust, the higher is the expected enrichment phenomenon. For instance, old dust results from airborne dust of particle size < 10 μm settles and accumulates on cupboards and closets or under beds without influence of dilution with other parti-cles. Therefore, our method allows sampling of accessible floors and surfaces.
[image:2.612.49.558.658.729.2]In a dry area the previously not attainable old dust under a cabinet together with fresh dust was absorbed and inves-tigated. The amount of total count indicated false positive dampness damage (totally count 521,700 cfu/g, 74% Pen-icillium spp.). After repeating the measurement using only
Table 1: House dust evaluation for mould in the 63-μm fraction, modified one-step assessment model
Corresponding total count without concentration limit, indicator genus
yeast (cfu/g) Aspergillus- + Eurotium spp (cfu/g) or proportion (%) Penicillium spp (cfu/g) or proportion (%)
0 - 500,000 ≥ 200,000 cfu/g ≥ 300,000 cfu/g
500,000 - 2,000,000 ≥ 20% ≥ 20%
fresh dust a correct result expectable for a definitive dry area was measured (total count 62,500 cfu/g, 16% sum of indicator genera) [5]. Therefore, inaccurate findings will result by sampling old dust and assessment of the values according to table 1.
Influence of sand and sieving
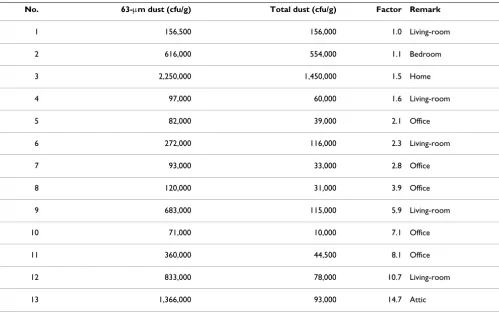
In order to investigate the influence of sieving, table 4 compares the total counts of mould spores per gram of dust from one sample each of vacuumed house dust in the sieved 63-μm fraction and in non-sieved total dust (culti-vation of each sample on three DG 18 agar plates, see [1]). Sieving to 63-μm lead to a greater than 10-fold enrich-ment due to the different quantity of inert sand in each total dust sample.
In case 1 (table 4), the total dust corresponded to the
63-μm dust (no sand in the house). This house was vacu-umed daily. The dust contained 88,500 cfu/g Aspergillus spp. + Penicillium spp., and without sieving would have been classified as a contaminated home, assessed after Schleibinger et al. [6]. According to our assessment, the sample was conclusively without mould, which in this case correlated with the inspected location. The indicator genera concentrations were 5 times below the cut-off value (table 1). Schleibinger et al. [6] found a specificity of 98%, which is comparable to our results, and a sensitiv-ity of 93%, without sieving in 47 non-contaminated and 43 contaminated homes, although the assessment was performed "only" according to indicator genera and the moisture damage was clearly visible. We achieved a sensi-Table 2: Standard deviations of 10 sub-samples (3 parallel examinations) of a house-dust sample with low load in the 63-μm fraction in cfu/g × 1,000 (DG18, 25°C).
Number 1 2 3 4 5 6 7 8 9 10 Mean % TCC SD SD%
Asp. 12 13 8 8 9 9 6 11 7 8 9.1 51 2.2 25
Peni. 6 3 3 2 5 1 2 5 1 7 3.5 20 2.1 61
Clad. 5 0 2 1 5 5 1 0 3 1 2.3 13 2.1 89
Wall. 2 0 0 1 0 2 1 0 0 0 0.6 3 0.8 141
Aureo. pu. 0 0 0 0 0 1 0 0 0 0 0.1 1 0.3 316
Muc. 0 0 1 0 0 0 0 0 0 0 0.1 1 0.3 316
Fusa. 0 0 0 0 0 0 1 0 0 0 0.1 1 0.3 316
Myc. st. 1 3 4 3 1 6 2 0 0 1 2.1 12 1.9 91
TCC 26 19 18 15 20 24 13 16 11 17 17.9 100 4.6 26
[image:3.612.55.554.109.330.2]SD- Standard deviation, SD% - relative percent standard deviation, % TCC- percent proportion of total colony count
Table 3: Standard deviations of 10 sub-samples (3 parallel examinations) of a house-dust sample in the 63-μm fraction in cfu/g × 10,000 (DG18, 25°C).
Number 1 2 3 4 5 6 7 8 9 10 Mean % TCC SD SD%
Aspergillus 12 7 8 8 7 10 15 11 8 6 9 34 3 29
Penicillium 5 4 5 2 4 3 3 7 4 4 4 15 2 35
Cladosporium 10 6 8 6 7 8 5 5 6 7 7 24 2 24
Alternaria 2 5 3 2 4 3 3 3 2 2 3 10 1 39
Other 5 4 3 4 3 4 4 3 5 9 5 16 2 36
TCC 35 26 28 21 25 28 29 30 25 28 28 100 4 13
[image:3.612.56.555.566.719.2]tivity of 100% for the house-dust method with DG18. It is likely that the comparatively poor sensitivity in contami-nated homes [6] is the result of a higher influence of con-tamination with sand, which leads to a dilution of the samples. Therefore, sieving the house dust to the 63-μm fraction is considered imperative for assessing moisture damage.
Sieving corresponds to geological preparation of soil sam-ples [7,8]. Through sieving, quantitatively comparable ref-erence values are obtained, i.e., in total dust samples, the influence of sand is responsible for results that differ by a factor of up to 10 (+ 900% error). However, even small differences of a factor of 2 or 3 result in errors of +100 to +200%. Such effects are also to be expected for chemical analysis, mycotoxins or quantitative polymerase chain reaction. However, sieving results the reference to expo-sure to be lost (see uptake via hand-to-mouth contact). Therefore, every task requires its own measurement strat-egy.
Soil
The influence of soil was seen in the analysis of house-dust samples from a location where shoes were changed in the entry hall of an inhabited garden cottage (total count 486,057 cfu/g, Aspergillus spp. and Eurotium spp. 327,384 cfu/g) and from a sample from a school
class-room (total count 516,666 Aspergillus spp. and Eurotium spp. 43%). Neither sample was taken from a living area. The classroom floor was not carpeted. In contrast, the influence of soil in homes was negligible [9].
Stability of samples
[image:4.612.55.554.99.411.2]The protocol for house-dust analyses stipulates that inoc-ulation and incubation of samples be performed in the laboratory at the latest the day after sampling. But in actual practice, the question must be asked whether interim storage of the dry house dust (e.g., during ship-ping) can result in errors. In a house-dust sample without moisture damage (sampling on 04.09.06; total count 623,000 cfu/g, Aspergillus spp. and Eurotium spp. 103,000 cfu/g, Penicillium spp. 16,700 cfu/g), the counts of the gen-era Aspergillus spp. and Eurotium spp., and Penicillium spp. remained constant over 3 weeks at room temperature (persistence of indicator genera). In contrast, the amount of Cladosporium spp. decreased by 72% (-30% total count per 2 weeks). Koch et al. [10] found a decreasing fre-quency of 10% for the total count over 2 weeks at a storage temperature of 4°C. Here, too, Cladosporium spp. was the limiting factor. Still lower storage temperatures should further reduce the rate of decrease [10]. It is apparent that through storage, the total assessment is only influenced by the total count, so that after 1 week of storage at 4°C, an erroneous assessment is not likely to result. Nevertheless, Table 4: Mould spore concentration (total counts) per g house dust of the 63-μm fraction vs. the total dust fraction
No. 63-μm dust (cfu/g) Total dust (cfu/g) Factor Remark
1 156,500 156,000 1.0 Living-room
2 616,000 554,000 1.1 Bedroom
3 2,250,000 1,450,000 1.5 Home
4 97,000 60,000 1.6 Living-room
5 82,000 39,000 2.1 Office
6 272,000 116,000 2.3 Living-room
7 93,000 33,000 2.8 Office
8 120,000 31,000 3.9 Office
9 683,000 115,000 5.9 Living-room
10 71,000 10,000 7.1 Office
11 360,000 44,500 8.1 Office
12 833,000 78,000 10.7 Living-room
interim storage times should be kept to a minimum, or a reduction in total count should be taken into considera-tion.
Indicator genera
The exclusive evaluation according to indicator genera inevitably leads to fewer false-positive findings than does an evaluation method with more species and genera. Euro-tium spp. is an additional indicator of moisture damage, which, compared to other moisture indicators, occurs fre-quently. However, it is problematic that the additional moisture assessment parameters - as opposed to the indi-cator genera - according to [9] often scored levels of zero. Thus, the 95th percentile of the other moisture indicators (except the sum of Mucorales and species of the indicator genera) lay at 10,000 cfu/g (usually rounded up, Stachy-botrys chartarum at 3,000 cfu/g, only one sample with
Stachybotrys). The indirect cultivation method yields statis-tically very uncertain values for plate colonization (total count) under 10 cfu/plate (< 10,000 cfu/g) and incidental findings below 4 cfu/plate [2,3].
This is confirmed by Schleibinger et al. [6], who found among 19 genera a significantly more frequent occurrence only of Aspergillus sp., Penicillium sp. and Eurotium sp. in dwellings with visible mould contamination (n = 43). As in our previous analysis, this result shows that a massive increase of other moisture indicators is only rarely observed in cases of moisture damage (see 1 case with
Wallemia spp. in [1]). Recently, it was shown that the indi-cator genera were associated with the extent of moisture damage in a house [11]. Typical hydrophilic fungi such as
Stachybotrys sp. are found only under very wet conditions. Growth of mould occurs much sooner at more arid condi-tions, as some xerophilic species can grow even at 70% water activity upwards. The absence of typical other mois-ture indicators (in this case, particularly the hydrophilic species) in background measurements in dry dwellings was also confirmed by Horner et al [12].
In summer, three cases out of all background measure-ments (n = 157) exceeded the additional moisture assess-ment parameters [9] for the three highest total counts measured (case 1: total cfu 4,100,000/g, 7 fungal moisture indicators; case 2: total cfu 5,100,000/g, 5 fungal moisture indicators; case 3: 9,400,000 cfu/g, 6 fungal moisture indi-cators). This supports the concept that species other than those of the indicator genera are carried indoors by the outdoor air, depending on the total count, e.g. seasonal influence during summer.
Mass or surface relation
The background measurements of the UFOPLAN study [9] were intended to answer the question of whether the reference standard of house-dust samples should be the mass of house dust [1,5,6,9,10] or the vacuumed area.
Measuring mould load with reference to an area (cfu/m2) would not have been expedient. In this case, the 3 exam-ined regions would not have provided comparable results (differences in the collected dust amounts per m2 by fac-tors of 2 to 4). The reason for the failure of the reference area are chiefly the non-reproducible suction conditions (different suction power of pumps, different suction power during sampling caused by the increasing filter resistance, variable frequency of aspiration-head strokes despite a set time interval).
Sampling with filter holder or with vacuum-cleaner
To collect dust, the Vampirette vacuum-cleaner (Siemens, Germany) [5] or a filter holder [9,13] with a polycar-bonate filter (diameter 5 cm) was used. All accessible areas [5] or 2 m2 of floor space [9,13] of a room were vac-uumed within 10 minutes. Dust samples were sieved at 63-μm using either a sieving machine [9,13] or manually [5]. Proof that the two practiced sampling and processing techniques (vacuum cleaner, hand sieve vs. filter holder, sieving machine) are equivalent in terms of the indicator genera, and that averaging 4 sampling areas of 0.5 m2 each is sufficient to obtain representative results, is provided by the confirmation of the concentration limits by Baudisch et al. [5] for the main criterion (1st condition or main cri-terion for moisture damage = exceeding the total count of 500,000 cfu/g) and the indicator genus Aspergillus spp. and
Eurotium spp. (20%) in the total-colony count range of 500,000 to 2,000,000 cfu/g (2nd condition = exceeding at least one secondary criterion for the indicator genera) pro-vided by the measurements with the filter holder in uncontaminated homes. Previously, a reference measure-ment with vacuum-cleaner and filter holder ([1] table 2, cases 9a und b) also yielded corroborating results.
When purchasing a new filter holder, a large aspiration head is recommended (∅ 10 mm, flow rate 42 l/min is better than ∅ 6 mm and flow rate 15 l/min), in order to collect sufficient quantities of house dust, especially in well-kept homes.
From a logical point of view, in rooms with moisture damage, "false negative" findings can occur when antifun-gal paint is used (one case with no visible mould coloni-zation, average indoor humidity 80%) or with under-floor heating in winter (one case with affected wall area of 600 cm2). "False positive" findings also were observed in cases of reverse airflow from germ-infested ventilator sys-tems [5].
Conclusion
devi-Publish with BioMed Central and every scientist can read your work free of charge "BioMed Central will be the most significant development for disseminating the results of biomedical researc h in our lifetime."
Sir Paul Nurse, Cancer Research UK
Your research papers will be:
available free of charge to the entire biomedical community
peer reviewed and published immediately upon acceptance
cited in PubMed and archived on PubMed Central
yours — you keep the copyright
Submit your manuscript here:
http://www.biomedcentral.com/info/publishing_adv.asp
BioMedcentral ation lies in a moderate range. Measuring mould load
with reference to an area (cfu/m2) would not have been expedient. Different methods of sampling with vacuum cleaner or the filter holder proved to be equivalent. A tem-porary storage of the samples before cultivation up to one week appears possible.
Competing interests
The authors declare that they have no competing interests.
Authors' contributions
CB and AK conceived the study. CB and AK designed and coordinated the study, CB, OA, and AK analyzed the data and wrote the first draft of the manuscript. OA finalized the manuscript. All authors helped to draft the manuscript and read and approved it in its final form.
Acknowledgements
The authors thank the Mycology Laboratory of the State Health and Social Office of Mecklenburg-Vorpommern, Dr. Heinz Sadek, Dr. Marcus von Stenglin, Dr. Christiane Backhaus-Pohl, Franka Arndt, Regina Schmidt and Christa Petzold for analyzing the house-dust samples to evaluate the meth-odology.
References
1. Baudisch C, Kramer A, Assadian O: Concentration of the genera
Aspergillus, Eurotium and Penicillium in 63-μm house-dust-fraction as a method to predict hidden moisture damage in homes. BMC Public Health 2009, 9:247.
2. VDI guideline: ISO/DIS 16000-17:2006 Indoor air - Part 17: Detection and enumeration of moulds - Culture-based method. In ICS: 13.040.20 Beuth-Verlag; 2006.
3. Gabrio T, Seidel HP, Szewzyk R, Trautmann C, Weidner U: Aus-sagekraft von Luft- und Hausstaubuntersuchungen im Zusammenhang mit Schimmelpilzproblemen im Innen-raum. Gefahrstoffe Reinhaltung der Luft 2005, 65:106-113.
4. Guideline VDI 4300 Part 8: Measurement of indoor air pollution - Sampling of house dust. Beuth, Berlin; 2001.
5. Baudisch C, Sadek H, v. Stenglin M: Erste Ergebnisse eines modi-fizierten Hausstaubmessverfahrens zur quantitativen und qualitativen Bewertung von Schimmelpilzen. Umweltmed For-sch Prax 2001, 6:265-74.
6. Schleibinger H, Laußmann D, Eis D, Samwer H, Nickelmann A, Rüden H: Unterscheidung von Schimmel- und Nichtschimmelwoh-nungen anhand von Sporen aus Hausstaubproben - Ergeb-nisse einer Feldstudie im Großraum Berlin. Umweltmed Forsch Prax 2004, 9:363-76.
7. VDI guideline: DIN 66165-1:1987-04, Particle size analysis; sieve analysis; general principles. Beuth Verlag, Berlin; 1987. 8. VDI guideline: DIN 66165-2:1987-04, Particle size analysis;
sieve analysis; procedure. Beuth Verlag, Berlin; 1987.
9. Trautmann C, Gabrio T, Dill I, Weidner U: Hintergrundkonzen-trationen von Schimmelpilzen in Hausstaub. Erhebung von Schimmelpilzkonzentrationen in Wohnungen ohne bekan-nte Schimmelschäden in 3 Regionen Deutschlands. Bundesge-sundheitsbl. Gesundheitsforsch Gesundheitsschutz 2005, 48:29-35. 10. Koch A, Heilemann KJ, Bischof W: Storage stability of viable
mold spores and endotoxin in house dust samples. Proceedings of the Indoor Air 2002 Conference Monterey 2002, 1:1B1p1.
11. Lignell U, Meklin T, Rintala H, Hyvärinen A, Vepsäläinen A, Pekkanen J, Nevalainen A: Evaluation of quantitative PCR and culture methods for detection of house dust fungi and streptomyc-etes in relation to moisture damage of the house. Letters in Applied Microbiology 2008, 47:303-8.
12. Horner WE, Worthan AG, Morey PR: Air- and Dustborne Myco-flora in Houses Free of Water Damage and Fungal Growth. Appl Environ Microbiol 2004, 70:6394-6400.