1
Anodic Reactions and the Corrosion of Copper in Deep Eutectic Solvents
T.A, Green*, P. Valverde and S. Roy**
Department of Chemical and Process Engineering, University of Strathclyde, Glasgow, Scotland G1 1XJ, United Kingdom.
** Electrochemical Society Member
Corresponding author:
*Todd Green
Department of Chemical and Processing Engineering, University of Strathclyde, Glasgow, G1
1XJ, United Kingdom
Tel: +44 141 574 5488
e-mail: [email protected]
2
Abstract
An analysis of the anodic reaction occurring at soluble copper anodes during the
electrodeposition of copper from an ethaline-based deep eutectic solvent (DES) has been
performed. It was shown by UV-Vis spectroscopy and electrochemical measurements that the
dominant anodic species produced is the CuCl2
complex. In pure ethaline the current efficiency
of the anodic process is 100% and the dissolution valency is one. However, in the presence of
Cu(II) species the apparent dissolution valency measured gravimetrically was typically less than
unity, corresponding to an observed mass loss greater than that expected from Faraday’s law.
Moreover, the apparent dissolution valency showed a marked dependence on the electrode
rotation rate, Cu(II) concentration and the water content of the deep eutectic solvent. These
observations were consistent with a corrosion reaction occurring in parallel with anodic
dissolution. The most likely corrosion process is the comproportionation reaction: CuCl42- + Cu 2CuCl2
-. Voltammetric data indicate that the rate of this process is controlled by the mass
transport of the CuCl42- complex to the surface and can readily explain the observed dissolution
valency dependencies. Finally, it is noted that complex dissolution of Cu anodes in deep eutectic
3
Introduction
The use of eutectic-based ionic liquids (ILs) for the electrodeposition of metals and alloys has
received considerable attention since its initial introduction by Abbott and co-workers1 in 2003. These materials share some of the characteristics of conventional room temperature ionic liquids
(RTILs) but possess a number of potential advantages.2,3 For example, they can be formulated from relatively low-cost precursors, exhibit low volatility and toxicity, and show a good
tolerance to water contamination. They are therefore more likely to be deployed in practical
plating systems where such considerations are particularly important. These materials are usually
described as deep eutectic solvents (DES)4,5 and a common formulation compromises a mixture of two components: a hydrogen bond donor (HBD) and a hydrogen bond acceptor (HBA). When
mixed the HBA and HBD self-associate to form a new eutectic phase with a melting point much
lower than the original components. Typically the eutectic temperature is below 100 oC which makes DES suitable for many plating and surface finishing applications.5-7
A widely used DES is ‘ethaline’ which is formulated from ethylene glycol (HBD) and choline
chloride (HBA) in a 2:1 molar ratio.5,6 Ethaline has the highest conductivity and the lowest viscosity of all the various DES systems studied.6 Additionally, metal chloride salts and metal oxides have a high solubility in ethaline and can therefore be used to formulate practical plating
solutions. These ‘type-III’ DES systems have been used to deposit a wide range of metals
including Al, Zn, Fe, Ni, Sn, Cr, Al and Cu2-7. Studies8-14 of copper deposition have been particularly common as it is used extensively in the electronics and microelectronic industries
4
Cu deposition from conventional ILs and aqueous systems which can be used to benchmark
DES-based processes.
Despite their advantages, a number of limitations of using deep eutectic solvents for metal
electrodeposition have been identified. Firstly, the DES solutions are highly viscous and the
diffusivity of the electroactive species is correspondingly low. This imposes severe mass
transport constraints and deposition rates are low compared to aqueous systems. Operating at
high temperatures8,9 (> 50 oC) and the use of ultrasonic agitation9,10 have both been applied to improve mass transport rates, but only modest gains are possible with such approaches, and the
energy consumption will also be higher. The conductivity of RTIL and DES systems are also low
compared to conventional high-temperature ILs and aqueous systems.5,15 This increases the energy consumption and also means that the plating process will have poor throwing power.15
The use of water additions has also been proposed16 to alleviate these problems and the hygroscopic nature of the DES makes water uptake unavoidable unless special precautions are
taken. For copper deposition from an ethaline-based DES it was found that 15 wt% water content
resulted in a 2 - 3× improvement in conductivity and diffusivity with minimal influence on the
deposit characteristics.16 However, the use of water additions is not appropriate in all cases, especially for the deposition of reactive metals or for electronegative metals (e.g. Zn) where the
co-reduction of water to form H2 will reduce the current efficiency.
Another technical issue relating to the practical implementation of metal electrodeposition
5
insoluble anode (e.g. platinum, carbon or DSA) but there are a number of potential disadvantages
with this approach. Firstly, the use of insoluble anodes will require the regular addition of metal
salts to maintain a constant concentration of the depositing species. Secondly, the
electrochemical reactions at an insoluble anode will most likely involve the breakdown of the
DES itself leading to the formation of complex byproducts.2,3,6 For example, in a study by Haernes and coworkers17 employing DSA anodes in an ethaline-based DES it was found that a wide range of organic anode products were formed. More importantly, many of these were
chlorinated compounds which severely compromise the ‘green’ environmental credentials of
DES systems. The use of sacrificial materials (e.g. water additions) was also found to minimise
the generation of chlorinated products but also interfered with the deposition process.17 Similarly, the use of a divided cell16,17 avoids some of these issues but such an approach increases energy consumption and is not really suitable for a scaled-up process. Other groups
have also observed the generation of Cl2 gas from ethaline DES when carbon18 or platinum
anodes19 were used, which further underlines the issues associated with insoluble anodes. Another approach is to use a non-chloride based DES system but, while choline chloride can be
obtained commercially at low cost, other choline salts (e.g. acetate, citrate, nitrate) have a much
higher costs or have to be synthesised.2 Moreover, the DES formulated from these anions are typically much more viscous and have higher conductivities than for choline chloride.8 This results in lower plating rates and poorer throwing power and for this reason chloride-based DES
systems are still favoured despite their potential environmental issues.
The preferred option is to use a soluble anode as, under ideal conditions, this should maintain a
6
DES.2,3,17 Another advantage of soluble anodes is the relatively small anodic overpotential needed to drive the dissolution reaction, and this will reduce the overall energy consumption.2,3 In practice, however, it is possible the anodic reaction may produce species in a different valency
state from the depositing species and the current efficiency may also differ from the cathodic
reaction.20 Under these conditions a soluble anode loses most of its effectiveness. Another potential issue is passivation of the anode, which may also cause changes in current efficiency or
dissolution valency.20 Although most metals-oxides are soluble in deep eutectic solvents6 there is a possibility of forming passive salt-films in chloride-containing DES. Finally, the presence of
water in the DES may influence the dissolution of the soluble anode by promoting passivation.
Despite such concerns, studies of the anodic behaviour of metals in deep eutectic solvents are
relatively rare, but a recent paper by Ryder and co-workers21 has examined the dissolution of several metals in pure ethaline and an imidazolium RTIL. For stationary copper electrodes at low
applied potentials, active dissolution of copper was observed and it was suggested that this arose
from the formation of CuCl2- species. At higher potentials, the anodic current passed through
maximum before assuming a limiting current plateau. This active-passive transition was
attributed to the formation of an insoluble CuCl salt film. In the presence of electrode rotation
limiting current behaviour was not observed, presumably due to the rapid removal of the Cu(I)
species from the surface. However, the study did not provide any information regarding the
dissolution valency, anodic current efficiency or passivation characteristics that are necessary to
7
There appears to be no other published studies on the anodic behaviour of metals and alloys in
DES systems, but a recent study by Forrest22 used combined voltammetric and EQCM measurements to investigate deposition and dissolution from a DES containing of Cu(I) and
Cu(II) chloro-complexes. Interestingly, for the anodic dissolution of copper in the Cu(II) solution
they observed a mass loss that was much higher than anticipated based on the amount of charge
passed for a single electron transfer. This amounted to an effective anodic current efficiency
greater than 100%. This effect was attributed to a non-electrochemical process, namely the
detachment of poorly adherent, unoxidised copper from the surface.22 Similar behaviour has been reported in the aqueous corrosion literature and is generally referred to as ‘anomalous
dissolution’.23,24
A number of recent reviews2,3,6 on the electrodeposition from ILs have stated that one of the key technical issues to be resolved before practical systems can be deployed is fully characterising
the anode reactions. However, despite their perceived importance to the development of practical
RTIL and DES based plating systems, there have been relatively few investigations of counter
electrode (anodic) reactions. Therefore, the major aim of the present study is to examine the
feasibility of using soluble copper anodes during the deposition of copper from an ethaline-based
DES and to investigate the phenomenon of unusually high anodic current efficiencies. The
influence of water adsorption on the performance of practical plating systems has also been
identified as an issue requiring further quantification.3 A secondary aim was therefore to examine the influence of added water on the anode reaction. While such water additions have minimal
influence on the deposit characteristics, and a beneficial effect on solution properties (e.g.
8
Experimental
‘Ethaline’ was prepared by mixing choline chloride (C5H14NOCl, Sigma-Aldrich, > 98%) and
ethylene glycol (C2H6O2, Sigma-Aldrich, > 99.8%) in a 1:2 molar ratio without any further
purification. The mixture was then heated and stirred at 60°C until a transparent melt was
formed. As required, CuCl (Sigma-Aldrich, > 97%) or CuCl2.2H2O (Sigma-Aldrich, > 99%)
were added to the ethaline to formulate plating solutions and reference standards. The ethaline
melt had an initial water content of 0.3 wt% but after adding 0.2 M CuCl2.2H2O this increased to
0.9wt% due to the hydration of the metal salt. The water content of the DES was measured using
a Hybrid Karl-Fischer Titrator (MKH-700, Kem Kyoto Electronics). For some experiments, the
concentration of water in the ethaline was adjusted by adding known amounts of DI water, and
this was also verified by K-F titration. Spectra of the copper-containing ethaline solutions were
recorded using a Varian Cary 5000 UV-VIS-NIR spectrometer over the wavelength range 200 –
800 nm. Depending on the copper concentration, a 1 cm or 0.0125 cm path length quartz cuvette
were used. All reported spectra are corrected against pure ethaline blanks.
For the anodic dissolution experiments, copper disk samples (Alfa-Aesar, 99.999% purity) were
employed as the working electrode. These were polished using 1200 and 2400 grade SiC paper,
rinsed in DI water and then dried with N2. They were then mounted in a PEEK sample holder
(Origalys) and the area exposed to the solution was 1.2 cm2. For the voltammetric measurements a 2 mm diameter platinum disk (0.031 cm2) embedded in PTFE insulator was used as the working electrode. Before use, the Pt electrode was polished with 4000 grade SiC paper, rinsed
with DI water and dried. Both the Pt and Cu samples could be rotated using an EDI101 electrode
9
weighed ( 0.1 mg) before and after the dissolution experiments in order to determine the
dissolution valency and current efficiency.
All experiments were performed in a jacketed two-compartment electrochemical cell where the
anode and cathode compartments were separated by a low-porosity glass frit. The working and
reference electrodes were mounted in one compartment, while the other contained the counter
electrode. In this manner, reaction products formed at the counter electrode could not interfere
with the reactions occurring at the working electrode. The volume of solution in each
compartment was typically 750 ml. A thermostatic bath was used to pump water through the
jacket so the cell could be maintained at a temperature of 25 oC. Both cell compartments were sealed from the atmosphere, but no other precautions were taken to exclude water uptake.
Polarisation and anodic dissolution experiments were performed using a potentiostat
(PGSTAT101, Metrohm Autolab) in a conventional three-electrode configuration. One cell
compartment contained the platinum or copper RDE electrode and a silver wire quasi-reference
electrode. To minimise ohmic drop, the Ag reference electrode was placed in a Luggin probe
which was positioned within 0.2 – 0.3 cm of the RDE surface. It was noticed in preliminary
experiments that the copper-containing ethaline solution could corrode the Ag wire reference
electrode and contaminate the solution. To minimise this effect, the Ag wire was subsequently
mounted in a fritted glass tube containing pure ethaline before being inserted in the Luggin
probe. The counter electrode for the polarisation experiments was a Pt wire; for the anodic
dissolution experiments a Cu wire was used. Polarisation experiments were performed
10
2 – 12 mA cm-2 and rotation rates of 0 to 2000 rpm. Experiments on solid copper electrodes indicated that active-passive transitions corresponding to the formation of a CuCl salt film
typically occurred at much higher current densities (> 40 mA cm-2) so that the present conditions corresponded to the active dissolution of copper.
Results
In order to understand the basic electrochemical characteristics of the CuCl2-ethaline system
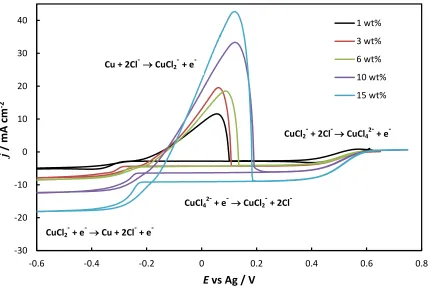
some preliminary voltammetric measurements were performed. Figure 1 shows the steady-state
voltammogram obtained for 0.20 M CuCl2 in ethaline at a platinum RDE ( = 700 rpm) and for
varying water content. In the cathodic scan, two distinct limiting current plateaus are visible
corresponding to the step-wise reduction of Cu(II) and Cu(I) chloro-complexes.7-18 This behaviour is similar to that observed for copper in aqueous chloride systems, and reflects the
ability of chloride ions to stabilise the Cu(I) oxidation state. For the anodic scan, there is a
stripping peak associated with the formation of Cu(I) complexes and a final plateau reflecting
oxidation back to the original Cu(II) species. Previous studies9,11,13 have shown that that the dominant species formed in the melt is the CuCl42- complex and the corresponding reactions are
likely to be:
CuCl42- + e- CuCl2- + 2Cl- [1]
CuCl2- + e- Cu + 2Cl- [2]
The current plateaux increased linearly with the square root of the rotation rate indicating that
11
addition of water increases the limiting current plateaux. This phenomenon was investigated in a
previous study and arises mainly from the decrease in viscosity of the DES as the water content
is increased. This reduction in viscosity results in an increased diffusivity of the CuCl42- and
CuCl2- species and therefore higher limiting currents.
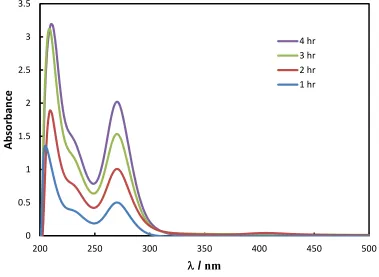
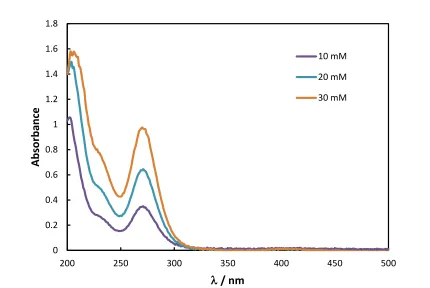
Figure 2 shows the UV-Vis spectrum of an ethaline solution after galvanostatic dissolution of a
copper anode for varying time periods. For comparison purposes, the UV-Vis spectrum of CuCl
and CuCl2.2H2O salts dissolved in ethaline is shown in Figure 3 and 4. The absorption peaks
observed reflect the formation of various Cu(I) and Cu(II) chloro-complexes.9,11,13,25,26 In the case of CuCl in ethaline, a single peak at 270 nm is observed which, according to the
literature9,13,26, corresponds to the species CuCl2
or CuCl32-. For CuCl2.2H2O in ethaline there
are peaks at 239, 291 nm and 405 nm. These peaks are generally attributed to the formation of
the CuCl42- complex. 9,11,13,25,26 A comparison of Figure 2 and Figure 3 indicates that the product
of the anodic dissolution is most likely the CuCl2
species corresponding to the single electron
reaction: Cu + 2Cl- CuCl2 -
+ e-. The potential of the copper electrode during anodic dissolution was also monitored and was typically in the range of 0.0 – +0.1 V versus the Ag wire
quasi-reference electrode. A comparison with Figure 1 indicates that this potential is sufficient to
allow the formation of CuCl2
but not CuCl42-.
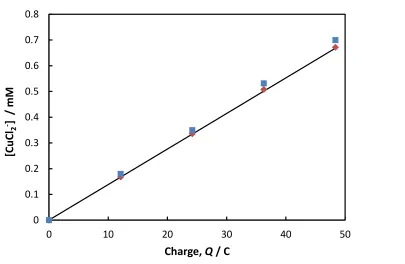
Figure 2 also indicates that the absorbance peak at 270 nm increases linearly with dissolution
time (charge). This relationship is presented more quantitatively in Figure 5 which shows the
concentration of the Cu(I) complex determined by various means as a function of the anodic
charge. The solid line corresponds to the concentration of Cu(I) species based on a consideration
12
the expected concentration of the Cu(I) complex based on the measured weight loss of the anode,
while the square symbols represent the concentration based on the measured absorbance (Figure
2) and using the measured value of = 3600 M-1 cm-1 for the 270 nm band. Collectively, the results in Figures 2 - 5 indicate that the only product from the dissolution of copper in pure
ethaline is CuCl2
-. In Figures 2 and 3 there is a very weak band at 405 nm indicating the possible
presence of trace amounts of CuCl42- but it is likely that this has formed via disproportionation or
oxidation of the CuCl2
complex.9 Note that these anodic dissolution experiments could not be performed in concentrated CuCl2 containing solutions due to the presence of strong, overlapping
adsorption bands.
A simple and convenient way of measuring the characteristics of the anodic dissolution process
is to use Faraday’s law to relate the mass loss, m, associated with the passage of a known
amount of charge.27 If the dissolution valency, n, is known the current efficiency, , of the process can then be assessed. Values of = 100% are common in metal dissolution but can be
lower due to the occurrence of a competing anodic reaction (e.g. O2 evolution). In rare cases,
values of > 100% have been measured indicating a mass loss greater than that expected from
Faraday’s law.23,24
In the electrochemical polishing, machining and corrosion literature23,24,27 it is common to report data in terms of the ‘apparent’ dissolution valency, n’. Clearly, only in the
case of = 100% does n’ = n and a current efficiency exceeding 100% can also be interpreted in
terms of an apparent dissolution valency of n’ < n.
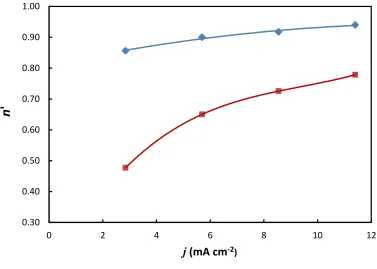
Figure 6 shows the apparent dissolution valency of copper electrode determined gravimetrically
as a function of the applied current density. These experiments were performed in a solution
13
Interestingly, the apparent dissolution valency is n’ < 1 even though earlier experiments (Figure
5) in pure ethaline suggested that the anodic dissolution process is Cu + 2Cl- CuCl2- + e- with n’ = n = 1. The apparent dissolution valency was smallest at low applied current densities and
when the electrode was rotated. Only for relatively high applied current densities (> 10 mA cm-2) at stationary electrodes did the apparent dissolution valency approach the expected value of
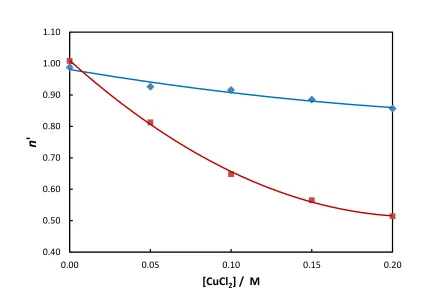
unity. In order to explore this phenomenon in more detail, additional experiments were
performed where the current density was fixed at 2.85 mA cm-2 and the CuCl2 concentration was
varied from 0 to 0.20 M (Figure 7). As before, the experiments were performed with the
electrode either stationary or rotating at 700 rpm. In pure ethaline, a dissolution valency of unity
was determined gravimetrically, which agrees with the results shown in Figure 5. Recently, a
value of n = 0.97 was reported28 for the dissolution of copper in pure ethaline which is also in good agreement with our findings. However, as the CuCl2 concentration was increased the
apparent dissolution valency decreased significantly, and this was observed for both stationary
and rotating electrodes. As before, the apparent dissolution valency was always higher for
stationary electrodes than for rotating ones, indicating the importance of mass transport effects.
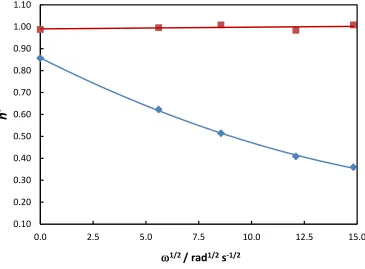
The final experiments undertaken involved examining the effect of electrode rotation on the
apparent dissolution valency (Figure 8). These were performed at a current density of 2.85 mA
cm-2 in pure ethaline or in an ethaline solution containing 0.20 M CuCl2. The apparent valency is
plotted as a function of 1/2 in order to examine the possible importance of mass transport effects. Figure 8 indicates that the dissolution valency in pure ethaline is always unity and shows
no dependence on the rotation rate. In contrast, in the presence of 0.2 M CuCl2 a steady reduction
14
findings and again indicates the importance of mass transport effects in determining the
dissolution behaviour.
Collectively, the results in Figures 6 – 8 show an apparent dissolution valency less than unity (or,
equivalently, > 100%) which is indicative of a mass loss greater than that expected from
Faraday’s law. If dissolution was occurring by the formation of both Cu(I) and Cu(II) complexes
then a value of 1 < n’ < 2 might be expected. Similarly, if a side reaction was occurring in
parallel with anodic dissolution so that < 100%, a value of n’ > 1 might be anticipated.
However, an apparent dissolution valency of less than unity must be indicative of a more
complex process involving either a corrosion reaction occurring in parallel, or some other
non-electrochemical process. As noted in the Introduction, this phenomenon has been observed22 in DES systems but the exact cause has not been established.
Discussion
In attempting to explain the observed results, it is instructive to review some of the previous
reports of ‘anomalous dissolution’. Many of these have appeared in the corrosion literature,
where large discrepancies between the measured mass loss and the corrosion rate have
occasionally been encountered. The literature related to this effect been extensively
reviewed.23,24 One possible explanation for this effect is electrode disintegration (‘chunk’ effect) where pieces of the metal are detached from the electrode in an essentially non-electrochemical
process. In this scenario, the mass loss is greater than expected from the actual anodic charge.
For example, intergranular corrosion might allow for the detachment of individual grains where
15
at their base by localised corrosion reactions leading to the dislodgement of large metallic
particles.22 Such metallic residues have been reported23 in some corroding systems, but in many instances dissolution occurs without their presence.
An alternative explanation is that a corrosion reaction is occurring in parallel with anodic
dissolution.27 Because this is an internal current process, it produces additional metal loss independent of the externally measured anodic charge. While this mechanism is plausible, it has
rarely been considered in studies of ‘anomalous dissolution’. Most reported examples29-31 have been observed during high rate (i.e. transpassive) dissolution of metals such as Fe and Ni in
aqueous electrolytes. In some cases current efficiencies of > 100% were observed indicating a
mass loss higher than expected based on the charge passed. It was subsequently proposed that
this was due to the occurrence of a chemical (corrosion) reaction on the anode surface. For
example, the following corrosion reaction was proposed to occur during the anodic dissolution of
iron in chlorate solutions:
2Fe + ClO3
+ 6H+ 2Fe3+ + Cl- + 3H2O [3]
The rate of this reaction was quantified by the accumulation of Cl- ions in the electrolyte, and a subsequent mass balance calculation indicated that it could readily account for the apparent
current efficiency of > 100%.29 Additionally, no metallic debris was observed that might have arisen from electrode disintegration.30
Now that a possible explanation for the observed dissolution behaviour has been identified, it is
necessary to examine which corrosion reactions might plausibly occur at the anode. The
16
conditions (RDE at = 1000 rpm) has been determined to be jcorr = 0.02 mA cm-2 at 25 oC.28 This is more than two orders of magnitude lower than the corrosion rates measured in the present
study, which indicates that copper corrosion by dissolved O2 is not responsible for our
observations. However, in the presence of Cu2+, the corrosion rate is significantly higher and can arise from the comproportionation reaction:
CuCl42- + Cu 2CuCl2
[4]
The thermodynamic feasibility of this reaction can be established from an analysis of the
standard (formal) electrode potentials, E0, for reactions [1] and [2]. The measurement of standard potentials in ethaline-based DES are complicated by electrode irreversibilities, but
values of E0 (Cu2+/Cu) = +0.58 V and E0 (Cu+/Cu) = -0.22 V have been estimated.5,9 These values can be used to calculate a Gibbs free energy of G0 = –77 kJ mol-1 for reaction [4], indicating that comproportionation is spontaneous under standard conditions.
The plausibility of this mechanism can be verified by examining Figure 9 which indicates that
under open circuit conditions the anodic dissolution processes to form CuCl2
can couple with the
cathodic process involving the reduction CuCl42-. The resulting position of the mixed potential, Ecorr,and the associated corrosioncurrent, icorr, are also shown in Figure 9. Most importantly, the
cathodic reaction is under mass transport control so that the corrosion rate will be controlled
purely by the cathodic limiting current (i.e. jcorr = jlim). This can be shown more clearly as an
Evans diagram (Figure 10) which displays schematically the anodic and cathodic partial current
17
In a previous study32 it was demonstrated that this comproportionation reaction occurs in the off-time during the pulse plating of copper from a CuCl2-ethaline electrolyte. This effect is
responsible for the low cathodic current efficiency observed under pulse conditions, and a similar
effect has been reported in an aqueous chloride system.33 Comproportionation reactions involving copper have been encountered in others ILs34, and it is often used to prepare soluble Cu(I) complexes by reacting Cu(II) complexes with Cu.35 In aqueous systems the importance of this reaction is well known, and CuCl2 solutions are routinely used to etch copper for printed
circuit board fabrication.36
If it is assumed that comproportionation is the dominant corrosion reaction, and that it is under
mass-transport control, an expression relating the apparent dissolution valency to the magnitude
of jcorr can be derived. The proposed mechanism is shown schematically in Figure 11. This
indicates that, during the anodic dissolution of copper, the electrons generated can flow through
the external circuit or be consumed by the reduction of CuCl42- at the electrode surface. It then
follows that:
japp + jcorr = ja [5]
where japp is the applied current density, ia is the anodic dissolution current density and jcorr is the
corrosion current density. This relationship is also shown schematically on the Evans diagram
(Figure 10). By applying Faraday’s law to the anodic current density we obtain:
[6]
where n’ is the apparent valency, F is the Faraday constant, m is the observed mass loss, M is
18
equation [6] into [5] and rearranging, the following expression for the apparent dissolution
valency is obtained:
( )
[7]
Clearly, in the case where corrosion is significant equation [7] predicts that n’ < n, and only
when jcorr = 0 is a dissolution valency of n’ = n obtained. Moreover, with the condition of
cathodic mass transport control we can write:
[8]
where nc is the number of electrons transferred in the cathodic process, is the diffusion layer
thickness, and D and c are the diffusion coefficient and bulk concentration of the CuCl42- species,
respectively. This suggests that if jlim is raised by increasing c or D (or by reducing ) then jcorr is
also increased and this results in a lower apparent dissolution valency.
Equation [7] can then be used to extract jcorr from the apparent dissolution valency data. Figure
12, for example, shows the jcorr data extracted in this manner and plotted against 1/2. The linear behaviour strongly suggests that the jcorr is under mass transport control – as is expected from the
model. This Levich-like behaviour is observed at all water contents. Similarly, jcorr can be
extracted from the data and plotted against the Cu(II) concentration (Figure 13). Once again,
these plots are highly linear at all electrode rotation rates and this is as expected based on the
relationship between jcorr and jlim and c.
A final test of the proposed corrosion model is to directly compare the measured limiting
19
identical conditions ( = 700 rpm, 0.2 M CuCl2 and 1 – 15 wt% water). As noted earlier, water
increases the diffusivity of the CuCl42- species and this result in an increase in the limiting
current (Figure 1). Consequently, water additions should increase the corrosion rate and reduce
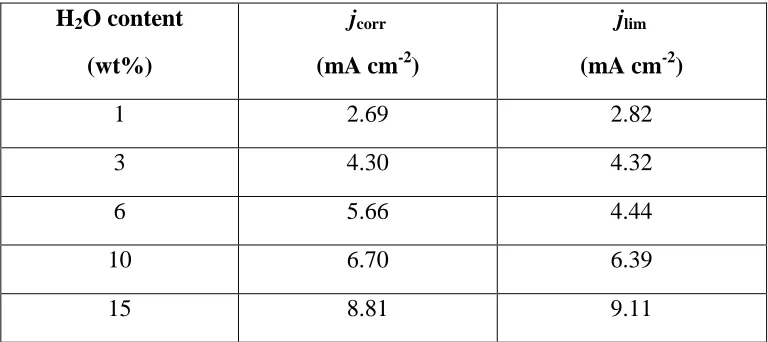
the apparent dissolution valency. In Table 1 the jcorr obtained from the dissolution valency data is
compared with the jlim data from Figure 1. There is good agreement (typically within 5%)
indicating that the model explains the data well. The effect of water on the rate of
comproportionation in the CuCl2-ethaline system was recently explored by Zhou and
co-workers.26 They also found that the rate increased with water content and attributed this to the enhanced mass transfer of the Cu(II) species.
In summary, the proposed model explains quantitatively the dissolution of copper in an ethaline
DES. In particular, the observed dependency of the apparent dissolution valency on the electrode
rotation rate, CuCl42- concentration, and the water content can all be rationalised by the existence
of a comproportionation reaction that is under mass-transport control. Both the model and
experimental data indicate that the expected valency (n = 1) can only be attained when the rate of
corrosion is negligible compared to the applied dissolution current. Corrosion by
comproportionation can be minimised by using a low concentration of Cu(II) species, a low
water content and minimal agitation but will always be present to some extent. In order to
explain the results it was not necessary to invoke an anode disintegration type mechanism. If this
were the dominant process it is unlikely that the mass loss would exhibit such a strong linear
dependence on 1/2 or concentration.
It should be noted that the corrosion effects observed for the CuCl2-ethaline system are possible
20
iron films using inert anodes37, but if soluble iron or steel anodes are used they will invariably corrode by the comproportionation reaction: 2FeCl4- + Fe + 4Cl- 3FeCl42-.38 This effect is also
seen during the discharge of all-iron redox-batteries employing aqueous39 or DES40 electrolytes where Fe(III) species in the cathode compartment can crossover through the membrane and etch
the iron anode. Type-II eutectics containing CrCl3.6H2O in choline chloride have also shown
susceptibility to anode corrosion. In a recent technical report41 it was noted that that the anodic current efficiency often exceeded 100%. This was explained by assuming that dissolution can
occur via a Cr(II) complex rather than the expected Cr(III) species. However, this suggestion
cannot explain the apparent current efficiencies in excess of 150% that were observed at low
applied current densities. A more likely explanation is that the soluble chromium anode reacts
with Cr(III) complexes via a comproportionation reaction producing Cr(II) species. Other
reports42 of chromium deposition from type-II eutectics have also indicated substantial corrosion of the Cr anode in the absence of any applied current. More recently, comproportionation
reactions effects involving the anode and cathode have also been encountered during niobium
deposition from various ILs.43
Finally, it should be noted that the occurrence of comproportionation reaction poses some issues
for the use of soluble anodes in many DES and IL systems. For example, corrosion by
comproportionation will significantly influence the current efficiency of the anode reaction. The
corrosion rate will depend strongly on experimental conditions (e.g. concentration of species,
agitation and applied current density) and therefore the overall dissolution rate may not be easily
predictable or stable. More importantly, the comproportionation reaction will introduce species
into the plating solution in a different (i.e. lower) oxidation state (for example as Cr(II), Cu(I) or
21
cathode. These lower-valency species may undergo further reactions in solution (e.g.
disproportionation) or at the cathode.43 In the latter case the current efficiency for deposition will also be altered. Under such conditions the use of soluble anodes is questionable and is likely to
complicate rather than simplify control of the bath chemistry.
Conclusion
This study has examined the nature of the dissolution reaction occurring at soluble copper anodes
during the electrodeposition of copper from an ethaline-based DES. For dissolution in pure
ethaline, UV-Vis spectroscopy and electrochemical measurements indicated that the dominant
anodic species produced was CuCl2
-. The current efficiency of the anodic process determined
gravimetrically was 100% and the dissolution valency was one. However, in the presence of
Cu(II) complexes the apparent dissolution valency was typically less than unity, corresponding
to an observed mass loss greater than that expected from Faraday’s law. The apparent dissolution
valency showed a marked dependence on the electrode rotation rate, Cu(II) concentration and
water content, indicating the likely importance of mass transport limitations. Collectively, these
observations suggested that a corrosion process was occurring in parallel with normal anodic
dissolution.
A model that allows for the influence of a corrosion reaction on the apparent dissolution valency
was then developed. This model assumes that the corrosion process involves the
comproportionation reaction: CuCl42- + Cu 2CuCl2-. This process is thermodynamically
22
copper. In addition, voltammetric experiments indicated that the reaction rate would be
controlled by the mass transfer of the Cu(II) species to the surface. This model was able to
quantitatively account for the effect of all major variables on the apparent dissolution valency
including Cu(II) concentration, hydrodynamic conditions and water content. The occurrence of
such comproportionation reactions is possible in other ILs and DESs and a number of susceptible
systems have been identified. Finally, some of the practical issues associated with the occurrence
of such corrosion reactions have been discussed. In general, these will negate many of the
23
Acknowledgements
P. Valverde would like to acknowledge the Secretariat of Higher Education, Science,
24
References
1. A.P. Abbott, G. Capper, D.L. Davies, R. Rasheed and V. Tambyrajah, Chem. Commun., 70
(2003).
2. F. Endres, D. MacFarlane and A. Abbott, Electrodeposition from Ionic Liquids, 2nd edition, Wiley-VCH, Weinheim (2017).
3. A.P. Abbott, G. Frisch and K.S. Ryder, Annu. Rev. Mater. Res., 43, 335 (2013).
4. L.I.N. Tome, V. Baiao, W. da Silva and C.M.A. Brett, Appl. Mater. Today, 10, 30 (2018).
5. E.L. Smith, A.P. Abbott and K.S. Ryder, Chem. Rev., 114, 11060 (2014).
6. A.P. Abbott and K.J. McKenzie, Phys. Chem. Chem. Phys., 8, 4265 (2006).
7. A.P. Abbott, K.S. Ryder and U. Konig, Trans. IMF, 86, 196 (2008).
8. R. Bernasconi, M. Zebarjadi and L. Magagnin, J. Electroanal. Chem. 758, 163 (2015).
9. A. Mandroyan, M. Mourad-Mahmoud, M-L. Doche and J-Y. Hihn, Ultrason. Sonochem., 21,
2010 (2014).
10. B.G. Pollet, J-Y. Hihn and T.J. Mason, Electrochim. Acta., 53, 4248 (2008).
11. A.P. Abbott, K. El Ttaib, G. Frisch, K.J. McKenzie and K.S. Ryder, Phys. Chem. Chem.
Phys., 11, 4269 (2009).
12. T. Tsuda, L.E. Boyd, S. Kuwabata and C.L. Hussey, J. Electrochem. Soc., 157, F96 (2010).
13. D. Lloyd, T. Vainikka, L. Murtomaki, K. Kontturi and E. Ahlberg, Electrochim. Acta., 56,
4942 (2011).
14. S. Ghosh and S. Roy,Surf. Coat. Technol., 238, 165 (2014).
15. C.L. Hussey, ECS Trans., 64, 3 (2014).
25
17. K. Haerens, E. Matthijs, K. Binnemans and B. Van der Bruggen, Green Chem., 11, 1357
(2009).
18. J. Ru, Y. Hua, D. Wang, C. Xu, J. Li, Y. Li, Z. Zhou and K. Gong, Electrochim. Acta., 186,
455 (2015).
19. D. Yue, Y. Jia, Y. Yao, J. Sun and Y. Jing, Electrochim. Acta., 65, 30 (2012).
20. Y.D. Gamburg and G. Zangari, Theory and Practice of Metal Electrodeposition, Springer,
New York (2011).
21. A.P. Abbott, G. Frisch, J. Hartley, W.O. Karim and K.S. Ryder, Progress in Natural
Science: Materials International, 25, 595 (2015).
22. G.C.H. Forrest, Electrochemistry and Galvanic Deposition of Group 10 & 11 Transition
Metals Using Deep Eutectic Solvents, PhD Thesis, University of Leicester, 2014.
23. D.M. Drazic and J.P. Popic, J. Serb. Chem. Soc., 70, 489 (2005).
24. W.E. James, in Advances in Corrosion Science and Technology, Vol. 4, M. G. Fontana and
R. W. Staehle, Editors, Plenum Press, New York (1974).
25. P. De Vreese, N.R. Brooks, K. Van Hecke, L. Van Meervelt, E. Matthijs, K. Binnemans and
R. Van Deun, Inorg. Chem., 51, 4972 (2012).
26. Y. Su, J. Liu, R. Wang, S. Aisa, X. Cao, S. Li, B. Wang and Q. Zhou, J. Electrochem. Soc.,
165, H78 (2018).
27. M. Datta, IBM. J. Res. Develop., 37, 207 (1993).
28. M-L. Doche, A. Mandroyan, M. Mourad-Mahmoud, V. Moutarlier and J-Y. Hihn, Chemical
Engineering & Processing: Process Intensification, 121, 90(2017).
29. M. Datta and D. Landolt, Electrochim Acta., 25, 1263 (1980).
26
31. K-W. Chen and D-T. Chin, J. Electrochem. Soc., 121, 191 (1974).
32. T.A Green, X. Su and S. Roy, ECS Trans., 77, 1247 (2017).
33. C.W. Yeow and D.B. Hibbert, J. Electrochem. Soc., 130, 786 (1983).
34. S. Vanderaspoilden, J. Christophe, Th. Doneux and C. Buess-Herman, Electrochim. Acta.,
162, 156 (2015).
35. K. Murase, K. Nitta, T. Hirato and Y. Awakura, J. Appl. Electrochem., 31, 1089 (2001).
36. M. Georgiadou and R. Alkire, J. Electrochem. Soc., 140, 1340 (1993).
37. R. Bock and S.-E. Wulf, Trans. IMF, 87, 28 (2009).
38. D. Lloyd, T. Vainikka, M. Ronkainen and K. Kontturi, Electrochim. Acta., 109, 843 (2013).
39. L.W. Hruska and R.F. Savinell, J. Electrochem. Soc., 128, 18 (1981).
40. M.A. Miller, J.S. Wainright and R.F. Savinell , J. Electrochem. Soc., 164, A796 (2017).
41. J. Fischer, E. Nagel and M. Mann, ‘Investigations concerning chromium plating from
electrolytes containing chromium-III chloride and ionic liquid’, Report No. 120808 JKF,
University of North Dakota (2012).
42. P. Verpoort and E.D. Gonzalez, Joint Workshop on Ionic Liquids at Interfaces, 3 - 5th October 2015, Belek, Turkey.
27
H2O content
(wt%)
jcorr
(mA cm-2)
jlim
(mA cm-2)
1 2.69 2.82
3 4.30 4.32
6 5.66 4.44
10 6.70 6.39
[image:27.612.107.491.287.458.2]15 8.81 9.11
Table 1: Comparison of jcorr extracted from the dissolution valency data and jlim measured for the
reduction of CuCl42- species at various water contents. The electrode rotation rate was 700 rpm
28
Figure 1: Steady-state voltammogram of a solution of 0.20 M CuCl2 in ethaline with different
water content (1 – 15 wt% H2O). The electrode rotation rate was = 700 rpm. -30 -20 -10 0 10 20 30 40
-0.6 -0.4 -0.2 0 0.2 0.4 0.6 0.8
j / m A cm -2
E vs Ag / V
1 wt%
3 wt%
6 wt%
10 wt%
15 wt%
CuCl42
+ e- CuCl2
+ 2Cl
-CuCl2- + e- Cu + 2Cl- + e
-Cu + 2Cl- CuCl2-+ e
[image:28.612.88.516.198.492.2]29
Figure 2: UV-Vis spectrum (1 cm cuvette) of the anode compartment solution after anodic
dissolution of Cu in pure ethaline. The current density was 2.5 mA cm-2 and the duration from 1 to 4 hours.
0 0.5 1 1.5 2 2.5 3 3.5
200 250 300 350 400 450 500
A
b
so
rb
an
ce
/ nm
[image:29.612.92.471.173.450.2]30
Figure 3: UV-Vis spectrum (0.0125 cm cuvette) at various concentrations (10, 20 and 30 mM)
of CuCl dissolved in pure ethaline.
0 0.2 0.4 0.6 0.8 1 1.2 1.4 1.6 1.8
200 250 300 350 400 450 500
A
b
so
rb
an
ce
/ nm
10 mM
20 mM
31
Figure 4: UV-Vis spectrum (0.0125 cm cuvette) of 50 mM CuCl2.2H2O dissolved in pure
ethaline.
0 0.5 1 1.5 2 2.5 3 3.5
200 250 300 350 400 450 500
A
b
so
rb
an
ce
[image:31.612.118.489.135.403.2]32
Figure 5: Plot of CuCl2
concentration versus anodic charge, Q in pure ethaline. (
) symbol showthe concentration inferred from the absorbance data at 270 nm in Figure 2. () symbol show the
concentration based on the mass loss of the anode. The solid line indicates the expected value
from Faraday’s law with n = 1.
0 0.1 0.2 0.3 0.4 0.5 0.6 0.7 0.8
0 10 20 30 40 50
[Cu
Cl2
-] /
m
M
33
Figure 6: The apparent dissolution valency, n’, of the copper electrode in 0.20 M CuCl2 in
ethaline containing 1 wt% H2O as a function of the applied current density and electrode rotation
rate. () = 0 rpm (
) = 700 rpm.0.30 0.40 0.50 0.60 0.70 0.80 0.90 1.00
0 2 4 6 8 10 12
n
'
[image:33.612.97.474.148.417.2]34
Figure 7: The apparent dissolution valency, n’, of the copper electrode at 2.85 mA cm-2 as a function of the Cu(II) concentration and electrode rotation rate in an ethaline solution containing
1 wt% H2O. () = 0 rpm (
) = 700 rpm. 0.400.50 0.60 0.70 0.80 0.90 1.00 1.10
0.00 0.05 0.10 0.15 0.20
n
'
[image:34.612.90.525.112.410.2]35
Figure 8: The apparent dissolution valency, n’, of the copper electrode at 2.85 mA cm-2 as a function of the electrode rotation rate, . () 0.20 M CuCl2 (
) 0.0 M CuCl2 (pure ethaline).0.10 0.20 0.30 0.40 0.50 0.60 0.70 0.80 0.90 1.00 1.10
0.0 2.5 5.0 7.5 10.0 12.5 15.0
n
'
[image:35.612.114.479.163.432.2]36
Figure 9: Polariation behaviour of 0.2 M CuCl2 in ethaline (15 wt% H2O) at 700 rpm showing
coupling of the anodic and cathodic processes under open-circuit conditions, and the resulting
Ecorr and jcorr. -30 -20 -10 0 10 20 30 40 50
-0.3 -0.1 0.1 0.3 0.5 0.7
j
/
m
A
cm
-2
E vs Ag / V
Ecorr
jcorr Cu + 2Cl- CuCl2
+ e
-CuCl42- + e- CuCl2
-+ 2Cl
[image:36.612.85.475.170.420.2]37
Figure 10: Schematic Evans diagram showing the partial anodic and cathodic reactions for the
comproportionation process. Initially the system is at Ecorr and the dissolution rate is given by jcorr.
If an anodic current density of japp is then applied the dissolution current density increases to ja
[image:37.612.89.518.167.495.2]38
Figure 11: Schematic of the overall dissolution processes showing contributions from normal
[image:38.612.113.492.246.459.2]39
Figure 12: Corrosion current density, jcorr, extracted from the dissolution valency data plotted as
a function of rotation rate and water content (1 – 15 wt% H2O).
0 4 8 12 16 20
0.0 2.5 5.0 7.5 10.0 12.5 15.0
jcorr
(m
A
cm
-2 )
1/2 (rad1/2 s-1/2)
40
Figure 13: Corrosion current density, jcorr, extracted from dissolution valency data as a function
of CuCl2 concentration and rotation rate in an ethaline solution containing 1 wt% H2O.
0 1 2 3 4 5 6
0.00 0.05 0.10 0.15 0.20
jcorr
(m
A
cm
-2 )
[CuCl2] / M 1400 rpm
700 rpm