A flexible, on-line magnetic spectrometer for
ultra-intense laser produced fast electron measurement
Xulei Gea,b,c, Xiaohui Yuanb,c,∗, Su Yangb,c, Yanqing Dengb,c,d, Wenqing Weib,c, Yuan Fangb,c, Jian Gaob,c, Feng Liub,c,∗∗, Min Chenb,c, Li Zhaoa,
Yanyun Mac,d, Zhengming Shengb,c,e, Jie Zhangb,c
aState Key Laboratory of Surface Physics and Department of Physics, Fudan University,
Shanghai 200433, China
bKey Laboratory for Laser Plasmas (Ministry of Education) and School of Physics and
Astronomy, Shanghai Jiao Tong University, Shanghai 200240, China
cCollaborative Innovation Center of IFSA (CICIFSA), Shanghai Jiao Tong University,
Shanghai 200240, China
dCollege of Science, National University of Defense Technology, Changsha 410073, China eSUPA, Department of Physics, University of Strathclyde, Glasgow G4 0NG, UK
Abstract
We have developed an on-line magnetic spectrometer to measure energy
dis-tributions of fast electrons generated from ultra-intense laser-solid interactions.
The spectrometer consists of a sheet of plastic scintillator, a bundle of
non-scintillating plastic fibers, and an sCMOS camera recording system. The design
advantages include on-line capturing ability, versatility of detection
arrangemen-t, and resistance to harsh in-chamber environment. The validity of the
instru-ment was tested experiinstru-mentally. This spectrometer can be applied to the
char-acterization of fast electron source for understanding fundamental laser-plasma
interaction physics and to the optimization of high-repetition-rate laser-driven
applications.
Keywords: electron spectrometer; on-line spectrometer; ultra-intense
laser-solid interaction
∗Corresponding author: Xiaohui Yuan ∗∗Corresponding author: Feng Liu
1. Introduction
The interaction of ultra-intense laser with overdense plasma produces
large-current relativistic (fast) electron beams. Knowing the electron energy
distri-bution and its dependence on laser and target parameters are important to the
understanding of fundamental laser-plasma physics, and to the optimization of
5
electron sources for applications, e.g., the fast ignition (FI)[1] approach to
in-ertial confinement fusion (ICF), laser-driven ion acceleration[2, 3] and bright
radiation sources development[4, 5].
The electron energy spectrum is normally measured with a dipole magnet
based electron spectrometer. The electrons are first dispersed according to the
10
different kinetic energies in the magnetic field and then recorded by the
detec-tor(s). Three major detection methods previously reported are image plates
(IPs), scintillating fibers and scintillator screen both imaged directly with
C-CD/sCOMS camera. The major drawback of IPs[6, 7] is the need to vent the
vacuum chamber to read the stored signals. Therefore IPs are not appropriate
15
for high-repetition-rate experiments. The scintillator fibers[8–11] are normally
placed parallel to the magnetic lines along the sides of both plates. The effects
of fringe field on electron deflection trajectory are inevitable[12]. In addition,
the effective fiber length which produces scintillating light is only a small
por-tion of the fiber. The longer redundant fibers beyond the magnetic field region
20
will produce background scintillating light when exposed to optical light or
par-ticles. To eliminate the undesired background, Chenet al[10] has put the CCD
camera inside the vacuum chamber to shorten the fiber length. However, the
CCD suffered from the strong electromagnetic pulses (EMP)[13] in the harsh
environment and may not work properly[14]. When scintillator screens[15–18]
25
were used, they were normally imaged directly with an optical lens coupled CCD
camera. Extensive shielding is an essential requirement to avoid scattered
op-tical light entering the imaging system. Due to the large aspect ratio of screen
(> 10) and considerable length along the dispersion direction (normally tens
of centimeters), effectively only a very small portion of CCD chip was used,
limiting the spatial resolution on the scintillator detector by the imaging
sys-tem to only several hundred microns[2]. Another important issue is that the
imaging system needs be realigned when changing the positions of the electron
spectrometer to measure electron spectra along other directions.
In this paper, we present a novel design of a flexible, on-line magnetic
spec-35
trometer, which utilizes the scintillator screen to produce scintillating light and
employs the non-scintillating fibers to guide light to high frame-rate sCMOS
camera imaging system. This instrument combines the advantages of the
on-line capability of scintillator, flexibility and versatile transforming configuration
of the fibers, and resistance to harsh environment by moving the recording
elec-40
tronics out of the vacuum chamber.
2. Spectrometer design
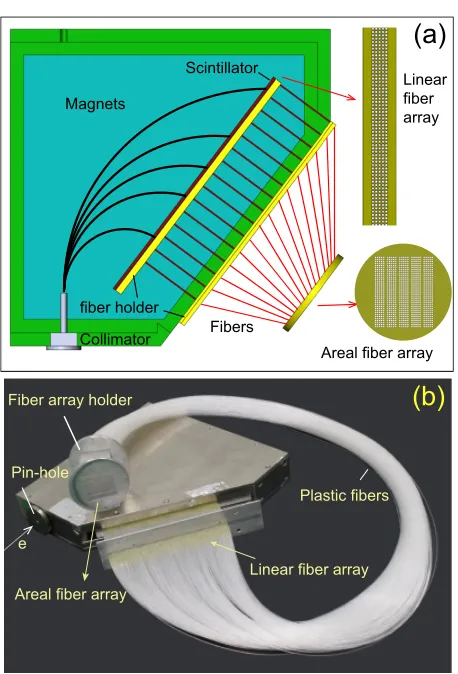
The schematic of the spectrometer is shown in Fig. 1(a) (the imaging
sys-tem is not presented). A pair of parallel NdFeB permanent magnets, shown
in light blue, deflects the electrons according to their different kinetic energies
45
(representative lines in black). A thin sheet of plastic scintillator (in dark red)
is inserted inside the magnetic spectrometer to convert the electron signal into
visible optical light. The scintillator screen can facilitate an on-line detection
capability since the emitted light from the scintillator can be captured by the
imaging system without disturbing the detector. This would attract more
in-50
terests especially in high-repetition-rate single-shot evaluations for statistical
analysis.
A bundle of fibers, arranged in multiple rows of linear arrays, are placed with
one end in close contact with the scintillator sheet. The light signals from the
scintillator are then relayed by the fibers to the imaging system placed outside
55
the vacuum chamber[19]. A high frame-rate sCMOS camera located outside
the vacuum chamber is used to record the optical light transmitted through a
glass window. Considering the aspect ratio of sCMOS chip size, the other end
(a) illustrate the linear and areal interfaces of the fiber bundle, respectively. A
60
photo of the assembly is shown in Fig. 1 (b).
Trapezoidal-shaped (truncated square) magnets (marked by dashed-line in
Fig. 2 (a)) are used in this work. The magnet plates have an overall side-length
of 200 mm and a separation gap of 10 mm. They are enclosed with a
10-mm-thick iron yoke. The spatial distribution of the magnetic field strength in the
65
mid-plane was mapped out with a Hall probe, and is shown as the grayed area
in Fig. 2(a). The peak field strength is 0.12 T. The fringed field decreases from
0.10 T at the edge to 0.05 T 10 mm away from the magnet plates. If the detector
is not inside the uniform region and there is no collimator at the entrance, the
electron trajectories and energy dispersions need to be precisely simulated using
70
a particle tracing program[12] in order to include the effects of fringe fields.
Simplified calculations using simple lorentz force consideration can be obtained
by minimizing fringe field effects with a collimator placed inside a central region
of 160 mm with field strength variation of only 1.26% (standard deviation).
An ultralow-carbon stainless-steel collimator was chosen as the entrance. The
75
collimator is 30 mm long with a 3.5 mm hole in the center (yellow in Fig. 2(a)).
The magnetic field increases from 0 to 0.12 Tesla within 13 mm beyond the
collimator hole. The scintillator screen was also inserted into the near-uniform
magnetic field region further reducing the effect of fringe field. A visible CW
laser (red dash line) was used to align the spectrometer.
80
The plastic scintillator is a DRZ fluorescent screen (Gd2O2S:Tb, type Pl-200)
having dimensions of 200 mm (length)×10 mm (width)×630 µm(thickness)
and emits light at 546 nm when impacted by energetic electrons. The scintillator
screen itself has a higher spatial resolution (a few 10’s of microns) than the
large-diameter scintillator fibers (typical 500µm)[10] and it is not the limiting factor
85
for the energy resolution. A 2 µm-thick aluminum-anodized mylar film was
placed before the scintillator to block scatted light. This type of scintillator has
been calibrated using ultrashort electron beam from a radio frequency linear
electron accelerator[20]. The 20 cm-long plastic scintillator sheet (dark-red line
in Fig. 1(a)) was positioned at 45◦with respect to the entrance axis. In this case,
.
e Pin-hole
Plastic fibers Fiber array holder
Areal fiber array
Linear fiber array
(b)
(a)
Scintillator
Fibers
Areal fiber array Linear fiber array
Collimator Magnets
fiber holder
Figure 1: (color online) The schematic (a) and photograph (b) of the magnetic spectrometer.
The regions in light blue and in green are magnet plates and the yoke, respectively. A
collimator was inserted into the region of near-uniform magnetic field strength. The red lines
indicate the fiber bundles. Two insets in (a) show the linear and areal interfaces of the fiber
[image:5.612.192.421.187.524.2]the spectrometer works in the focusing mode, i.e. finite-diameter collimated
electron beam is bent by the magnet and overlaps on the detector plane[11]. The
corresponding trajectories of the electrons with different energies were computed
by calculating the deflection angle according to the Lorentz force, which are
shown in Fig. 2(a).
95
A total number of 875 equally spaced 1-meter-long plastic fibers are placed in
close contact with the scintillator, to sample and guide the optical light signals
out of the spectrometer. The fiber bundle was further wrapped with aluminum
to avoid stray light. The cross-talk between channels was also checked using
a point laser source to be <4%. Although the spatial resolution of the
non-100
scintillating fibers is not as high as that of IPs, they were chosen due to several
advantages. Firstly, it is easier to shield the imaging system from scattered
light-s, and no optics are required in the crowded chamber, saving space for other
diagnostics. Secondly, the fibers can be easily bent. Therefore, the imaging
sys-tem can be setup using chamber windows away from the influences of radiations
105
(especially EMPs) and also to avoid conflicts with other diagnostics. Thirdly,
the plastic fibers can be rearranged into a matrix to fit the sCMOS/CCD camera
sensor for better imaging. Fourthly, the imaging component does not require
alignment, when re-positioning of the main body of the spectrometer becomes
necessary to measure the electron spectra along other directions. Lastly, the
110
fibers are insensitive to the radiations, hence no extensive shieldings are
need-ed.
Each fiber has a diameter of 0.75 mm. The separation of the centers of
adjacent fibers is 1 mm. In the scintillator end, five fibers were employed in
the non-dispersion direction for each specific electron energy, thus forming a
115
matrix of 5 × 175 fibers. This gives rise to 175 energy points in the
disper-sion direction. Figure 2(b) shows the energy disperdisper-sion and the resolving power
(E/∆E) with respect to the electron energy (E), where ∆Eis the energy
reso-lution atE. The electron traces in the magnetic field could be calculated using
equation d(γm#»v)/dt =−e· #»v ×B/c#» . Where γ is the relativity factor, m is
120
speed of electrons andcis the speed of light. In this case, E is calculated to be
ranging from 0.5 MeV to 4.8 MeV. The energy resolutions of the spectrometer
are determined by diameter of fibers and the beam sizes on scintillator. The
typical electron trajectories in the energy range of 1-4.5 MeV for an acceptance
125
angle of 2.4×10⁻⁴sr are shown in Fig. 2(a). The trajectories of mono-energetic
electrons entrancing the magnetic at two edges of the collimator will crossed on
the scintillator at two different positions as shown in Fig. 2(a). The distance
between these two positions would be the beam size on the scintillator and it
is marked by the size of the black dots in Fig. 2(a). The beam sizes on the
130
scintillator (black dots) are determined by the electron divergence, the
accep-tance angle of the collimator, electron energies, magnetic field and the position
of scintillator. It is less than 0.75 mm for energies lower than 1.4 MeV. For
electrons with energies higher than 1.4 MeV, the beam size is larger than the
fiber diameter, which becomes a predominant factor limiting the energy
reso-135
lution. As shown in Fig. 2(b), the resolving power first increases from 30 to
77 for the electron energies of 0.5-1.4 MeV due to the fiber diameter and then
decreases to 57 from 1.4 MeV to 4.8 MeV when the beam sizes are bigger than
fiber diameter. Since smaller diameter optical fibers (a few 10’s of microns)
are available, decreasing the acceptance angle or the diameter of the fibers will
140
improve the energy resolution.
The other end of the fiber bundle is in close contact with a thin glass
win-dow. Due to the fiber flexibility, the window could be selected from any flange
on the chamber, preferably away from the laser incident plane. A 16-bit
sC-MOS camera (ORCA-Flash4.0 LT, from Hamamatsu Photonics) coupled with
145
a f=6-12mm/F1.6 lens was used to image the fibers. The sCMOS camera was
chosen with consideration of several superior advantages: small pixel size (6.5
µm), high frame rate and low cost while remaining comparable in quantum
efficiency to EMCCD. The fiber bundle was re-organised to an areal
configura-tion of 25×35 fibers to maximize the usage of the sCMOS chip such that the
150
resolution of the imaging system is∼50µm/pixel. Similar work was reported
streak camera[21]. The light transport efficiency of the fiber bundle and
imag-ing system was relatively calibrated and the variation between energy channels
was 4.5% (standard deviation). Since the camera was detached from the target
155
chamber, the shielding was much easier.
3. Experiment and results
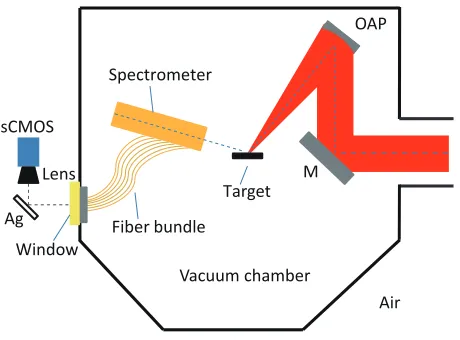
The experiment was carried out using the 200 TW Ti: sapphire laser at
Shanghai Jiao Tong University. The setup is schematically shown in Fig. 3.
After reflected from the high reflection mirror (M), the 25 fs p-polarized laser
160
beam was focused by anf/4 off-axis parabola mirror (OAP) at 36◦to the target
normal on 2-µm-thick iron foil targets. The focal spot is 6 µm in diameter
enclosing 25% of total energy. In this experiment, the energy on target is 1 J,
giving a peak intensity of ∼ 4×10¹⁹W/cm2. The electron spectrometer was
positioned 17 cm away from the target in the front side at an angle 12◦ to the
165
target surface for measuring the spectra of electrons emitted along the target
surface. We tested the flexibility of the spectrometer by quickly changing the
detection direction from 12◦ to 45◦ in less than 5 minutes. The energy spectra
of electrons emitted at 45◦was much weaker than that at 12◦. The acceptance
solid angle is 2.4×10⁻⁴ sr.
170
An example raw data measured along an angle of 12◦to the target surface is
shown in Fig. 4(a). The light intensities from the fibers have been normalized
and are comparable with each other. Each of the five columns (for I, II, III, IV
and V sub-groups) consists of 35 rows and each row corresponds to one energy
channel. The electron energy increases with the increment of channel number
175
from top left to bottom right. The overall trend is that the measured light
intensities decrease gradually with electron energies, indicating a decreasing
continuous energy spectrum (assuming a a flat calibration curve with electron
energies). A null test was made by blocking the entrance collimator with a piece
of 5-mm-thick lead, resulting in a background count of<10. This is more than
180
5
10
15
20
4
8
12
16
20
Y (cm)
X
(cm)
(a)
0
0.12
1
4.5
alignment laser collimater
B (T)
E (MeV)
0
(b)
1
2
3
4
5
0
10
15
20
Energy (MeV)
D
is
p
e
rs
io
n
(
cm
)
5
0
20
30
40
50
60
70
80
R
e
so
lv
in
g
P
o
w
e
r (
E
/d
E
)
Figure 2: (color online) (a) Trajectories of electrons in magnetic field (gray area). Two
colorbars depict the magnetic field distribution and the electron trajectories, respectively.
Black circles show the electron beam sizes on the scintillator. (b) Dispersion and energy
[image:9.612.196.420.146.578.2]Window sCMOS
Vacuum chamber Target
M
OAP
Fiber bundle Spectrometer
Ag Lens
Air
Figure 3: (color online) Schematic of the experimental setup. After reflected from the high
reflective mirror (M), the laser beam was focused by an off-axis parabola mirror (OAP) to
the solid target. The electron spectrometer was placed in the target front side to measure the
energy distribution of the fast electrons emitted close to the surface direction. The fluorescent
light from the scintillator screen were guided by the fiber bundle and detected with a
[image:10.612.192.422.254.424.2]100 200 300 400 500 600
100
200
300
400
500
600
700
0
1
2
3
4
5
In
te
n
si
ty
(
a
.u
)
Energy (MeV)
10
510
410
30.2
0.4
0.6
0.8
1
0
Pixel
Pi
xe
l
(a)
(b)
I
II
IV
V
1 35 36 70 71 E 105 106 140 141 175
III
Fitting ExperimentFigure 4: (color online) (a) Experimental raw data. Each colored circle spot corresponds
to one fiber channel. The red numbers and arrow indicate the energy channel and energy
increasing direction, respectively. (b) The measured light intensities (red) of the
scintillator-based detector and error bars (gray) for the fluctuations of different fibers in one energy
channel. A fit of the experiment datas was also plotted by considering a two-temperature
[image:11.612.194.419.157.536.2]The arrangement of the fiber bundle can cause fluctuations of coupling
effi-ciency between scintillator and fibers. To reduce the fluctuation in the data, the
maximum and minimum values for each energy channel were removed. Taking
into account the energy resolutions, we calculated the electron spectra using the
185
remaining three values of the fibers in each energy channel. The spectral
distri-bution of the sampled fast electrons showing a two-temperature distridistri-bution is
presented in Fig. 4(b) where the error bars are the data fluctuations from the
remaining three values in the same energy channel.
The reliability and the on-line capability were also tested experimentally.
190
10 consecutive shots were taken in 3 minutes for the same laser and target
parameters. The shot frequency was only determined by the time of replacing
targets, which could be as short as a few 10’s of seconds. Compared with
the use of IPs, which need to vent the chamber to read the stored signals,
the use of scintillator coupling with imaging system is much more attractive
195
in high-repetition-rate experiments. One could obtain the data on electron
energy spectrum shortly after each laser shot, which is the prerequisite to source
optimization for applications. The shot-to-shot fluctuations of the spectra was
measured to be less than 5%, which is within the error bars shown in Fig. 4.
4. summary
200
In summary, we have designed and tested a flexible, on-line electron
spec-trometer using a combination of plastic scintillator, plastic fiber array and
sC-MOS camera. This design would allow on-line measurement of fast electrons
produced by high-repetition laser pulses. Better energy resolution can be
ob-tained by using optical fibers with smaller diameters.
205
This spectrometer can also provide, though relatively modest, one-dimensional
angular resolution from the five fiber channels perpendicular to the dispersion
direction. The angular resolution could be improved by enlarging the entrance
pinhole with a long slit and increasing the number of fiber channels in the plane
perpendicular to the dispersion direction. With further revision, this novel
design could be employed to measure the angular and energy distributions of
low-divergence laser wakefield accelerated electron beams. Continuous
improve-ment and developimprove-ment could facilitate many high-power laser-plasma research
projects with a versatile diagnostic for fast electron generation.
Acknowledgments
215
We thank Professor Liming Chen for stimulating discussions and Professor
Antonio Ting for improving the quality of manuscript. This work was supported
by National Basic Research Program of China (Grant No. 2013CBA01502),
National Natural Science Foundation of China (Grant Nos. 11421064, 11205100
and 11305103) and National Key Scientific Instrument Development Project
220
(Grant No.2012YQ030142).
References
[1] M. Tabak, J. Hammer, M. E. Glinsky, W. L. Kruer, S. C. Wilks,
J. Woodworth, E. M. Campbell, M. D. Perry, R. J. Mason, Ignition and
high-gain with ultrapowerful lasers, Phys. Plasmas. 1 (1994) 1626–1634.
225
doi:http://dx.doi.org/10.1063/1.870664.
[2] H. Daido, M. Nishiuchi, A. S. Pirozhkov, Review of laser-driven ion
sources and their applications, Rep. Prog. Phys. 75 (5) (2012) 056401.
doi:10.1088/0034-4885/75/5/056401.
[3] A. Macchi, M. Borghesi, M. Passoni, Ion acceleration by
superin-230
tense laser-plasma interaction, Rev. Mod. Phys. 85 (2) (2013) 751–793.
doi:10.1103/RevModPhys.85.751.
[4] L. M. Chen, M. Kando, M. H. Xu, Y. T. Li, J. Koga, M. Chen, H. Xu,
X. H. Yuan, Q. L. Dong, Z. M. Sheng, S. V. Bulanov, Y. Kato, J. Zhang,
T. Tajima, Study of x-ray emission enhancement via a high-contrast
fem-235
tosecond laser interacting with a solid foil, Phys. Rev. Lett. 100 (2008)
[5] G. Q. Liao, Y. T. Li, Y. H. Zhang, H. Liu, X. L. Ge, S. Yang,
W. Q. Wei, X. H. Yuan, Y. Q. Deng, B. J. Zhu, Z. Zhang, W. M.
Wang, Z. M. Sheng, L. M. Chen, X. Lu, J. L. Ma, X. Wang,
240
J. Zhang, Demonstration of coherent terahertz transition radiation from
relativistic laser-solid interactions, Phys. Rev. Lett. 116 (2016) 205003.
doi:10.1103/PhysRevLett.116.205003.
[6] K. A. Tanaka, T. Yabuuchi, T. Sato, R. Kodama, Y. Kitagawa, T.
Taka-hashi, T. Ikeda, Y. Honda, S. Okuda, Calibration of imaging plate for
245
high energy electron spectrometer, Rev. Sci. Instrum. 76 (1) (2005) 013507.
doi:10.1063/1.1824371.
[7] H. Chen, N. L. Back, T. Bartal, F. N. Beg, D. C. Eder, A. J. Link, A. G.
MacPhee, Y. Ping, P. M. Song, A. Throop, L. Van Woerkom, Absolute
calibration of image plates for electrons at energy between 100 kev and 4
250
mev, Rev. Sci. Instrum. 79 (3) (2008) 033301. doi:10.1063/1.2885045.
[8] Z. Li, S. Nakamura, A. Fukumi, Y. Hayashi, S. Orimo, M. Nishiuchi, A.
Sag-isaka, M. Mori, T. Shirai, Y. Iwashita, A. Noda, H. Daido, Electron energy
spectrometer for laser-driven energetic electron generation, Jpn. J. Appl.
Phys. 44 (9A) (2005) 6796–6800. doi:10.1143/JJAP.44.6796.
255
[9] C. Gahn, G. D. Tsakiris, K. J. Witte, P. Thirolf, D. Habs,
A novel 45-channel electron spectrometer for high intensity
laser-plasma interaction studies, Rev. Sci. Instrum. 71 (4) (2000) 1642.
doi:http://dx.doi.org/10.1063/1.1150511.
[10] H. Chen, P. K. Patel, D. F. Price, B. K. Young, P. T. Springer, R. Berry,
260
R. Booth, C. Bruns, D. Nelson, A compact electron spectrometer for hot
electron measurement in pulsed laser solid interaction, Rev. Sci. Instrum.
74 (3) (2003) 1551. doi:http://dx.doi.org/10.1063/1.1526929.
[11] C. M. S. Sears, S. B. Cuevas, U. Schramm, K. Schmid, A. Buck, D. Habs,
F. Krausz, L. Veisz, A high resolution, broad energy acceptance
eter for laser wakefield acceleration experiments, Rev. Sci. Instrum. 81 (7)
(2010) 073304. doi:10.1063/1.3458013.
[12] H. J. Cha, I. W. Choi, H. T. Kim, I. J. Kim, K. H. Nam, T. M. Jeong, J. Lee,
Absolute energy calibration for relativistic electron beams with pointing
instability from a laser-plasma accelerator, Rev. Sci. Instrum. 83 (6) (2012)
270
063301. doi:10.1063/1.4725530.
[13] D. C. Eder, A. Throop, C. G. Brown, J. K. Jr., M. L. Stowell, D. A.
White, P. Song, N. Back, A. MacPhee, H. Chen, W. DeHope, Y. Ping,
B. Maddox, J. Lister, G. Pratt, T. Ma, Y. Tsui, M. Perkins, D. O’Brien,
P. Patel, Mitigation of electromagnetic pulse (emp) effects from
short-275
pulse lasers and fusion neutrons, LDRD Final Report. No.
LLNL-TR-411183.doi:10.2172/950076.
[14] H. Chen, S. C. Wilks, P. K. Patel, R. Shepherd, Short pulse laser produced
energetic electron and positron measurements, Rev. Sci. Instrum. 77 (10)
(2006) 10E703. doi:http://dx.doi.org/10.1063/1.2220141.
280
[15] T. Hosokai, K. Kinoshita, T. Ohkubo, A. Maekawa, M. Uesaka, A.
Zhid-kov, A. Yamazaki, H. Kotaki, M. Kando, K. Nakajima, S. V. Bulanov,
P. Tomassini, A. Giulietti, D. Giulietti, Observation of strong correlation
between quasimonoenergetic electron beam generation by laser wakefield
and laser guiding inside a preplasma cavity, Phys. Rev. E. 73 (3) (2006)
285
036407. doi:https://doi.org/10.1103/PhysRevE.73.036407.
[16] Y. Glinec, J. Faure, A. Guemnie-Tafo, V. Malka, H. Monard, J. P. Larbre,
V. D. Waele, J. L. Marignier, M. Mostafavi, Absolute calibration for a
broad range single shot electron spectrometer, Rev. Sci. Instrum. 77 (10)
(2006) 103301. doi:http://dx.doi.org/10.1063/1.2360988.
290
[17] K. Nakamura, B. Nagler, C. T´oth, C. G. R. Geddes, C. B.
Hooker, Gev electron beams from a centimeter-scale channel
guid-ed laser wakefield accelerator, Phys. Plasmas. 14 (5) (2007) 056708.
doi:http://dx.doi.org/10.1063/1.2718524.
295
[18] K. Schmid, L. Veisz, F. Tavella, S. Benavides, R. Tautz, D.
Her-rmann, A. Buck, B. Hidding, A. Marcinkevicius, U. Schramm,
M. Geissler, J. Meyer-ter Vehn, D. Habs, F. Krausz, Few-cycle
laser-driven electron acceleration, Phys. Rev. Lett. 102 (12) (2009) 124801.
doi:https://doi.org/10.1103/PhysRevLett.102.124801.
300
[19] J. S. Green, M. Borghesi, C. M. Brenner, D. C. Carroll, N. P. Dover, P. S.
Foster, P. Gallegos, S. Green, D. Kirby, K. J. Kirkby, P. McKenna, M. J.
Merchant, Z. Najmudin, C. A. J. Palmer, D. Parker, R. Prasad, K. E.
Quinn, P. P. Rajeev, M. P. Read, L. Romagnani, J. Schreiber, M. J. V.
Streeter, O. Tresca, C.-G. Wahlstr¨om, M. Zepf, D. Neely, Scintillator-based
305
ion beam profiler for diagnosing laser-accelerated ion beams, Proc.SPIE
8079 (2011) 807919. doi:10.1117/12.888967.
[20] Y. C. Wu, B. Zhu, K. G. Dong, Y. H. Yan, Y. Q. Gu,
Note: Absolute calibration of two drz phosphor screens using
ul-trashort electron bunch, Rev. Sci. Instrum. 83 (2) (2012) 026101.
310
doi:http://dx.doi.org/10.1063/1.3681442.
[21] R. Kodama, K. Okada, Y. Kato, Development of a two-dimensional
space-resolved high speed sampling camera, Rev. Sci. Instrum. 70 (1) (1999)