Stock Market Integration, Cost of Equity Capital and
Corporate Investment: Evidence from Brazil
*David Hillier a Tiago Loncanb
Department of Accounting and Finance University of Strathclyde
199 Cathedral Street, Glasgow G40QU, United Kingdom.
Abstract
We study the effect of stock market integration on the cost of capital and investment, using Brazil as a case study. We show that integration, as proxied by foreign ownership, has a positive impact on the financing side by reducing cost of capital. On the output side, we find that integration increases corporate investment, but only for well-governed firms. We contribute to the debate on the pros and cons of financial globalisation, particularly by providing evidence of important linkages between financial integration and real economic activity.
Keywords. Stock Market Integration; Cost of Capital; Investment; International Asset Pricing.
JEL Codes. F65, F61, F36, G15, G12.
*The authors are grateful for comments and discussions from participants at the European Financial Management
Symposium onFinance and Real Economy, held in Xiamen University, April, 2017. We also thank an anonymous reviewer and the journal’s Editor for insightful comments and suggestions. All errors are our own.
a
E-mail: david.hillier@strath.ac.uk.
b
1
Introduction
The past thirty years have seen a gradual erosion of financial and economic barriers, and
this has led to greater integration between emerging and developed capital markets. It is
generally accepted that higher levels of foreign stock ownership drives integration. However,
as noted by Bekaert et al. (2016), some of the benefits of financial liberalisation remain uncertain, especially with respect to integration velocity and its impact on improving the
real economy.
According to neoclassical international finance theory, equity market liberalisation leads
to improved risk sharing between domestic and international investors as well as lower cost
of equity (Henry, 2000b; Bekaert & Harvey, 2000; Chari & Henry, 2004). However, because
of home bias and time-varying integration, emerging stock markets can remain segmented
despite liberalisation events. A number of implicit barriers make integration imperfect, such
as home preferences in asset allocation, illiquidity, low institutional quality, poor corporate
governance, political risk and market volatility (Solnik & Zuo, 2016; Errunza & Ta, 2015;
Carrieri et al. , 2013; Bekaert et al. , 2010; de Jong & de Roon, 2005).
In this paper, we add a number of contributions to the financial globalisation debate
and empirically examine the effects of stock market integration on the cost of equity capital
and corporate investment. First, we estimate the effects of stock market integration on
stock returns for Brazilian stock portfolios. We use foreign ownership as a proxy for the
level of stock market integration, a time-varying measure of foreign investors’ presence in
the domestic stock market. We extend the findings from the integration and cost of capital
literature, recently reported by Bekaert et al. (2016), Carrieri et al. (2013) and Bekaert et al. (2010), with fresh evidence from a major emerging market.
Second, we study the role of asset characteristics, by analysing the effect of integration on
stock portfolios sorted by size, book-to-market ratios, momentum, illiquidity and corporate
governance quality. Although prior research has looked into some characteristics, evidence is
limited to investability, firm size and governance (Errunza & Ta, 2015; Bae & Goyal, 2010;
bring forth additional factors, such as growth opportunities, liquidity and momentum.
Third, we investigate how integration affects corporate investment, a real economic
vari-able. This is particularly important because there is no consensus on the role of financial
integration on capital accumulation and economic growth. We contribute to a growing body
of work by Larrain & Stumpner (2017), Bekaert et al. (2011), Gupta & Yuan (2009), Bon-figlioli (2008), Chari & Blair Henry (2008), Aizenmanet al. (2007) and Bekaertet al. (2005) and study the real economic effects of financial globalisation. Moreover, we provide a closer
look at the role played by corporate governance in the integration-investment nexus.
On the financing side, we present strong evidence that stock market integration decreases
the cost of equity capital. Foreign ownership, our measure of integration, was about 10%
of stock market capitalisation at the beginning of the sample period in 2001, rising steadily
and reaches levels close to 25% by the end of 2015. The increase in foreign ownership was
accompanied by a marginal reduction in expected returns, as we find a negative partial effect
of lagged foreign ownership on stock returns. We also show that the effects of integration
are unevenly split. In particular, large market capitalisation firms, more liquid stocks and
strong governance firms benefited more than their peers.
On the real economy side, we estimate the effect of financial integration on corporate
investment employing Vector Autoregressive Models. We split stocks into two portfolios,
clustering firms according to explicit corporate governance standards: Novo Mercado (a special corporate governance listing segment) andEx-Novo Mercado(firms with less stringent governance). Our findings suggest positive effects of stock market integration on investment,
but only forNovo Mercado firms.
The rest of our study is organised as follows. In Section Two, we discuss theories of
stock market integration. Section Three presents our dataset and Section Four describes the
methodology employed in our asset pricing analysis. In Section Five we present and discuss
our findings related to integration and the financing side, and in Section Six, we analyse the
2
Related Literature
2.1 Integration and the Cost of Equity Capital
In fully segmented markets, foreign investors have no access to the local equity market and
the domestic CAPM holds. Local investors do not benefit from global portfolio diversification
and there is no risk sharing with international investors. Domestic investors bear all risks
alone, resulting in higher risk and cost of capital. (Henry, 2000b).
A strong reason why market segmentation exists is because investor behavioural biases
affect asset allocations (Solnik & Zuo, 2012). Despite diversification benefits, investors
ex-hibit a home bias, investing disproportionally more in domestic stocks. This is due to capital
barriers, hedging motives and information asymmetries (Lauet al., 2010). Moreover, Solnik & Zuo (2016) note that domestic investors are more bullish about their home markets than
foreigners.
According to Kose et al. (2009), financial integration allows agents in different countries to pool their risks, generating welfare gains by lowering consumption volatility and delinking
fluctuations in domestic consumption and output. When a market is fully integrated, the
global market subsumes the domestic market and all assets are priced relative to world
market returns (Solnik, 1974; Stulz, 1981; Brennan & Solnik, 1989; Buckberg, 1995; Henry,
2000a; Bekaert & Harvey, 2000; Chari & Henry, 2004). According to Henry (2000b); Bekaert
& Harvey (2000); Sloek et al. (2002), integration occurs in full among domestic and foreign investors and there are benefits from global portfolio diversification and risk sharing . Risk
sharing decreases expected returns, leading to a lower cost of equity (Bekaert et al. , 2005). When segmented markets become integrated, stock prices have been shown to grow,
reflecting lower levels of risk and increased demand for local stocks (Stulz, 1999). This is
known as The Revaluation Effect (Chari & Henry, 2004; Patro & Wald, 2005; Christoffersen
et al. , 2006). In full integration models, the pace of integration is irrelevant for asset prices because risk sharing occurs instantaneously and the equity market becomes perfectly and
immediately integrated.
imper-fect. Despite numerous liberalisation events, emerging markets don’t integrate in full with
global markets. Instead of a one-off integration shock, market integration gradually becomes
stronger over time. This occurs for a number of reasons. First, integration is negatively
affected by episodes of financial turmoil and can suffer a reversal if risk aversion escalates.
There may also be implicit barriers related to institutional quality, corporate governance
and political risk, which may gradually (but not instantaneously) improve over time
(Carri-eriet al. , 2013; Bekaertet al. , 2010; Bekaert & Mehl, 2017). Finally, market incompleteness and weak enforceability of international financial contracts imposes frictions to integration,
further limiting risk sharing (Bai & Zhang, 2012).
Even after liberalisation events, some assets (e.g. micro-caps, illiquid stocks and equities
with restrictions on foreign ownership) can remain ineligible for foreign investors (Bekaert
et al., 2016; Errunza & Ta, 2015; de Jong & de Roon, 2005; Bekaert & Harvey, 1995; Bailey & Jagtiani, 1994). Since integration is incomplete, pricing frictions partially offset the benefits
arising from risk sharing.
2.2 Asset Characteristics and Corporate Governance
Prior research suggests that firm characteristics, such as size, investability and corporate
governance, matter for integration. Chari & Henry (2004) argue that the reduction in cost
of capital brought about by financial liberalisation can be split into two components: an
aggregate stimuli effect, which impacts all assets through lowering the risk-free rate, and an
asset-specific effect, which is stronger for investable firms.
With respect to firm size, evidence suggests that small firms benefit more from
liberali-sation events because they enjoy larger increases in stock prices following integration (Patro
& Wald, 2005) and a weakening of financial constraints with positive effects on investment
(Laeven, 2002). In contrast, Christoffersen et al. (2006) report that large firms’ stock prices increase more after a liberalisation event.
Corporate governance seems to play a key role, both before and after integration. Stulz
(2005) suggests that strengthening corporate governance is costly, and firms are more likely
integration creates incentives for firms to improve governance. This is consistent with the
argument proposed by Ferreira & Matos (2008), that foreign and independent institutional
investors take a more active stance in monitoring invested firms, hence firms must improve
on contracting efficiency and transparency to receive foreign capital.
Indeed, these arguments are supported by empirical evidence. Institutional investors
reveal preferences in stock-picking for firms with higher corporate governance standards and
more transparent management (Leuz et al. , 2009; Ferreira & Matos, 2008; Batten & Vo, 2015). Firms with stronger governance also experience greater equity revaluations following
stock market liberalisation (Bae & Goyal, 2010).
2.3 A model of imperfect stock market integration
We follow de Jong & de Roon (2005) and adopt an imperfect integration setting for our
theoretical framework. An imperfectly integrated market is characterised by two classes
of assets, investable and non-investable, and by two types of agents, foreign and domestic.
Domestic investors can hold both investable and non-investable portfolios whereas foreign
investors can hold only the investable portfolio. Since a fraction of local assets will be held
solely by domestic investors, these assets are partially excluded from the process of integration
and do not directly benefit from increased risk sharing. However, local investors make use of
the investable portfolio to hedge against idiosyncratic risk from the non-investable portfolio.
In this context, investable asset returns depend upon their covariance with global returns
(following the World CAPM) and upon an additional risk factor which arises from hedging
pressures from non-investible assets. The extent to which investable assets are priced with
respect to world market returns or locally with respect to non-investable asset returns is
explained by market segmentation (lack of integration). This is measured as the fraction
of assets in the local market which cannot be traded by foreign investors. Investable stock
returns are thus:
The first term on the right-hand side refers to the sensitivity of stock returns to global
market returns, whereas the second term reflects an additional risk factor stemming from
local investors’ hedging demand, caused by their holdings of non-investable assets. This
additional risk factor is weighted by segmentation (qt−1), capturing how integration efficiency
is reduced by local pricing imperfections arising from non-investable assets. Weaker market
integration leads to greater pricing imperfections and a higher cost of equity capital.
We adjust de Jong & de Roon (2005)’s model by replacing the segmentation variable
(qt−1) by stock market integration (It−1), proxied by foreign ownership (the value of the portfolio of stocks held by foreign investors as a share of total market capitalisation). The
equation becomes:
Et−1[RIt] =βiEt−1[Rwt] +δiIt−1 (2)
The cost of capital of investable assets, Et−1[RIt], is an increasing function of (i) the
sensitivity of returns, βi, to expected global market returns, Et−1[Rwt]; and (ii) a decreasing
function of the sensitivity of returns,δi, to the level of integration in the equity market,It−1. Hence, the theoretical coefficient signs are given by βi >0 andδi <0.
3
Data
Data on foreign ownership is manually collected from monthly reports published by the
Brazilian Securities and Exchange Commission (CVM). 1 Stock data is from the Brazilian Center for Research in Financial Economics of the University of Sao Paulo (NEFIN, 2016),
the Sao Paulo Stock Exchange (BMF&Bovespa), the Brazilian Central Bank (BACEN),
MSCI Global Equity Indexes, and Datastream. We analyse 180 consecutive months of data
for the period 2001 to 2015.
We calculate stock market integration as: It = M Vtf
M Vtf+d. In each month, the equity port-1
folio value held by foreign investors (measured in USD), M Vf, is divided by total stock
market capitalisation (measured in USD), M Vf+d, which is the portfolio held by domestic plus foreign investors. In accordance with the methodology of the Brazilian Securities and
Exchange Commission (CVM), we take a measure of foreign ownership which considers only
the holdings of foreign investors in stocks, but not foreign investments on corporate and
government bonds or derivatives.
The time series of foreign ownership captures how foreign investors’ presence in the
do-mestic market has evolved over time. Our variable for world market returns is the rate
of return on the MSCI World Equity Index (measured in USD), Rwt . 2 We examine size, growth opportunities, momentum and illiquidity portfolios and all returns are expressed in
USD. Size portfolios are based on stocks’ market capitalisation, growth opportunities
portfo-lios are sorted on stocks’ book-to-market ratios, momentum portfoportfo-lios are formed on returns
earned in preceding periods (cumulative returns between t-12 and t-2), and illiquidity
port-folios are sorted according to the previous twelve months illiquidity moving average, with
illiquidity calculated following Acharya & Pedersen (2005).
Portfolios are sorted as follows. Initially, assets listed in the BMF&Bovespa stock
ex-change undergo an eligibility screening. A stock is considered eligible in time t if it meets the following criteria: (i) the stock is the most traded equity class of the firm, (ii) the stock
was traded in at least 80% of days in year t-1, with volume greater than R$ 500.000 per day. The initial screening process resulted in a sample of 238 companies, corresponding to
60% of listed firms and 80% of total market capitalisation. In January of year t, portfolios are formed from sorting firms into three portfolios (small, medium, large) according to each
characteristic (Size, Book-to-Market, Momentum, and Illiquidity) as observed in period t-1. We use value-weighted returns (weighted by market capitalisation). 3
Portfolios are labelled according to the magnitude of each characteristic. For example, the
portfolio Size1 contains the smallest and Size3 contains the largest firms. The same labelling
2As foreign ownership is taken at the aggregate stock market level, it has no portfolio-specific variability, but
produces a portfolio-specific regression coefficient.
3For further methodological details as employed by NEFIN in constructing portfolios, please refer to their website:
convention applies to the other three characteristics. In robustness checks, we additionally
analyse portfolios double-sorted by size and book-to-market, size and momentum and size
and illiquidity.
In further testing, the role of corporate governance is analysed. We compare the effects
of integration between the broad market portfolio with all listed firms, named All Firms, and a special corporate governance portfolio, namedNovo Mercado (New Market), which is a special listing segment BMF&Bovespa relating to the highest governance standards (which
corresponds to 30-40% of the total number of listed firms).
Novo Mercado is differentiated from other segments by the following criteria: (i) firms can
only issue common stock (no preferential stock); (ii) there is a minimum of 25% free floating
shares; (iii) firms must comply with share dispersion efforts when publicly distributing shares;
(iv) boards must have a minimum of 5 directors, with 20% independent (external); (v) the
CEO-Chair role must be split; and (vi) financial statements must be translated to English,
among other rules. 4
Some of these rules are observed in other segments, but never all of them together, hence
there is a clear distinction in terms of governance quality between the constituents of the
Novo Mercado segment and other firms in the stock market. Thus, by comparing the effects
of integration on the broad portfolio (All Firms) and the Novo Mercado portfolio, we capture
the role of corporate governance. In the Table below we show descriptive statistics for the
dataset:
Insert Table 1 here
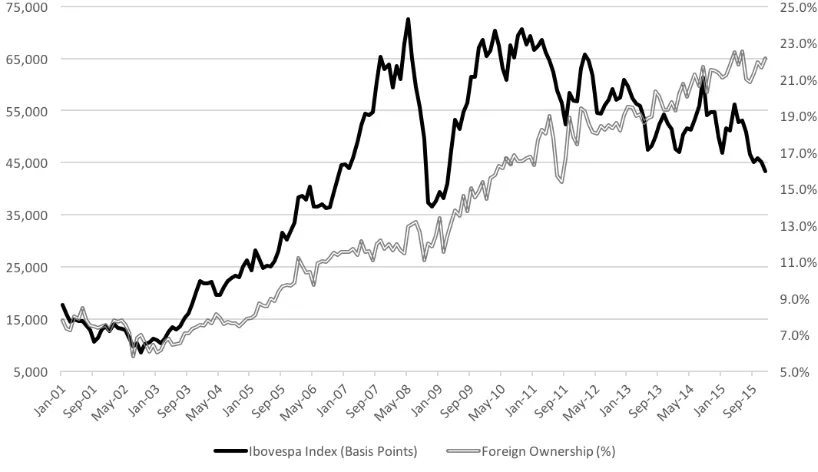
Figure 1 presents a time series plot for the level of foreign ownership (%) (integration) of
the Brazilian equity market and the Ibovespa stock index level 5, measured in basis points:
Insert Figure 1 here
4The full set of rules is presented at the BMF&Bovespa website:
http://www.bmfbovespa.com.br/en_us/listing/ equities/listing-segments/novo-mercado/
5Ibovespa is the main index in the Brazilian stock exchange, including the largest and most liquid stocks traded
At the beginning of our sample period, foreign ownership was around 10%. As the
Brazilian market became more integrated, foreign ownership increased to approximately
25%. After running standard tests for stationarity, foreign ownership is found to be
trend-stationary and stock market valuation non-trend-stationary. As a result, the foreign ownership
variable was de-trended (yearly averages were subtracted from monthly values), and
log-returns were first-differenced. These transformations produced stationary variables.
The correlation between the market index and contemporaneous foreign ownership is
statistically significant and positive (0.18), whilst the correlation between returns and lagged
foreign ownership is statistically significant and negative (-0.16). Such a shift in the sign of
the correlation between the market index and current / lagged foreign ownership reflects
two different effects of financial integration previously discussed in our literature review: a
positive contemporaneous correlation refers to a pricing revaluation effect as equity prices
increase when foreign investors buy stocks, whereas a negative correlation with lagged values
is due to risk sharing and a gradual reduction of systematic risk brought about by increases
in stock market integration.
4
Empirical Model
We estimate the empirical model below:
Rit−rftw =αi+βi(Rwt −rf w
t ) +δiIt−1+it (3)
Each portfolio’s return is calculated in excess of U.S risk-free rates, rftw. 6 Next, the Portfolio’s return is estimated as a function of (i) Rtw, the global rate of return, proxied
by the return on the MSCI World Index, in excess of the U.S risk-free rate, rfw
t ; (ii) It−1, lagged foreign ownership, which is measured by the proportion of equity value held by foreign
investors as a share of total market capitalisation; (iii)αi, a pricing error or deviation from the
ICAPM; and (iv) it, the error term. The empirical model is consistent with the theoretical
6
equation (2). 7
As suggested by Greene (2012), portfolio returns are correlated with the aggregate
mar-ket return and thus exposed to the same shocks, with residuals correlated across
portfo-lios. In light of cross-correlation of residuals, estimating single equations for each portfolio
via OLS (ordinary least squares) yields inconsistent estimates, and simultaneous equations
modelling is advised. Moreover, another shortcoming of pure OLS is that it fails to address
heteroskedasticity and serial correlation of returns (Cochrane, 2009). To obtain consistent
and efficient estimates, we model asset returns for our portfolios simultaneously via GMM
(Generalised Method of Moments), with moment conditions shown below:
Et[m(αi, βi, δi)] =Et{
1 t
t
X
t=1
[(Rit−rftw)−αi−βi(Rwt −rf w
t )−δiIt−1)]}= 0, i= 1, n (4)
The model is specified with one moment condition per estimated parameter, thus the
GMM model is exactly identified. The equations are estimated employing HAC robust
stan-dard errors with Bartlett Kernel, for addressing possible issues related to heteroskedasticity
and serial autocorrelation in the error term.
We also compare the coefficients fitted for the integration variable across portfolios. We
do so by testing a null hypothesis of equality of coefficients, employing a χ2 test. The null hypothesis is that coefficients are statistically equal to one another, and thus integration
produces no portfolio-specific idiosyncratic effects: H0 : δi = δj = ... = δn. Accepting
the null hypothesis implies that asset characteristics are irrelevant in the integration process.
Conversely, rejecting the null hypothesis offers evidence in favour of asset-specific integration
effects.
7Although we acknowledge that other multi-factor models would also be consistent with integration theory, we
5
Results
5.1 Main Results
Table 2 presents the estimation results for our asset pricing equations:
Insert Table 2 here
The coefficient of equity market integration, as proxied by foreign ownership, is
statisti-cally significant and negative for all portfolios analysed. It is clear that integration reduces
expected returns, supporting the hypothesis of time-varying stock market integration
reduc-ing systematic risk and hence lowerreduc-ing expected returns and the cost of capital (Errunza &
Ta, 2015; Carrieri et al. , 2013; de Jong & de Roon, 2005). Our results are consistent with the liberalisation literature, in that integration reduces the cost of capital (Henry, 2000a;
Bekaert & Harvey, 2000; Chari & Henry, 2004; Patro & Wald, 2005; Christoffersen et al. , 2006).
We now discuss the role of portfolio characteristics, comparing the coefficients fitted for
integration across portfolios, as shown in Panel B of Table 2. For size portfolios (s1, s2,
s3), we find that large and mid caps (s3 and s2) benefit more than small caps (s1), with
statistically significant differences in coefficients. This finding concurs with Christoffersen
et al. (2006) and Huang (2007), as they report stronger integration effects for large firms. For book-to-market portfolios (bm1, bm2 and bm3), the effect of stock market integration
on returns is statistically significantly stronger for mid book-to-market firms (bm2).
With respect to momentum (m1, m2, and m3), stocks with low momentum (m1) seem
to benefit more, and the difference is statistically significant with respect to mid-momentum
stocks (m2). More liquid stocks (i1) experience a stronger reduction in expected returns,
and this is statistically different with respect to mid-illiquid stocks (i2).
5.2 The role of Corporate Governance
In this section, we investigate the effects of stock market integration on firms observing
BMF&Bovespa) and the broad market portfolio, which includes all firms listed in the stock
market (labelled All Firms). Results are shown in Table 3 below:
Insert Table 3 here
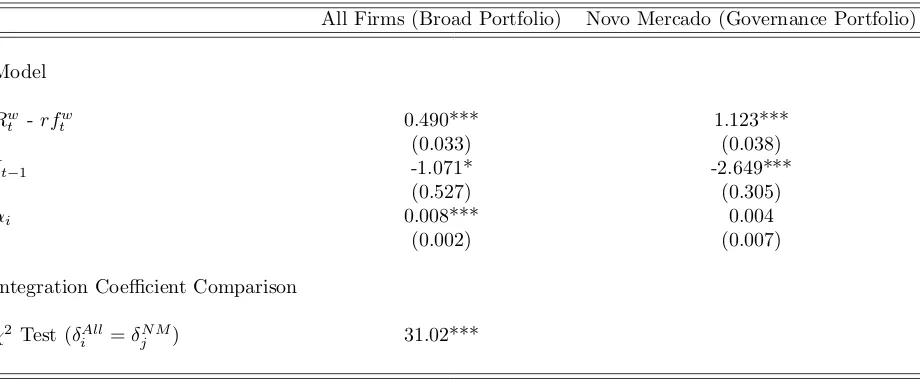
The effect of stock market integration on expected return is much stronger for the good
governance portfolio, when compared to the broad stocks portfolio (All Firms), and the
difference in the coefficients is highly statistically significant. Firms observing best corporate
governance practices enjoyed a substantially stronger fall in the cost of equity capital than
their peers in the broad market portfolio.
Our results are consistent with prior research. First, financial integration is more efficient
when contracting is transparent (Stulz, 2005). Second, financial systems with higher levels
of financial and institutional quality tend to benefit more from integration (Chinn & Ito,
2002). Third, the quality of institutions (reflected in governance quality here) matter a great
deal for emerging countries in attracting foreign equity capital (Byrne & Fiess, 2016).
5.3 Robustness checks
5.3.1 Currency Exposure
In this section, we study the role of currency exposure in the integration process. This is
relevant in our analysis because the Brazilian Real suffered several shocks, mostly
devalua-tions, during the period covered in our study (2001-2015). Taking the perspective of foreign
investors, the exchange rate between local and foreign currencies affects the relative price of
Brazilian stocks, and this pricing effect might affect how integration impacts cost of equity.
To disentangle integration from currency effects, we estimate a multi-factor international
asset pricing model, including an additional factor, Ct, capturing currency exposure (the
log-difference of the exchange rate between the Brazilian Real and the U.S Dollar), in a
spirit similar to Solnik (1983) and Koedijk et al. (2002).
Rit−rftw =αi+βi(Rtw−rf w
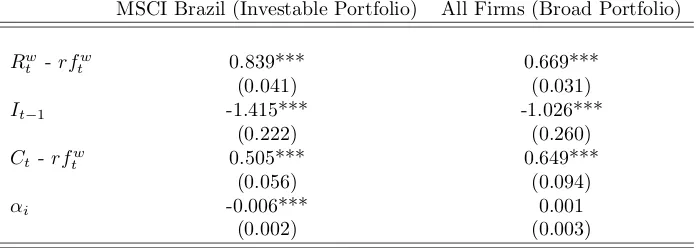
For brevity, models are estimated for two portfolios: MSCI Brazil portfolio (investable
stocks) and All Firms (broad portfolio), with results shown in Table 4. We find that the
currency factor is statistically significant and with positive loading on both portfolios. Even
after including currency factors, the effect of integration on returns remained statistically
significant and negative for both portfolios. Therefore, integration effects are robust to
exchange rate variations, though currency factors are relevant determinants of asset prices.
Insert Table 4 here
5.3.2 A Closer Look at the Role of Asset Characteristics: Double-Sorted Portfolios
In this section we analyse double-sorted portfolios. This is particularly helpful in fine-tuning
our analysis of the role played by asset characteristics. By double-sorting the portfolios, we
check the robustness of results with a more granular sorting.
The sample is split at the median for each characteristic (s1, s2, bm1, bm2, m1, m2, i1,
i2), and assets are double-sorted, creating twelve new portfolios double-sorted by size and
book-to-market (s1bm1, s1bm2, s2bm1, s2bm2), size and momentum (s1m1, s1m2, s2m1,
s2m2) and size and illiquidity (s1i1, s1i2, s2i1, s2i2). The results are presented in Table 5.
Insert Table 5 here
Considering first the size and book-to-market double-sorted portfolios (s1bm1, s1bm2,
s2bm1, s2bm2), the greatest reduction in expected return was experienced by the s2bm1
portfolio (large caps with low book-to-market ratios or high growth opportunities). Portfolios
double-sorted by size and momentum (s1m1, s1m2, s2m1, s2m2) show stronger effects for
the s1m1 portfolio, with small caps posting low momentum.
For size and illiquidity double-sorted portfolios (s1i1, s1i2, s2i1, s2i2), the biggest
reduc-tion in returns was experienced by portfolio s1i1, that is small liquid stocks. In all, these
additional findings corroborate the evidence from the previous section, in that large firms
(in particular those with high growth opportunities) and more liquid stocks (in particular
Next, we estimate the models with portfolio returns in excess of the local interest rate,
replacing for the global risk-free rate, as shown in Panel B of the table. We don’t find
significant changes in our results, concluding that integration effects remain robust even
if local interest rates are used as the benchmark for risk-free investments in the domestic
market.
5.3.3 Causality
According to the positive feedback and momentum trading hypotheses (Froot et al. , 2001; Kaminsky et al. , 2004), stock prices may drive increases in integration. In this section we check for the direction of causality. The economic intuition behind the test is as follows:
If foreign investors respond to current stock prices in the local market by investing in
lo-cal stocks, stock returns will lead to greater integration, consistent with feedback trading.
However, if foreign ownership causes changes in stock returns, integration theory holds.
To verify the direction of causality, we run Granger causality tests between foreign
own-ership and domestic market returns, proxied by the returns earned on the MSCI Brazil Index
(Rm
t −rftw). According to the conditional asset pricing literature, local interest rates affect
ex-pected market returns (Jagannathan & Wang, 1996; Petkova & Zhang, 2005). Consequently,
we include a control variable for interest rates in our test. We run causality tests between
foreign ownership (It) and the market return (Rmt −rftw), controlling for local interest rates,
proxied by the Brazilian interbank rate (∆rfd t). 8
The tests employ one, two, and three lags, consistent with optimal lag selection tests based
on information criteria. The null hypothesis is that lagged values ofxj are jointly insignificant
explanatory variables in a regression equation in which xi is the dependent variable, after
controlling for past values ofxi too. If lagged regressorsxj are jointly statistically significant,
then xj Granger-causes xi. The results are shown in Table 6 below:
Insert Table 6 here
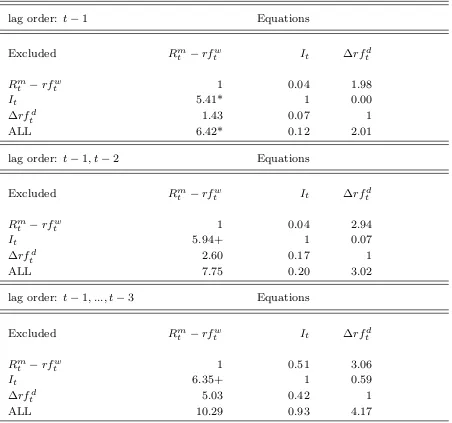
We find that foreign ownership Granger-causes changes in domestic market returns (with
8In addition to interest rates, we also tested models including default risks and dividend yields, finding that these
negative coefficients, not shown) in all models, independently of the lag structure specified,
though the significance of the test statistic is stronger with a one-period lag specification.
However, market returns do not Granger-cause integration, and this result holds for all
models, therefore causality runs from stock market integration to asset prices.
5.3.4 Longer Time Horizon and Other Checks
We now briefly comment on some additional robustness checks. First, we looked at the effect
of integration on expected returns over a longer time horizon, from 1995 till 2015. We don’t
have portfolio data dating back to the nineties, but we estimated models for the domestic
market index,Rm
t (MSCI Brazil portfolio). We find that the same results obtained previously
still hold, with integration reducing expected returns. To assess the time-varying pattern of
integration, we estimated the integration coefficient over time on a 72-month rolling window
(with similar findings for 36, 48 or 60-months rollings). We show the dynamics of integration
in Figure 2 below:
Insert Figure 2 here
The rolling window gives the first point estimate in the year 2000. The effect of integration
on expected returns was stronger at the beginning of the period, converging to near-zero
values, especially around the 2008 financial crisis. The effect of integration on expected
returns becomes smaller as we approach the end of the sample period, and it seems stock
market integration yields decreasing marginal returns over time.
Third, we estimated additional models using a segmentation variable in the spirit of
de Jong & de Roon (2005), calculated as the market capitalisation of non-investable assets
(those illiquid stocks considered ineligible in our sorting criteria) divided by total market
capitalisation. We find that higher levels of segmentation are associated with higher expected
returns, fully in line with the results reported by de Jong & de Roon (2005). Lastly, we
controlled for local SMB (small-minus-big) and HML (high-minus-low) risk factors, without
6
Integration and Real Economic Activity
In this section, we extend our analysis and investigate whether stock market integration
produces effects on real economic activity, studying corporate investment. As the ultimate
objective of an efficient financial market is to provide resources to be employed in productive
activities, the pervasive question of whether stock market integration is linked to real growth
and higher investment is important.
There is an ongoing debate on whether financial globalisation has helped emerging
mar-kets expand and boost investment (Bekaert et al. , 2016). Some studies argue that liberali-sation has alleviated financial constraints and decreased the cost of capital, thereby boosting
investment, growth and productivity (Henry, 2000a; Laeven, 2002; Bekaert et al. , 2005; Ranciere et al. , 2006; Chari & Blair Henry, 2008; Bonfiglioli, 2008; Gupta & Yuan, 2009; Bekaert et al. , 2011; Larrain & Stumpner, 2017). However, other studies have found no systematic investment and growth bonus linked to increasing the level of foreign ownership
in emerging markets (Singh & Weisse, 1998; Stiglitz, 2000; Aizenman et al. , 2007), with financial integration linked to increases in consumption volatility (Kose et al. , 2003).
Moreover, empirical evidence relating to the 2008 financial crisis has documented a strong
rebalancing of foreign equity portfolios of institutional investors, with sudden outflows of
capital from emerging economies back to safe haven developed countries (Fratzscher, 2012;
Forbes & Warnock, 2012). Also, foreign capital may cause exchange rate overheating and
bubbles in asset prices (Aizenman & Pasricha, 2013), often triggering government
interven-tions in the form of capital controls, like in Brazil during the 2009-2011 period (Chamon &
Garcia, 2016; Jinjarak et al. , 2013).
6.1 Data and Methods
As foreign stock ownership relates to only a subset of publicly-listed firms, it is more suitable
to study the effects of integration on corporate investment rather than on domestic aggregate
investment. We model the relationship between integration and investment employing a
with constituents of the Novo Mercado Corporate Governance Index, labeled NM, and all other firms pooled together in a portfolio labeled Ex-NM. We create portfolios based on corporate governance quality following empirical evidence showing that firms observing best
corporate governance practices receive more financing from foreign investors (Ferreira &
Matos, 2008; Leuz et al. , 2009). 9
Our model follows Romer (2012), with investment (IKt) modelled as a function of growth
opportunities (Y Kt) and lagged investment (IKt−k), plus our additional variable
captur-ing stock market integration (It). We measure investment by calculating investment ratios
(capital expenditures divided by property, plant and equipment). One problem with the
neoclassical approach is that growth opportunities are often proxied by Tobin’s Q, a stock
market-based proxy. This has been strongly criticised because stock prices tend to diverge
from fundamentals (Bond & Cummins, 2001). We use an alternative measure to capture
firms’ fundamentals, employing a sales-based measure of growth opportunities, calculated as
net revenues divided by the capital stock (property, plant and equipment).
We also include a number of exogenous variables which may potentially affect investment:
local interest rates, proxied by the Brazilian interbank deposit rate (Swap PRE-DI rate),
international interest rates, benchmarked by the U.S 3-months T-bill, the exchange rate
between the Brazilian Real and the U.S Dollar, the natural logarithm of the Brazilian Retail
Sales Index (calculated by government agency IBGE, measured in basis points), to capture
economic expectations and consumer confidence, a dummy for the 2008 financial crisis, and
quarterly dummies to absorb any seasonal effects.
We use quarterly data from corporate financial statements for non-financial firms, sourced
from Datastream, WorldScope and Capital IQ. In every quarter between 2005 and 2015, we
calculate the simple median for the investment rate (IKt) and growth opportunities (Y Kt)
for the two aforementioned portfolios. The Novo Mercado portfolio has 128 firms and the
Ex-NM portfolio has 261 firms. For integration, we use foreign ownership as in earlier tests.
10 Descriptive statistics are presented in Table 7.
9Indeed, institutional ownership is 32% in the Novo Mercado portfolio and 12% in the Ex-Novo Mercado portfolio. 10
Insert Table 7 here
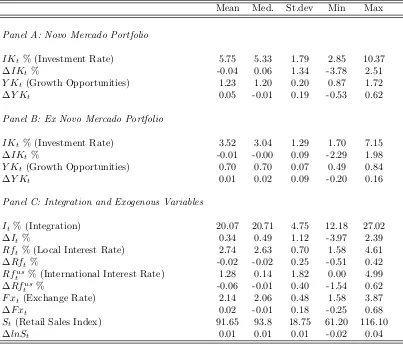
Investment rates are higher for the Novo Mercado portfolio: median quarterly
invest-ment is 5.3% for the NM portfolio and 3.5% for the Ex-NM portfolio. These quarterly
rates correspond to yearly rates of 21% and 14%, respectively. These numbers are
simi-lar as those reported in other papers studying corporate investment in emerging economies
(Laeven, 2002; Chari & Blair Henry, 2008). Also, firms in the Novo Mercado portfolio enjoy
a substantially higher growth opportunity set than their peers (quarterly medians are 1.20
and 0.59, respectively).
6.2 VAR specification and tests
We fit a Vector Autoregressive Model with additional exogenous covariates. The vector of
endogenous variables is yt = [IKt, It, Y Kt], including investment, integration and growth
opportunities. The vector of exogenous variables is xt= [Rft, Rftus, F xt, St, d2008, Qt], and
contains local and international interest rates, the exchange rate between the Brazilian Real
and the U.S dollar, the natural logarithm of the Brazilian Retail Sales Index and dummies
for the 2008 crisis period and for financial quarters. Our VAR is specified as:
yt =a+A1yt−1+. . .+Anyt−n+Bxt+et (6)
In the system of equations above, yt is a vector of endogenous variables, A1, ...,An are
vectors of coefficients fitted for endogenous variables, xt is a vector containing exogenous
covariates, B is a vector of coefficients for exogenous variables, a is a vector of intercepts,
and et is the error vector.
We test for stationarity employing the Augmented Dickey-Fuller test, and all variables are
found to have unit root with 95% confidence level. Hence, we first-differenced all variables.
Optimal lag selection tests based on information criteria pointed to a model with four lags
(FPE, AIC, HQIC and SBIC). We carried out standard tests to ensure a correct model
specification. First, we test for Eigenvalue stability condition, finding that all Eigenvalues
lie within the unit circle, hence the VAR is stable. Second, we test for serial correlation
in the lag structure of the model, employing a Lagrange Multiplier test, accepting the null
hypothesis of no serial correlation. We test for residual normality, employing the Jarque-Bera
test, finding normally distributed residuals.
6.3 Results
Our analysis is based on four components following the time series literature (Stock &
Wat-son, 2001; Kilian et al. , 2013; Luetkepohl, 2011). First, we inspect the coefficients fitted by our VAR model. Second, we conduct Granger Causality tests. Third, we study Forecast
Error Variance Decompositions. Fourth, we compute Impulse-Response functions. We show
the full results of these analyses for the Novo Mercado portfolio, comparing with the Ex-Novo
Mercado portfolio by graphical inspection of Impulse-Response functions.
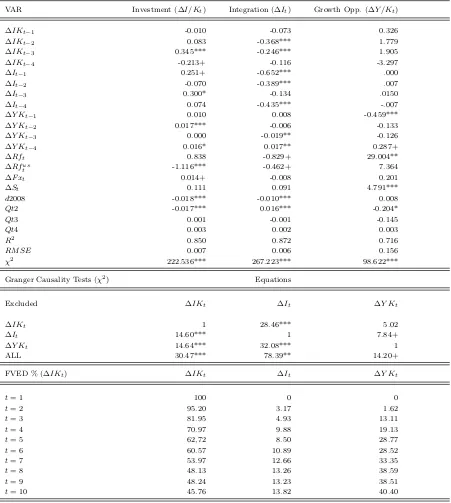
Insert Table 8 here
We focus on the coefficients fitted for the investment rate equation (first column of
Ta-ble 8). Investment is highly persistent, as lagged investment statistically explains current
investment. The effect of stock market integration on corporate investment is statistically
significant and positive, as both the first (0.25) and third (0.30) lags of integration cause
increases to investment. The same holds for the effects of growth opportunities, as both the
second (0.016) and fourth (0.017) lags are statistically significant and positive. With respect
to exogenous variables, investment is a decreasing function of international interest rates, an
increasing function of the exchange rate, was negatively affected by the 2008 crisis and tends
to be lower in the second quarter of the year.
Moreover, we find that both integration and growth opportunities Granger-cause
invest-ment. Interestingly, integration and investment have a mutual feedback relationship, as past
levels of investment also Granger-causes integration, but in this case the effect is negative
(as per the fitted VAR coefficients shown in column 2). It seems that increased integration
affects investment positively, but foreign investors join the market following periods of low
In the third part of the table Forecast Error Variance Decompositions are shown. We
find that lagged investment explains 45% of changes in current investment, whereas changes
in growth opportunities explain 40%, and another 13% is explained by integration. Hence,
lagged investment and growth opportunities explain most of variations in current investment,
but stock market integration plays a non-negligible role as well.
Lastly, we analyse Impulse-Response functions (IRFs). Because IRFs are correlated,
we calculate cumulative orthogonalised Impulse-Response functions (COIRFs), showing the
response of investment to a one-time, unitary shock on stock market integration, for both
the Novo Mercado and Ex Novo Mercado portfolios:
Insert Figures 3 and 4 here
Referring to Figures 3 and 4, for firms in the Novo Mercado portfolio, a one standard
deviation impulse to stock market integration shifts investment rates upwards by 0.40-0.60%.
The cumulative effect rises until 6-8 periods forward, and then stabilises. Interestingly, for
the Ex-Novo Mercado portfolio the response of investment is actually negative (-0.20-0.30%).
Therefore, stock market integration benefits investment but only for firms following best
corporate governance practices.
Our findings are in line with models of corporate investment, as investment responds
positively to innovations in growth opportunities (Romer, 2012), with lagged investment
effects stemming from adjustment costs (Eberly et al. , 2012). Our results concur with findings from other papers which have reported positive effects of financial integration on
investment and real economic activity, both at aggregate-level and firm-level (Henry, 2000b;
Laeven, 2002; Bekaert et al. , 2005; Chari & Blair Henry, 2008; Gupta & Yuan, 2009). Moreover, the evidence we provide on the crucial role played by corporate governance is
in line with the argument of Stulz (2005), corroborating that financial globalisation boosts
6.4 A robustness test with firm-level investment regressions
In this section we estimate firm-level investment regressions on a yearly basis. Integration
is again proxied by foreign ownership (Fit). To capture corporate governance, we include
a dummy taking the value of one if the firm is listed on Novo Mercado (N Mi), and zero
otherwise. We control for growth opportunities (Y Kit) and for firm size (log sales, lnSit).
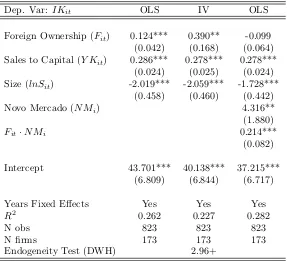
We test for endogeneity between investment and foreign ownership employing a
Durbin-Wu-Hausman test (test statistics are shown together with regression results). Though
exo-geneity is rejected, the test statistic has weak significance (at 10% level). Thus, we estimate
the model via both ordinary least squares and instrumental variables. Foreign ownership
is instrumented by M SCIit, a dummy taking the value of 1 if the firm is a constituent of
MSCI Emerging Markets Index, and zero otherwise. This variable is correlated with foreign
ownership (0.19, p < 0.01), but uncorrelated with investment. We estimate the equation
below, with results shown in Table 9:
IKit =α+β1Fit+β2Y Kit+β3lnSit+β4N Mi+β5Fit·N Mi+eit (7)
Insert Table 9 here
Foreign ownership marginally increases investment, and investment is an increasing
func-tion of growth opportunities, but a decreasing funcfunc-tion of firm size. In the second column,
we estimate the model via instrumental variables using the MSCI constituency dummy as
an instrument for foreign ownership. Again, we find that foreign ownership causes increases
in investment, and the coefficients for the control variables remain fairly unchanged.
In the third column, we include the dummy for good governance, and an interaction
of this dummy and foreign ownership. The dummy is statistically significant and positive,
hence well-governed firms invest more. The interaction of foreign ownership and governance
is statistically significant and positive, and after its inclusion, the linear term of foreign
ownership becomes negative (statistically insignificant). Thus, foreign ownership increases
7
Conclusions
We study the effects of stock market integration on the cost of equity capital and corporate
investment using the Brazilian equity market as a case study. Our results show that increased
levels of stock market integration (proxied by foreign ownership) reduce firms’ cost of capital.
We also found evidence that asset characteristics play an important role in the integration
process, as the benefits from integration are unevenly distributed. Size, book-to-market,
liquidity and good corporate governance all impact the strength of integration on expected
returns.
The findings from our investment models provide evidence for an active role of stock
market integration in fostering corporate investment, but the effect depends on governance
quality. We show that the effect of integration on investment is positive for firms abiding by
best governance practices, but negative for firms observing less stringent governance. In light
of these results, we conclude that stock market integration produces beneficial outcomes for
the local economy, though such benefits should be caveated, as the effects on real variables
do not spill over equally across all firms, benefiting only well-governed firms.
Our paper has important practical, managerial and public policy implications. The
evi-dence strongly suggests that by increasing local stock market integration, firms will enjoy a
lower cost of capital, and provided they also have strong corporate governance, such decreased
cost of equity financing will translate into higher levels of investment, thereby stimulating
economic growth.
We acknowledge a number of limitations in our study. Foreign ownership is a good proxy
for integration, but as any proxy it is an imperfect measure. Particularly, in our asset
pricing models we employ a market-wide measure of foreign ownership, with no
portfolio-specific variation. We estimate the effects of foreign ownership on corporate investment,
yet we recognise that more general evidence from aggregate domestic investment would be
helpful as well. Finally, we study a single country. Our findings are robust for Brazil, but
References
Acharya, Viral V., & Pedersen, Lasse Heje. 2005. Asset pricing with liquidity risk.
Journal of Financial Economics, 77(2), 375–410.
Aizenman, Joshua, & Pasricha, Gurnain Kaur. 2013. Why do emerging markets
liberalize capital outflow controls? Fiscal versus net capital flow concerns. Journal of International Money and Finance, 39(C), 28–64.
Aizenman, Joshua, Pinto, Brian, & Radziwill, Artur. 2007. Sources for financing
domestic capital - Is foreign saving a viable option for developing countries? Journal of International Money and Finance, 26(5), 682–702.
Bae, Kee-Hong, & Goyal, Vidhan K.2010. Equity market liberalization and corporate
governance. Journal of Corporate Finance, 16(5), 609–621.
Bai, Yan, & Zhang, Jing. 2012. Financial integration and international risk sharing.
Journal of International Economics, 86(1), 17–32.
Bailey, Warren, & Jagtiani, Julapa. 1994. Foreign ownership restrictions and stock
prices in the Thai capital market. Journal of Financial Economics, 36(1), 57–87.
Batten, Jonathan A., & Vo, Xuan Vinh. 2015. Foreign ownership in emerging stock
markets. Journal of Multinational Financial Management,32, 15–24.
Bekaert, Geert, & Harvey, Campbell R. 1995. Time-Varying World Market
Inte-gration. Journal of Finance, 50(2), 403–44.
Bekaert, Geert, & Harvey, Campbell R. 2000. Foreign Speculators and Emerging
Equity Markets. Journal of Finance, 55(2), 565–613.
Bekaert, Geert, Harvey, Campbell R., & Lundblad, Christian. 2005. Does
financial liberalization spur growth? Journal of Financial Economics, 77(1), 3–55.
Bekaert, Geert, Harvey, Campbell R., Lundblad, Christian T., & Siegel,
Stephan. 2010. What Segments Equity Markets? Review of Financial Studies, 24(12), 3841–3890.
Bekaert, Geert, Harvey, Campbell R., & Lundblad, Christian. 2011. Financial
Openness and Productivity. World Development, 39(1), 1–19.
Bekaert, Geert, Harvey, Campbell R, Kiguel, Andrea, & Wang, Xiaozheng.
2016. Globalization and Asset Returns. Annual Review of Financial Economics, 8, 221– 288.
Bond, Steve, & Cummins, Jason. 2001 (Sept.). Noisy share prices and the Q model of investment. IFS Working Papers W01/22. Institute for Fiscal Studies.
Bonfiglioli, Alessandra. 2008. Financial integration, productivity and capital
accumu-lation. Journal of International Economics, 76(2), 337–355.
Brennan, M. J., & Solnik, B. 1989. International risk sharing and capital mobility.
Journal of International Money and Finance, 8(3), 359–373.
Buckberg, Elaine. 1995. Emerging Stock Markets and International Asset Pricing. World Bank Economic Review, 9(1), 51–74.
Byrne, Joseph P., & Fiess, Norbert. 2016. International capital flows to emerging
markets: National and global determinants. Journal of International Money and Finance,
61(C), 82–100.
Carrieri, Francesca, Chaieb, Ines, & Errunza, Vihang. 2013. Do Implicit Barriers
Matter for Globalization? Review of Financial Studies, 26(7), 1694–1739.
Chamon, Marcos, & Garcia, Marcio. 2016. Capital controls in Brazil: Effective?
Chari, Anusha, & Blair Henry, Peter. 2008. Firm-specific information and the
effi-ciency of investment. Journal of Financial Economics,87(3), 636–655.
Chari, Anusha, & Henry, Peter Blair. 2004. Risk Sharing and Asset Prices: Evidence
from a Natural Experiment. Journal of Finance, 59(3), 1295–1324.
Chinn, Menzie D., & Ito, Hiro. 2002 (May). Capital Account Liberalization, Institu-tions and Financial Development: Cross Country Evidence. NBER Working Papers 8967. National Bureau of Economic Research, Inc.
Christoffersen, Peter, Chung, Hyunchul, & Errunza, Vihang. 2006. Size
mat-ters: The impact of financial liberalization on individual firms. Journal of International Money and Finance,25(8), 1296–1318.
Cochrane, John H. 2009. Asset Pricing (Revised Edition). Princeton university press.
de Jong, Frank, & de Roon, Frans A. 2005. Time-varying market integration and
expected returns in emerging markets. Journal of Financial Economics, 78(3), 583–613.
Eberly, Janice, Rebelo, Sergio, & Vincent, Nicolas. 2012. What explains the
lagged-investment effect? Journal of Monetary Economics,59(4), 370–380.
Errunza, Vihang, & Ta, Hai. 2015. The Impact of Investability on Asset Valuation.
Journal of Financial and Quantitative Analysis,50(05), 1135–1163.
Ferreira, Miguel A., & Matos, Pedro. 2008. The colors of investors’ money: The
role of institutional investors around the world. Journal of Financial Economics, 88(3), 499–533.
Forbes, Kristin J., & Warnock, Francis E.2012. Capital flow waves: Surges, stops,
flight, and retrenchment. Journal of International Economics, 88(2), 235–251.
Fratzscher, Marcel. 2012. Capital flows, push versus pull factors and the global financial
Froot, Kenneth A., O’Connell, Paul G. J., & Seasholes, Mark S. 2001. The
portfolio flows of international investors. Journal of Financial Economics,59(2), 151–193.
Greene, William H. 2012. Econometric Analysis. 7 edn. Pearson Education Limited.
Gupta, Nandini, & Yuan, Kathy. 2009. On the Growth Effect of Stock Market
Liber-alizations. Review of Financial Studies,22(11), 4715–4752.
Henry, Peter Blair. 2000a. Do stock market liberalizations cause investment booms?
Journal of Financial Economics, 58(1-2), 301–334.
Henry, Peter Blair. 2000b. Stock Market Liberalization, Economic Reform, and
Emerg-ing Market Equity Prices. Journal of Finance, 55(2), 529–564.
Huang, Wei. 2007. Financial integration and the price of world covariance risk: Large- vs.
small-cap stocks. Journal of International Money and Finance, 26(8), 1311–1337.
Jagannathan, Ravi, & Wang, Zhenyu. 1996. The Conditional CAPM and the
Cross-Section of Expected Returns. Journal of Finance, 51(1), 3–53.
Jinjarak, Yothin, Noy, Ilan, & Zheng, Huanhuan. 2013. Capital controls in Brazil
? Stemming a tide with a signal? Journal of Banking & Finance, 37(8), 2938–2952.
Kaminsky, Graciela, Lyons, Richard K., & Schmukler, Sergio L. 2004.
Man-agers, investors, and crises: mutual fund strategies in emerging markets. Journal of Inter-national Economics,64(1), 113–134.
Kilian, Lutz, et al. . 2013. Structural vector autoregressions. Chapters, 515–554.
Koedijk, Kees G., Kool, Clemens J. M., Schotman, Peter C., & van Dijk,
Mathijs A. 2002. The cost of capital in international financial markets: local or global?
Journal of International Money and Finance, 21(6), 905–929.
Kose, Ayhan, Rogoff, Kenneth, Prasad, Eswar S, & Wei, Shang-Jin. 2003
Kose, M. Ayhan, Prasad, Eswar S., & Terrones, Marco E. 2009. Does financial
globalization promote risk sharing? Journal of Development Economics, 89(2), 258–270.
Laeven, Luc. 2002. Does Financial Liberalization Reduce Financing Constraints? Finan-cial Management, 31(4).
Larrain, Mauricio, & Stumpner, Sebastian. 2017. Capital account liberalization and
aggregate productivity: The role of firm capital allocation. Journal of Finance.
Lau, Sie Ting, Ng, Lilian, & Zhang, Bohui. 2010. The world price of home bias.
Journal of Financial Economics, 97(2), 191–217.
Leuz, Christian, Lins, Karl V., & Warnock, Francis E.2009. Do Foreigners Invest
Less in Poorly Governed Firms? Review of Financial Studies, 22(8), 3245–3285.
Luetkepohl, Helmut. 2011. Vector Autoregressive Models. Tech. rept. European Univer-sity Institute.
NEFIN. 2016. Brazilian Center for Research in Financial Economics of the University of
Sao Paulo.
Patro, Dilip K., & Wald, John K.2005. Firm characteristics and the impact of emerging
market liberalizations. Journal of Banking & Finance,29(7), 1671–1695.
Petkova, Ralitsa, & Zhang, Lu. 2005. Is value riskier than growth? Journal of Financial Economics, 78(1), 187–202.
Ranciere, Romain, Tornell, Aaron, & Westermann, Frank. 2006. Decomposing
the effects of financial liberalization: Crises vs. growth. Journal of Banking & Finance,
30(12), 3331–3348.
Romer, David. 2012. Advanced macroeconomics. McGraw-Hill/Irwin,.
Singh, Ajit, & Weisse, Bruce A. 1998. Emerging stock markets, portfolio capital
Sloek, Torsten M, Edison, Hali J, Ricci, Luca A, & Levine, Ross. 2002 (Aug.).
International Financial Integration and Economic Growth. IMF Working Papers 02/145. International Monetary Fund.
Solnik, Bruno. 1983. International Arbitrage Pricing Theory. Journal of Finance, 38(2), 449–457.
Solnik, Bruno, & Zuo, Luo. 2012. A Global Equilibrium Asset Pricing Model with
Home Preference. Management Science, 58(2), 273–292.
Solnik, Bruno, & Zuo, Luo. 2016. Relative Optimism and the Home Bias Puzzle.Review of Finance.
Solnik, Bruno H.1974. An equilibrium model of the international capital market. Journal of Economic Theory, 8(4), 500–524.
Stiglitz, Joseph. 2000. Capital Market Liberalization, Economic Growth, and Instability.
World Development, 28(6), 1075–1086.
Stock, James H., & Watson, Mark W. 2001. Vector Autoregressions. Journal of Economic Perspectives,15(4), 101–115.
Stulz, Rene M. 1981. A model of international asset pricing. Journal of Financial Eco-nomics, 9(4), 383–406.
Stulz, Ren´e M. 1999. Globalization, Corporate Finance, And The Cost Of Capital.
Journal of Applied Corporate Finance, 12(3), 8–25.
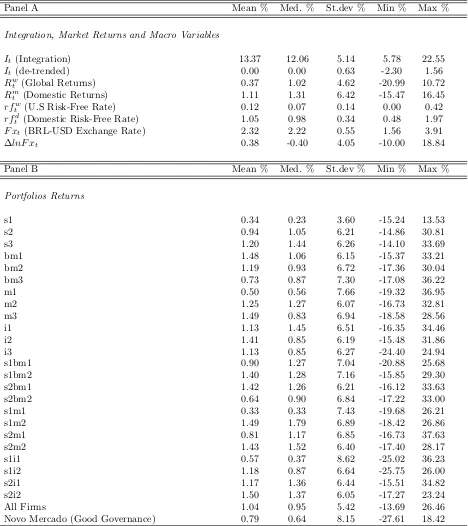
Table 1: Descriptive Statistics - Monthly (2001-2015)
This table presents descriptive statistics for the asset pricing dataset. Panel A presents data on stock market integration, calculated as the value of the portfolio held by foreign investors as a share of total market capitali-sation (It), global returns, proxied by returns on the MSCI World Index (Rwt), domestic market returns, proxied by returns on the MSCI Brazil index (Rm
t ), global interest rates, proxied by returns on the 3-months U.S T-bill (rftw), domestic interest rates, proxied by the Brazilian interbank rate (rftd) and the exchange rate between the Brazilian Real and the U.S Dollar (F xt). Panel B presents descriptive statistics for returns of stocks’ portfolios sorted by size (s1, s2, s3), book-to-market (bm1, bm2, bm3), momentum (m1, m2, m3) and illiquidity (i1, i2, i3); for portfolios double-sorted by size and book-to-market (s1bm1, s1bm2, s2bm1, s2bm2), size and momentum (s1m1, s1m2, s2m1, s2m2) and size and illiquidity (s1i1, s1i2, s2i1, s2i2); for the portfolio including all listed firms (All Firms) and the portfolio of firms adopting good governance practices (Novo Mercado).
Panel A Mean % Med. % St.dev % Min % Max %
Integration, Market Returns and Macro Variables
It(Integration) 13.37 12.06 5.14 5.78 22.55
It(de-trended) 0.00 0.00 0.63 -2.30 1.56
Rw
t (Global Returns) 0.37 1.02 4.62 -20.99 10.72
Rmt (Domestic Returns) 1.11 1.31 6.42 -15.47 16.45
rftw (U.S Risk-Free Rate) 0.12 0.07 0.14 0.00 0.42
rftd (Domestic Risk-Free Rate) 1.05 0.98 0.34 0.48 1.97
F xt(BRL-USD Exchange Rate) 2.32 2.22 0.55 1.56 3.91
∆lnF xt 0.38 -0.40 4.05 -10.00 18.84
Panel B Mean % Med. % St.dev % Min % Max %
Portfolios Returns
s1 0.34 0.23 3.60 -15.24 13.53
s2 0.94 1.05 6.21 -14.86 30.81
s3 1.20 1.44 6.26 -14.10 33.69
bm1 1.48 1.06 6.15 -15.37 33.21
bm2 1.19 0.93 6.72 -17.36 30.04
bm3 0.73 0.87 7.30 -17.08 36.22
m1 0.50 0.56 7.66 -19.32 36.95
m2 1.25 1.27 6.07 -16.73 32.81
m3 1.49 0.83 6.94 -18.58 28.56
i1 1.13 1.45 6.51 -16.35 34.46
i2 1.41 0.85 6.19 -15.48 31.86
i3 1.13 0.85 6.27 -24.40 24.94
s1bm1 0.90 1.27 7.04 -20.88 25.68
s1bm2 1.40 1.28 7.16 -15.85 29.30
s2bm1 1.42 1.26 6.21 -16.12 33.63
s2bm2 0.64 0.90 6.84 -17.22 33.00
s1m1 0.33 0.33 7.43 -19.68 26.21
s1m2 1.49 1.79 6.89 -18.42 26.86
s2m1 0.81 1.17 6.85 -16.73 37.63
s2m2 1.43 1.52 6.40 -17.40 28.17
s1i1 0.57 0.37 8.62 -25.02 36.23
s1i2 1.18 0.87 6.64 -25.75 26.00
s2i1 1.17 1.36 6.44 -15.51 34.82
s2i2 1.50 1.37 6.05 -17.27 23.24
Table 2: Stock Market Integration and Expected Returns
This table presents results of the estimation of an international asset pricing model as per the equationRit−rftw=αi+βi(Rtw−rftw) +δiIt−1+it. Portfolios are sorted by characteristics of size (s1, s2, s3), book-to-market (bm1, bm2, bm3), momentum (m1, m2, m3) and illiquidity (l1, l2, l3). Integration is calculated as the value of the portfolio held by foreign investors as a share of total market capitalisation. The equations are estimated via generalised method of moments (GMM), using heteroskedasticity and autocorrelation robust standard errors (HAC Bartlett-type errors). Models are estimated on a monthly basis, between 2001 and 2015, a time series of 180 consecutive months. In Panel A, model outputs are shown. In panel B, coefficients for the variable integration (It−1) are compared
across portfolios within each characteristic group (size, book-to-market, momentum and illiquidity), through aχ2test. The null hypothesis is that coefficients are
statistically equal to one another (H0 :δi=δj=...=δn). Statistically significant coefficients are labeled as: +p <0.10;∗p <0.05;∗ ∗p <0.01;∗ ∗ ∗p <0.001.
A (Models) s1 s2 s3 bm1 bm2 bm3 m1 m2 m3 l1 l2 l3
Rwt -rftw 0.516*** 0.598*** 0.591*** 0.447*** 0.700*** 0.643*** 0.893*** 0.557*** 0.458*** 0.636*** 0.467*** 0.375***
(0.037) (0.058) (0.062) (0.097) (0.056) (0.054) (0.079) (0.077) (0.067) (0.048) (0.091) (0.063)
It−1 -0.276* -1.357** -1.494** -1.294* -1.893*** -1.326** -1.872*** -1.500*** -1.430* -1.543** -1.035* -1.496*
(0.128) (0.516) (0.480) (0.538) (0.426) (0.512) (0.460) (0.398) (0.691) (0.538) (0.487) (0.662)
αi 0.001 0.007** 0.009*** 0.013*** 0.009*** 0.004 0.002 0.010** 0.013*** 0.009** 0.012*** 0.009***
(0.002) (0.002) (0.002) (0.002) (0.002) (0.004) (0.003) (0.003) (0.002) (0.003) (0.003) (0.002)
B (χ2Test) s1 s2 s3 bm1 bm2 bm3 m1 m2 m3 l1 l2 l3
Size
s1 1
s2 6.85* 1
s3 10.21** 1.82 1
Book-to-market
bm1 1
bm2 4.53* 1
bm3 0.01 7.12** 1
Momentum
m1 1
m2 6.74** 1
m3 1.69 0.04 1
Illiquidity
i1 1
i2 19.91*** 1
i3 0.05 3.39+ 1
Table 3: The Role of Corporate Governance
This table presents results of the estimation of an international asset pricing model as per the equationRit−rftw= αi+βi(Rwt −rftw) +δiIt−1+it. Models are estimated for the broad portfolio (All Firms) and for the Special Corporate Governance Portfolio (Novo Mercado). Integration is calculated as the value of the portfolio held by foreign investors as a share of total market capitalisation. The equations are estimated via generalised method of moments (GMM), using heteroskedasticity and autocorrelation robust standard errors (HAC Bartlett-type errors). Statistically significant coefficients are labeled as: +p <0.10;∗p <0.05;∗ ∗p <0.01;∗ ∗ ∗p <0.001.
All Firms (Broad Portfolio) Novo Mercado (Governance Portfolio)
Model
Rw
t -rftw 0.490*** 1.123***
(0.033) (0.038)
It−1 -1.071* -2.649***
(0.527) (0.305)
αi 0.008*** 0.004
(0.002) (0.007)
Integration Coefficient Comparison
Table 4: Currency Exposure
This table presents results of the estimation of an international asset pricing model as per the equationRit−rftw= αi+βi(Rtw−rftw)+δiIt−1+λi(Ct−rftw)+it. Models are estimated for the Investable portfolio (MSCI Brazil) and for the broad portfolio (All Firms). Integration is calculated as the value of the portfolio held by foreign investors as a share of total market capitalisation. An additional risk factor is included (Ct−rftw), capturing currency exposure. The equations are estimated via generalised method of moments (GMM), using heteroskedasticity and autocorrelation robust standard errors (HAC Bartlett-type errors). Statistically significant coefficients are labeled as: +p <0.10;∗p <0.05;∗ ∗p <0.01;∗ ∗ ∗p <0.001.
MSCI Brazil (Investable Portfolio) All Firms (Broad Portfolio)
Rw
t -rftw 0.839*** 0.669***
(0.041) (0.031)
It−1 -1.415*** -1.026***
(0.222) (0.260)
Ct-rftw 0.505*** 0.649***
(0.056) (0.094)
αi -0.006*** 0.001
Table 5: Stock Market Integration and Expected Returns - Double-sorted Portfolios
This table presents results of the estimation of an international asset pricing model as per the equationRit−rftw=αi+βi(Rtw−rftw) +δiIt−1+it. Portfolios are double-sorted by size and book-to-market (s1bm1, s1bm2, s2bm1, s2bm2), size and momentum (s1m1, s1m2, s2m1, s2m2) and size and illiquidity (s1i1, s1i2, s2i1, s2i2). Integration is calculated as the value of the portfolio held by foreign investors as a share of total market capitalisation. In Panel A, our baseline model is estimated. In Panel B, we run a robustness check by calculating portfolio’s returns in excess of the domestic risk-free rate (Rit -rftd) in replacement for global risk-free rates. The equations are estimated via generalised method of moments (GMM), using heteroskedasticity and autocorrelation robust standard errors (HAC Bartlett-type errors). Statistically significant coefficients are labeled as: +p <0.10;∗p <0.05;∗ ∗p <0.01;∗ ∗ ∗p <0.001.
A (Rit-rftw) s1bm1 s1bm2 s2bm1 s2bm2 s1m1 s1m2 s2m1 s2m2 s1i1 s1i2 s2i1 s2i2
Rw
t -rftw 0.790*** 0.683*** 0.539*** 0.614*** 0.905*** 0.630*** 0.683*** 0.483*** 0.931*** 0.600*** 0.613*** 0.170*
(0.089) (0.052) (0.075) (0.057) (0.090) (0.083) (0.121) (0.055) (0.116) (0.103) (0.048) (0.068)
It−1 -1.342+ -1.362* -1.492** -1.415** -2.246*** -0.850 -1.857*** -1.273* -2.558*** -1.363* -1.456** -1.127*
(0.747) (0.647) (0.507) (0.482) (0.391) (0.714) (0.419) (0.554) (0.459) (0.656) (0.551) (0.452)
αi 0.006* 0.011* 0.012*** 0.004+ -0.000 0.012** 0.005+ 0.012*** 0.002 0.009*** 0.009*** 0.013***
(0.002) (0.005) (0.001) (0.002) (0.003) (0.003) (0.005) (0.001) (0.002) (0.002) (0.002) (0.002)
B (Rit-rftd) s1bm1 s1bm2 s2bm1 s2bm2 s1m1 s1m2 s2m1 s2m2 s1i1 s1i2 s2i1 s2i2
Rw
t -rftw 0.796*** 0.688*** 0.544*** 0.619*** 0.910*** 0.635*** 0.688*** 0.488*** 0.936*** 0.605*** 0.618*** 0.175**
(0.087) (0.050) (0.072) (0.054) (0.087) (0.081) (0.119) (0.054) (0.114) (0.100) (0.046) (0.066)
It−1 -1.302+ -1.322* -1.452** -1.374** -2.206*** -0.810 -1.816*** -1.233* -2.518*** -1.323+ -1.415* -1.087*
(0.771) (0.668) (0.530) (0.499) (0.405) (0.737) (0.436) (0.577) (0.458) (0.679) (0.573) (0.475)
αi -0.003+ 0.002 0.002 -0.006*** -0.010** 0.003 -0.004+ 0.003+ -0.007+ -0.000 -0.000 0.004+
(0.001) (0.004) (0.001) (0.001) (0.002) (0.003) (0.002) (0.001) (0.003) (0.002) (0.002) (0.002)
Table 6: Granger Causality Tests (χ2) - Stock Market Integration and Domestic Market Returns
This table presents results of Granger-causality tests (χ2) between stock market integration (I
t), domestic market returns (Rm
t −rftw) and domestic interest rates (∆rftd). The Model is estimated on a monthly basis, between years 2001 and 2015, covering a time series of 180 consecutive months. Statistically significant coefficients are labeled as: +p <0.10;∗p <0.05;∗ ∗p <0.01;∗ ∗ ∗p <0.001.
lag order: t−1 Equations
Excluded Rmt −rftw It ∆rftd
Rmt −rftw 1 0.04 1.98
It 5.41* 1 0.00
∆rftd 1.43 0.07 1
ALL 6.42* 0.12 2.01
lag order: t−1, t−2 Equations
Excluded Rmt −rftw It ∆rftd
Rmt −rftw 1 0.04 2.94
It 5.94+ 1 0.07
∆rftd 2.60 0.17 1
ALL 7.75 0.20 3.02
lag order: t−1, ..., t−3 Equations
Excluded Rmt −rftw It ∆rftd
Rmt −rftw 1 0.51 3.06
It 6.35+ 1 0.59
∆rftd 5.03 0.42 1
Table 7: Descriptive Statistics - Quarterly Investment Data (2005-2015)
This table presents descriptive statistics for the corporate investment dataset (with all variables expressed both in levels and in first-differences, ∆). Panel A presents data for the Novo Mercado portfolio (firms adopting good governance practices), whereas Panel B presents data for the Ex- Novo Mercado portfolio (firms with less stringent governance quality). For both portfolios, descriptive statistics are shown for investment rates, calculated as capital expenditures divided by property, plant and equipment (IKt) and for growth opportunities, calculated as net revenues divided by property, plant and equipment (Y Kt). Panel C presents data on stock market integration, calculated as the value of the portfolio held by foreign investors as a share of Ibovespa Index’s market capitalisation (It), plus control variables: local interest rates, proxied by the Brazilian interbank rate (Rft), global interest rates, proxied by the U.S 3-months T-bill (Rftus), the exchange rate between the Brazilian Real and the U.S Dollar (F xt) and economic expectations, proxied by Brazilian Retail Sales Index (St).
Mean Med. St.dev Min Max
Panel A: Novo Mercado Portfolio
IKt % (Investment Rate) 5.75 5.33 1.79 2.85 10.37
∆IKt% -0.04 0.06 1.34 -3.78 2.51
Y Kt(Growth Opportunities) 1.23 1.20 0.20 0.87 1.72
∆Y Kt 0.05 -0.01 0.19 -0.53 0.62
Panel B: Ex Novo Mercado Portfolio
IKt % (Investment Rate) 3.52 3.04 1.29 1.70 7.15
∆IKt% -0.01 -0.00 0.09 -2.29 1.98
Y Kt(Growth Opportunities) 0.70 0.70 0.07 0.49 0.84
∆Y Kt 0.01 0.02 0.09 -0.20 0.16
Panel C: Integration and Exogenous Variables
It % (Integration) 20.07 20.71 4.75 12.18 27.02
∆It% 0.34 0.49 1.12 -3.97 2.39
Rft% (Local Interest Rate) 2.74 2.63 0.70 1.58 4.61
∆Rft% -0.02 -0.02 0.25 -0.51 0.42
Rfus
t % (International Interest Rate) 1.28 0.14 1.82 0.00 4.99
∆Rfus
t % -0.06 -0.01 0.40 -1.54 0.62
F xt(Exchange Rate) 2.14 2.06 0.48 1.58 3.87
∆F xt 0.02 -0.01 0.18 -0.25 0.68
St(Retail Sales Index) 91.65 93.8 18.75 61.20 116.10