A first simulation of soil-laser interaction investigation for soil
1characteristic analysis
23
Karen M. Donaldson, Xiu T. Yan 4
5
Department of Design, Manufacture and Engineering Management, 6
Space Mechatronic Systems Technology, 7
Faculty of Engineering, Glasgow, G1 1XJ, UK 8
9
Laser Induced Breakdown Spectroscopy (LIBS) is an important technique 10
utilised in several areas including that of agriculture and space exploration. 11
However, whilst LIBS provides a new way of analyzing chemical composition 12
of targeted soils or rocks, the quality and repeatability of the results are affected 13
by the terrain and soil conditions as a result of physical matrix effects which 14
occur due to varying properties like specific heat and thermal conductivity. 15
These physical and chemical matrix effects cause difficulties with quantitative 16
LIBS analysis. Together with this, the diverse areas in which LIBS is utilized 17
means that it can require varying conditions of ablation techniques. Therefore, it 18
is prudent to investigate theoretically the effect of different soil characteristics on 19
the ablation process. The work presented here is the first simulation based 20
research on soil quality analysis using LIBS. Aiming to gain insights into the soil 21
breakdown process, laser coupling, sample temperature and its sensing 22
performance through simulation of the laser ablation of soil using finite element 23
modelling software. The proposed model within COMSOL Multiphysics was 24
designed and developed to study the influence of multiple nanosecond (ns) laser 25
pulses on the surface of samples of soil with varying properties. The simulation 26
computational results were compared to those obtained from LIBS experiments 28
conducted for the Argibot project at the University of Strathclyde. 29
I. INTRODUCTION
32
Laser Induced Breakdown Spectroscopy (LIBS) is a technique based on the 33
emission spectroscopy of a material, which is caused by ablation of the sample 34
surface by heat from pulsed laser impact which creates a plasma plume. The 35
elemental composition is determined by the wavelengths and intensities of the 36
atomic emissions from the plasma. [Radziemski and Cremers, 2013; Anabitarte 37
et al., 2012; Hussain and Gondal, 2013]. Multiple LIBS analysis spots on a 38
single sample can provide information on individual elements contained within 39
the sample as well as providing a bulk composition. The LIBS technique is 40
sensitive to many key nutrients and elements in soil, and can allow for direct 41
observation of light elements such as H, C, N, O and B [Trevizan, 2008]. The 42
quick detection of soil nutrient elements is of great benefit for crop yield and 43
agricultural production [He, 2018]. The analysis of soil elements is also 44
important for forensic soil discrimination, for creating a profile for soil types 45
with locations to compare with databases [Jantzi and Almirall, 2011]. 46
One element of particular interest, as it is an essential element for plant growth, 47
is nitrogen [Sharma and Bali, 2018]. For this reason, the measurement of 48
nitrogen in soils is of specific interest in both agricultural and space science for 49
rich crop harvests and planetary habitation. 50
The advantage of using LIBS for elemental analysis is that the results are 51
available in real time, in-situ, and the measurements can be performed directly 52
on the sample surface without much, or any, sample preparation [Harmon et al 53
(a), 2005][Harmon et al (b), 2013]. The various areas in which LIBS can be 54
ablation techniques as the quality and repetition of the results can be affected by 56
the sample medium. 57
Due to its natural inhomogeneous characteristics soil, in particular, is a medium 58
that can produce varying and non-repeatable LIBS results. The application of 59
LIBS in agriculture is more challenging than other areas due to the complex 60
interactions between the sensors and samples. In agriculture the physical and 61
chemical characteristics of the samples can vary significantly in both space and 62
time. Thus, the parameters that are appropriate for other areas may not be 63
suitable for agricultural purpose [Peng, 2016]. Therefore, it is important to 64
investigate theoretically the effect of different soil characteristics on the ablation 65
process. The work presented here is the first simulation based research on soil 66
quality analysis using laser ablation, aiming to gain insights into the soil and 67
laser interaction through simulation of laser soil ablation using finite element 68
modelling software. 69
The work is part of a project at the University of Strathclyde named Agribot, 70
which is an autonomous ground rover platform for monitoring and intervention 71
tasks on modern farms and space exploration [Post et al., 2017]. Part of the 72
rover’s ability is to conduct soil analysis through a mounted portable LIBS 73
system. 74
For a typical LIBS system, nanosecond (ns) or femtosecond (fs) laser pulse 75
durations are used. The laser pulse length can dramatically change the physics of 76
the laser-induced plasma creation. Those from fs laser pulses and ns pulses can 77
differ considerably. The difference is due to how the laser pulse interacts with 78
the sample. A fs laser pulse interacts only with the electron subsystem, whilst ns 79
material, starting from solid, through to a plasma. These differences are observed, 81
also, in the area and shape of the ablation crater left on the samples surface 82
[Freeman, 2013]. 83
It has been recognised that short laser pulses and UV wavelengths largely 84
provide the best performance metrics concerning precision, accuracy and 85
sensitivity when laser sampling is coupled with inductively coupled plasma (ICP) 86
spectroscopy for quantitative analysis [Yang, 2009]. 87
The properties of LIBS plasmas and therefore sample analysis depend on the 88
operational parameters of the system, including; the nature of the laser pulse 89
such as the energy, duration, repetition rate, and number of laser shots [Hahn and 90
Omenetto, 2012]. The properties of the sample [Rauschenbach et al, 2008] and 91
the ambient atmosphere are also a factor. LIBS measurements are also sensitive 92
to environmental factors, such as the chemical and physical properties of the 93
sample and the homogeneity and ambient states of the sample. For example, the 94
air temperature and pressure. The particle size of the sample can also affect both 95
the LIBS measurements along with how the laser power interacts with the 96
sample [Gustinelli, 2015]. 97
To investigate parameters for achieving optimal results from the ablation process, 98
it is necessary to employ a simulation method that can effectively reflect the 99
absorption coefficient, conduction length and pulse energy for various types of 100
samples. 101
The present study simulates ns laser ablation using heat conduction theory in a 102
two-dimensional COMSOL model to investigate the interaction between the 103
laser pulse and various soil conditions. 104
105
II. LASER MACHINE INTERACTION
106
Ablation by intense laser pulses is widely used for ionization of samples. 107
However, the LIBS technique can have low sensitivity in trace elements 108
micro-analyses. The texture and surface of, in particular, a soil sample can have 110
a large effect on how much soil is ablated in the process. 111
Due to heat conduction, when a high intensity laser beam impacts the surface of 112
a material, the surface temperature quickly rises. This in turn causes the surface, 113
that has risen to the ablation temperature, to vaporize and create a plasma 114
containing molecules of various elements enclosed within the sample. The 115
temperature of the sample will rise and fall due to its heating and cooling before 116
and after a laser pulse respectively. 117
For ns lasers, much of the latter part of the energy pulse is used in heating the 118
plasma formed during the earlier part of the pulse through linear absorption. This 119
results in a large area of the sample being affected by the heat. Any plasma that 120
is formed is extremely ionized which causes continuum emission. Gated 121
detectors allow for a reduction in background noise and thus improvement the 122
signal-to-noise ratio while minimizing any spectral interferences between species. 123
Soil is naturally chemically and physically a complex matrix with differing 124
chemical compositions and physical properties [Jantzi and Almirall, 2011]. 125
Physical matrix effects, which are more complex and difficult to perfect than 126
chemical ones, occur during the ablation step of the LIBS process because of 127
material differences in such properties as the thermal conductivity, specific heat, 128
and latent heat of vaporization. Also, the characteristics of a sample such as grain 129
size, hardness, coherence, and moisture contents. There has been research 130
conducted by Carvalho et al to understand the influence of the particle size 131
distribution on the matrix effect in pellets of plant materials [Carvalho et al., 132
2017]. Other factors that produce any variability on the surface texture will affect 133
material, and therefore the performance of a LIBS system and the degree of 135
material ablation. The mass of material ablated is another matrix effect that can 136
change the signal intensity for a particular element between samples with the 137
same concentration [Hahn and Omenetto, 2012]. 138
Thus, these physical matrix effects make quantitative LIBS analysis much more 139
problematic. Research has been conducted by Bousquet et al for quantitative 140
LIBS on soil samples for clay and sand type soils which demonstrated that LIBS 141
signals for soil samples are strongly affected by the matrix effects [Bousquet et 142
al., 2007]. Currently, for quantitative LIBS it is important to have standards that 143
are very closely matrix matched to the type of samples being analyzed which 144
will allow for excellent accuracy and precision [Jantzi and Almirall, 2011]. 145
146
III SOIL HEAT TRANSFER PROPERTIES
147
The term ‘soil’, as used by engineers, refers to a complex material consisting of 148
solid particles of various compositions (mineral and/or organic) and of various 149
shapes and sizes that are randomly arranged with pore spaces between them. 150
Soils are composed of different ingredients for example sand and clay. Clayey 151
soils are heavy, high in nutrients, wet and cold in winter and baked dry in 152
summer and sandy soils are light, dry, warm, low in nutrients and often acidic. 153
The thermal conductivity of a soil is defined as the amount of heat passing in 154
unit time through a unit cross sectional area of the soil under a unit temperature 155
gradient applied in the direction of this heat flow. It must be assumed that the 156
sample of soil is much larger in comparison with a representative cell of a 157
homogenous soil. In order to create samples within the simulation that replicate 158
varying properties were investigated. The main properties that differentiated 160
them were the thermal conduction, porosity, specific heat, density and water 161
content. The texture and composition of a soil can vary due to several factors; 162
these main factors can be divided into three categories. 163
164
A. Moisture
165
The composition of naturally occurring soil varies continuously, mainly from the 166
continuously varying temperature field to which the soil is subject. These 167
changing temperature gradients alter the soil composition, particularly in the 168
amount, phase and condition of the water which in-turn leads to variations in the 169
thermal properties of the soil. Geomaterial thermal properties, such as thermal 170
conductivity, vary depending on the type of geomaterial used and the degree of 171
saturation. For soils, fine dry sand has low thermal conductivity values and silty 172
sandy gravel has high thermal conductivity values. The thermal conductivity for 173
these materials can range between 0.15 W/mK and 4.4 W/mK respectively. 174
175
B. Porosity
176
Porsity (void fraction) is a measure of the void spaces in a material, and is a 177
fraction of the volume of voids over the total volume. These values range 178
between 0 and 1, or as a percentage between 0 and 100%. The porosity of soils 179
can vary widely, for example the porosity of loose soils can be about n=50%, 180
whilst the porosity of compact soils is about n=30%. The value of the porosity 181
depends on grain size distribution; it follows that the higher the porosity value 182
the smoother the grain size distribution. 183
C. Grain size
185
The grain size distribution of a soil implies a certain pore size distribution which 186
determines the permeability of the soil. Expressed as the permeability, K, as a 187
function of the soil porosity n and its internal surface area per unit volume S is 188
given by the equation K = Dn(n/S)2 in which D is a constant, dependent on the
189
viscosity of the water. As the grain size decreases, the specific surface area 190
increases rapidly, leading to a substantial decrease in the permeability and an 191
increase in the number of capillaries per unit volume. 192
193
IV. AGRIBOT EXPERIMENTS
194
As previously mentioned these simulations were conducted in parallel with 195
experimental LIBS work for the Agribot project. The Agribot rover is adapted to 196
support a portable LIBS system. The system consists of a laser, a sample dish 197
within a chamber and spectrometers which are connected to a computer system 198
for data collecting and processing. The laser is a Nd:YAG operating at 1064 nm 199
with a beam diameter of 3 mm, and a repetition rate of 1 Hz, the pulse energy of 200
25mJ and a nominal pulse width of 4 ns. 201
The soil was collected from agricultural land in central Scotland from differing 202
locations around the field. The final samples prepared for the LIBS experiments 203
varied in grain size and porosity. Throughout the experiments variations in the 204
depth, width and shape of the ablation holes of the samples were noted. 205
The soil underwent several pre-treatment regimes to prepare for testing. Three 206
different soil samples were prepared. The field moist soil, initially, was baked at 207
40oC for two days to dry it and then passed through a 1mm sieve. Following
208
was pressed into a pellet, without the use of any binding agent, using a manual 210
laboratory press (P= 7 t) for 30 seconds. 211
It was observed that the different textures of soil samples ablated in a variety of 212
ways after 10 laser pulses, confirming how the physical matrix effect can cause 213
ablation craters to change in shape and dimensions. It was noted that there was 214
also a reduction in spectrum noise level with a decrease in particle size. 215
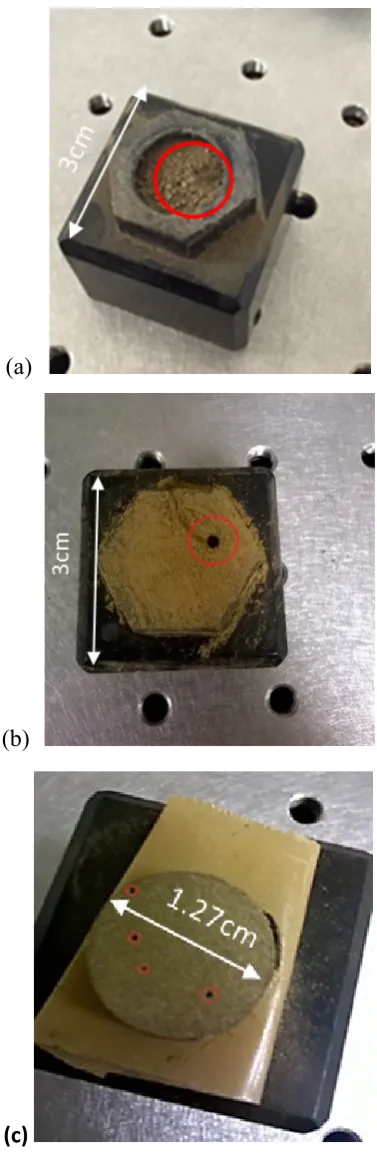
The laser pulse effect on the dried loose sample created a relatively large area of 216
depression compared to that of the milled, pelleted soil, Fig 1. There was an 217
observable area of depression after 10 laser pulses and the quality of the hole 218
was not high. Much of the soil around the ablation area had also been moved and 219
distorted. 220
The milled soil displayed an ablation hole that was significantly smaller than that 221
of the dried loose soil and there appeared to be no ridged edge, Fig. 1. In general, 222
it was found that an increase in particle size contributed to increases in the 223
diameter of the crater. There was also an increase in the abundance and size of 224
fractures forming off the ablated crater edge and hence, the edge smoothness of 225
the ablated crater was also found to be proportional to the particle size. 226
The elemental spectrum waveform obtained during the LIBS experiments, for 227
different soil samples, were observed for variations. As nitrogen is available in 228
different forms, the specific wavelength for the form of interest must be observed 229
in the spectral results for analysis. It has been found, from previous works, that 230
gaseous nitrogen can be resolved at several wavelengths between ~400 nm and 231
600 nm [Hanafi et al., 2000] and nitrogen species within soil matrix are resolved 232
In general, it was discovered that the intensities of nitrogen and other elements 234
varied shot to shot which introduced the need to average the results obtained 235
from several laser pulse shots onto the sample’s surface. This is due to the nature 236
of soil, as it is regularly inhomogeneous and contains pockets of elements in 237
varying quantities. 238
The spectrum obtained from the sample of dry loose soil was the most 239
susceptible to exhibiting this nature of large variations in the levels of nitrogen 240
gained between laser shots. There were improvements in the noise of the spectra 241
and the varying levels of element concentrations when the sample of the soil was 242
milled and pelletized. The spectrum noise and the variations in the levels of 243
nitrogen between pulses was less varied for milled soil. 244
245
V. SIMULATIONS
246
A. Model development
247
The dimensions and boundary for the soil samples are as described in Fig. 2 and 248
Fig. 3. As this research is a continuation from the Argibot analysis experiments 249
the simulations have been modelled to replicate the key properties of samples 250
used in the analytical experiments. 251
Whilst the modelled samples do not replicate the exact property values of the 252
field soil samples, they have been modelled to replicate the variations in porosity 253
and, for scientific comparison, dry density and moisture levels. In the present 254
study, the sample was simplified to a 2D rectangle to solve for the boundary of 255
the laser heated segment i.e. the area of the sample that is not irradiated can be 256
disregarded. Therefore, the modelled geometry is much smaller compared to that 257
of the ~3 mm2 soil sample used in the experiments, Fig 2.
It is possible from this 2D model to observe the varying depth and width of the 259
ablated areas caused by the interactions with the laser pulse for varying sample 260
specifications. 261
The properties of the laser are presented in Table 1, taken from the portable 262
LIBS system specifications. A laser beam of diameter 3 mm FWHM hits the 263
surface of the soil sample of width and thickness of 1 mm and 20 µm 264
respectively. The laser is modelled as a heat source with Gaussian distribution, 265
defined by the equation shown in Table 2. 266
The ablation is modelled as an ablative heat flux, the parameters set for the 267
ablation conditions are shown in Table 1. As the material is removed from 268
interaction with the laser pulse energy, a model of the material removal must be 269
applied. This is calculated through the value for the heat of sublimation to 270
calculate the ablation velocity i.e. the rate at which the material is removed, 271
Table 2. 272
273
B. Boundary conditions
274
Two types of physics solution, namely laser heat transfer and geometry 275
deformation are employed to simulate the mechanism of laser induced 276
breakdown. For each of these areas, appropriate boundary conditions have to be 277
specified before the problem can be solved. The boundary conditions for the 278
material are shown in Fig. 4, they are mapped such that the material removing 279
process can be resolved and the side and bottom boundaries of the sample are 280
assumed to be thermally insulated. Due to this, the convection effect is only 281
considered on the top surface. 282
C. Meshing conditions
284
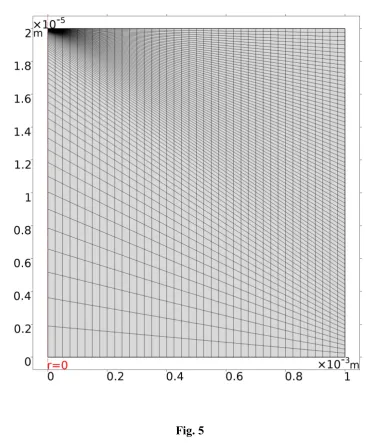
The heat generated from the laser source affects the surface of the sample as well 285
as the interior depending on the material absorption coefficient. The meshing 286
algorithm must be able to resolve this internal heat. A suitable resolved meshing 287
scale was calculated from the soil thermal diffusivity and the conduction length. 288
These parameters and corresponding equations are shown in Table 1 and Table 2 289
respectively. Thus, the simulated ablated area of the experimental sample is 290
solved with the affected area width 1 mm, height 20 µm. The finite element 291
distribution and the maximum mesh size must be small enough compared with 292
the size of the laser irradiation region to resolve the heat transfer conduction 293
length of the laser. 294
Due to the length of the laser pulse, the time resolution is in the order of ns and 295
the laser absorption area has a maximum element size in the magnitude of 0.1nm. 296
The mapping of the mesh sizing is illustrated in Fig. 5. 297
298
D. Simulation parameters
299
The laser parameters were taken from those of the, previously described, 300
portable LIBS system. In order to investigate the material removal in-between 301
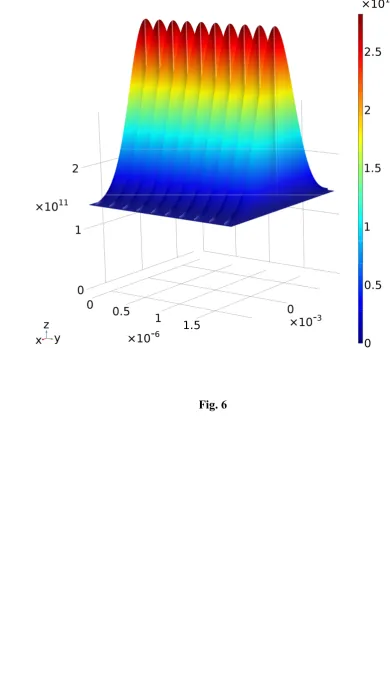
pulses a laser beam heat source was modelled with multiple laser pulses. In the 302
present work ten pulses over a total time duration of 2 µs (the first laser pulse 303
laser switches on at 0.1µs and remains on until 0.104 µs) were simulated, Fig. 6 304
illustrates the model of the simulated laser pulses. 305
The laser ablation is affected, and can be controlled by several process variables 306
namely laser pulse length and the soil texture i.e. grain size or moisture level. 307
were globally parameterized. These were for the shape and width of the pulse 309
and material parameters such as specific heat capacity and thermal conductivity. 310
Table 1 summarises the properties of the soil and the laser ablation parameters 311
used in the computational model. In total four soil samples were modelled to 312
replicate the characteristics of the experimental samples namely, dry loose fine 313
sandy soil (dry), wet loose fine loose soil (saturated), fine sandy milled and 314
compressed soil (pelleted) and lastly for comparison; soft grey clay soil. 315
316
E. Governing Equations
317
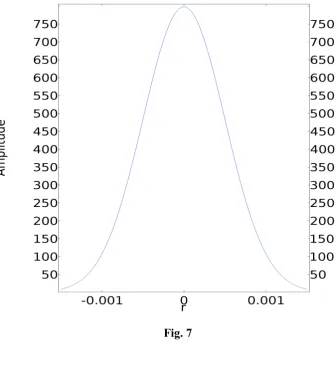
In the present model, the heat transfer in the sample is conjugate heat transfer. 318
As the heat in the sample is due to conduction then it can be described by 319
Fourier’s Law and as the sample analysis here is time dependent then we must 320
consider this. The heat source is distributed in time by a Gaussian distribution, 321
Fig. 7. 322
The governing equations associated with the boundaries employed in the heat 323
transfer model are also summarized in Table 2. 324
The addition of the deformed geometry function is used due to the changing 325
shape of the domain boundary caused by the laser ablation vaporising the surface 326
of the sample. The domain change is significant, so the deformed geometry 327
interface used was a hyperelastic smoothing type to deform the mesh. These 328
were, namely, controlled by the total heat flux experienced by the sample and the 329
ablation velocity associated with this. 330
VI. SIMULATION RESULTS
334
A. Laser pulse analysis
335
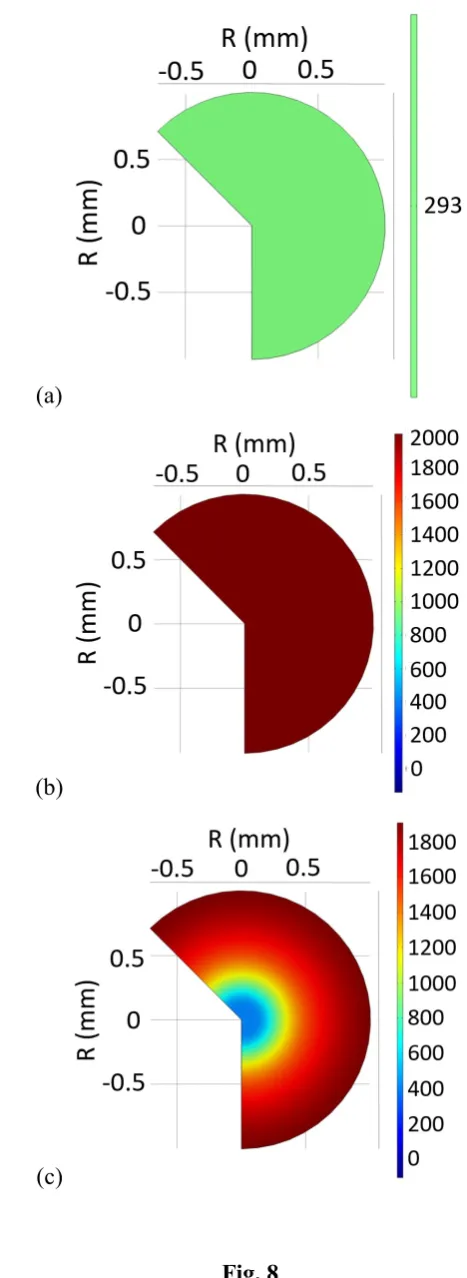
Illustrated in Fig. 8 is an example of the heating process effect on the soil sample 336
before, during and after one laser pulse. 337
It is seen that the laser pulse heats the entire surface of the modelled sample and 338
then cools from the middle to the edges. As the laser pulse hits the soil sample it 339
quickly transfers heat to whole surface. The area closest to the center sees a 340
temperature rise sufficient for ablation and the material is removed. It is seen that 341
in the centre of the pulse the laser power is at the highest and so the ablation and 342
material removal rate is the highest. Thus the material is removed faster than the 343
time it would take to conduct heat into the remaining sample. So when the laser 344
is in the OFF state the remaining material is not at as high temperature as directly 345
below the laser beam. 346
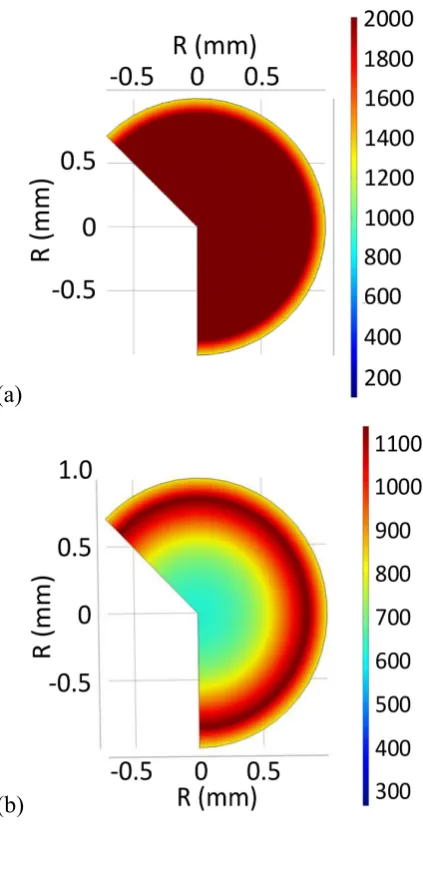
For sandy and sandy-clay samples the thermal conductivity and diffusivity 347
increase with the increase of moisture content. This property is evident in Fig. 9 348
where the difference in surface temperature is seen 3 ns after one laser pulse, for 349
the dry loose soil sample and clay soil sample. In the case where samples may 350
change in dry density, this increase in dry density will cause an increase in the 351
thermal conductivity. 352
B. Temperature
353
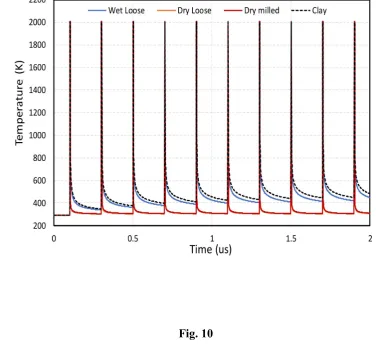
When the material temperature exceeds the ablation temperature it is assumed 354
that the material evaporates and elements contained within the sample are 355
removed. Fig. 10 shows the temperature distribution for all the soil samples after 356
each laser pulse. As silicates account for the largest percentage of the 357
average value for heat of sublimation for the various silicates (along with some 359
organic materials) which should well represent the soil. 360
In comparison to ablation temperature, the maximum temperature after each 361
pulse is ~2000 K which would suggest that there is ablation of the material after 362
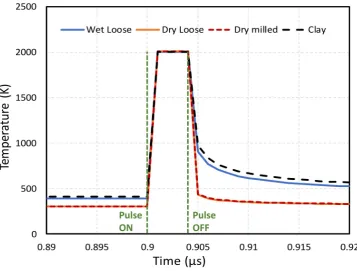
each pulse. To compare, in more detail, the surface temperature for each soil 363
sample one pulse was analysed as shown in Fig. 11. 364
The temperature gradients illustrated in Fig. 10 and Fig. 11 illustrates a steep 365
change in temperature due to the rapid increase and decrease of the surface 366
temperature as the material experiences higher heating and cooling rates during 367
the laser ablation process. 368
It was observed that the temperature gradients change for each soil sample, Fig. 369
11. There have been various correlations made between the thermal conductivity 370
of soils and their density or porosity. An increase in the dry density of a soil, 371
leads to an increase in its thermal conductivity. This occurs as an increase in dry 372
density will mean there is more solid matter per unit soil volume and less pore 373
air/water per unit soil volume which allows for better heat transfer across the 374
contacts. This behaviour is exhibited by the dry milled soil; it can be seen that 375
the temperature reduces much quicker than the other soil samples. 376
In the instance of clay minerals, they have a thermal conductivity around four 377
times higher than of that of water. Sandy soils often contain quartz which has a 378
thermal conductivity about 15 times higher than water, which means that they 379
are expected to show a greater rate of increase in thermal conductivity with dry 380
density than clay soils. This is illustrated in the simulation when the rise and fall 381
When the soil is saturated, but not frozen, the increase in dry density means 383
that the solid fraction replaces some of the water pores. In this situation, for an 384
increase in thermal conductivity the soil must have a higher thermal conductivity 385
than the water it replaces. 386
387
C. Ablation effects on sample surface
388
The optical emission spectroscopy of the plasma that is produced by the laser-389
matter interaction is the fundamental basis of LIBS. Hence, the efficiency of the 390
analytical performance is related to the laser-matter interaction. 391
Using the simulation model described previously, a parameter study of the 392
ablation process was performed. The ablation of the soil sample is affected and 393
controlled by several variables and therefore changes in the samples can affect 394
the efficiency of the ablation process. 395
Due to the Gaussian energy distribution the laser energy, and ultimately the 396
sample temperature, is highest at the centre of the beam, reducing towards the 397
edges of the pulse which creates an ablation area that has greater depth than 398
width [Gaudiuso et al., 2010]. Furthermore, the depth of the ablation area 399
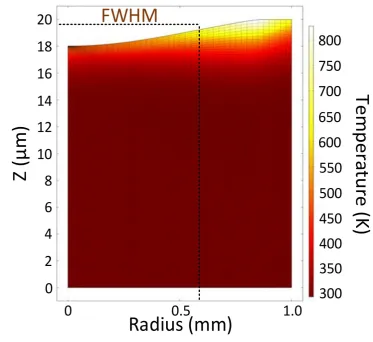
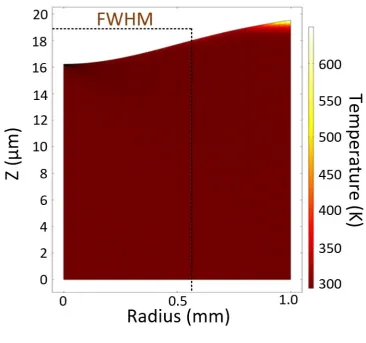
increases with each additional laser pulse. Fig. 12 and Fig. 13 illustrate the 400
differences in ablation shape for two different types of samples. 401
In general, it can be seen that the sample of clay has ablated less than dry milled 402
fine soil. The change in gradient of the surface topology of the fine sandy clay 403
sample, Fig 12, is more distinctive than that of the dry milled sample, Fig 13. 404
Considering the, initial, sample height was 20 µm it is possible to analyse how 405
clay soil sample surface depletes from an initial 20 µm to 18 µm whilst the dry 407
milled sample depletes to a final height of ~16 µm. 408
The density of the samples will affect the total volume of material ablated and 409
therefore the area of depression left behind, Fig. 14 illustrates this. 410
Referring to Fig. 14, as seen in the experimental results, the area of material 411
removed for the dry loose sample was greater than the milled sample. As 412
previously explained, due to the quartz content in sandy soils they should 413
demonstrate a greater rate of increase in thermal conductivity than clay soils. 414
A point evaluation was introduced to examine how the height of the pellet 415
changed with after each laser pulse. The point of evaluation is illustrated in Fig. 416
15, denoted by the red dot. Referring to Fig. 15, it is seen that as time progresses, 417
i.e. as more laser pulses are fired onto the sample surface, the dry loose sandy 418
soil decreases in height much more quickly than the others, especially to that of 419
the clay sample and the sample with added moisture. 420
It was noted that all the samples initially ablated at a similar rate until, 421
approximately, after three pulses of laser energy when they begin to ablate at 422
their own, different, rates. The sample that changed the most, and at the quickest 423
rate, was that of the dry, loose soil. This behaviour was exhibited in the 424
experiments. Referring to Fig 1, the dry loose soil in the sample container left the 425
largest diameter of depletion compared to that of the dry milled soil, this 426
behaviour is also exhibited in Fig 15. It was observed that a reduction in particle 427
size was related to a decrease in the diameter of the ablation crater 428
Finally, Fig. 16 illustrates the volume of material removed after ten shots of laser 429
energy. This is inclusive of the total volume of material removed from the 430
has on the ablation process of the sample is obvious by comparing the volume 432
difference of the wet and dry loose soil. 433
434
VII. Discussions and Conclusions
435
Work here presented is aimed to investigate and report the effect a ns NG:YAG 436
laser, by analysis of ablation area and surface temperature, has on varying 437
samples of soil. 438
A novel computational model using COMSOLTM Multiphysics was proposed
439
and developed to understand the influence of multiple laser pulses on the surface 440
of sample of soil for various soil characteristics. The investigation was based on 441
the assumption that the process occurs due to the material evaporation by heating 442
of ns laser pulses. The software is used to simulate this material removal during 443
the laser ablation process. 444
This research provides simulation details, a brief review and insight into soil-445
laser interactions, for coupling and ablation, for various soil types and soil 446
properties. Details as such are significant knowledge as the physical matrix 447
effect can be considered a crucial aspect for quantitative LIBS analysis [Capitelli 448
et al., 2002]. 449
Referring to the LIBS experimental findings, in general, it was found that an 450
increase in particle size contributed to increases in the diameter of the crater. 451
Additionally, it was found that there was a correlation between the sample type, 452
thus ablation, to the obtained experimental results primarily in the spectral noise 453
level. The simulation results exhibited ablation crater characteristics comparable 454
to that of previous LIBS experimental results. This work can help to predict laser 455
interacts with the soil samples. As discussed in the introduction, the work of 457
Gabriel Gustinelli et al. and Ines Rauschenbach et al. show there is a relation 458
between moisture, particle size of the sample which can affect both the LIBS 459
measurements and how the laser power interacts with the sample. This work 460
illustrates the interaction of the laser to the sample for possible explanation to the 461
experiments conducted in these papers and those similar. The modelled samples 462
of the wet loose soil illustrated the effect that moisture can have on the ablation 463
of a sample during laser induced breakdown. The differences between the wet 464
and dry soil samples, due to their differing water contents, is evident by the 465
volume of the ablation creator and temperature dissipation after the laser pulse 466
train impact. 467
These results are important when considering LIBS for different terrains whether 468
they be dry/saturated or with/without void. The model can also be adapted for 469
other laser specifications and samples. Simulation results such as these can be 470
used to predict, or verify, the effectiveness of the ablation process (quantity of 471
material removed) on various terrains and therefore the quality of the LIBS 472
analysis. This is applicable in both agricultural circumstance where terrain can 473
be water logged and clay-like or towards dry and sandy or in space exploration 474
[Knight et al., 2000] where, for example, Mars can vary between fine sediment 475
or large rocky terrains [Lazic et al., 2007]. This work can go towards providing 476
further research to understanding of the physical matrix effects of, in particular, 477
soil towards improved and repeatable LIBS spectrum and data for quantitative 478
analysis. It is also possible to create soil type profile databases for referencing 479
This research can be utilised in more wide-ranging areas such as to help 481
understand how soil heat flux is affected by porosity and moisture content. Such 482
information is important in agricultural systems and matters relating to climatic 483
changes [Castell et al., 1999; Han et al., 2013; Kondo and Saigusa, 1994; Sauer, 484
2005]. 485
486
Acknowledgement
487
This work was supported by the UK Space Agency. The authors would also like 488
to thank COMSOL for their help and advice. 489
Figure list
491 492
Fig. 1 Soil samples from experimental LIBS analysis for (a) dried and sieved soil, 493
(b) milled to <100 µm soil and (c) milled & pelleted soil. 494
495
Fig. 2 Schematic of the soil sample pellet illustrating selected area for COMSOL 496
modelled laser ablation. 497
498
Fig. 3 Schematic of the soil sample pellet, illustrating dimensions of selected 499
area for COMSOL model. 500
501
Fig. 4 Modelling for simulation, illustrating the boundary conditions. 502
503
Fig. 5 Meshing condition for the sample model, illustrating refined meshing to 504
resolve area around ablation required for accurate simulated heat conduction. 505
506
Fig. 6 Modelled laser pulses. 507
508
Fig. 7 Gaussian distribution of laser intensity from the surface. 509
510
Fig. 8 Illustration of effect of the laser pulses on the surface temperature of the 511
sample (a) before any pulse impact (0 µs), (b) during pulse heating (0.101 µs) 512
and (c) during cool down (pulse off - 0.105 µs). 513
Fig. 9 Illustration of effect of the laser pulse on the surface temperature of (a) 515
sample of dry loose and (b) sample of clay at same time point (0.107 µs) 516
517
Fig. 10 Sample temperature with each pulse of the laser for all soil samples 518
recorded at the center of the sample. 519
520
Fig. 11 Example of sample temperature after five pulses of the laser for all soil 521
samples, illustrating when the pulse is on and off. 522
523
Fig. 12 Effect of the ablation process on a sample of clay. Illustrating the volume 524
of soil that has been removed. 525
526
Fig. 13 Effect of the ablation process on a sample of fine sandy dry milled and 527
compressed soil. Illustrating the volume of soil that has been removed. 528
529
Fig. 14 Shape and size of ablation sites for soil sample after ten pulses. 530
531
Fig. 15 Change in height of soil sample due to ablation after each laser pulse. 532
533
Fig. 16 Volume difference of each soil sample after ten pulses. 534
(a) 540
(b) 541
(c) 542
[image:24.595.206.395.68.650.2]543 544
Fig. 1
547 548 549
Fig. 2
567 568 569
Fig. 3
581 582 583 584
Fig. 4
587 588
[image:28.595.110.479.113.557.2]589 590
Fig. 5
593 594
Fig. 6
605
[image:30.595.122.459.97.485.2]606
Fig. 7
(a) 615
(b) 616
(c) 617
[image:31.595.175.409.66.706.2]618
Fig. 8
(a) 622
(b) 623
[image:32.595.195.407.68.510.2]624
Fig. 9
634 635 636
Fig. 10
650 651 652
Fig. 11
666 667
[image:35.595.110.484.129.471.2]668 669
Fig. 12
672 673
Fig. 13
681 682
Fig. 14
688 689
Fig. 15
699 700
Fig. 16
Tables
715
TABLE 1 716
SIMULATION PARAMETERS 717
Property Nomenclature Values
Simulation properties
Resolved length scale [m] Lcond 4.33 x10⁻⁸
Resolved time [s] tstep 2 x10-11
Ambient temperature [K] Tamb 293
Mesh resolution (surface) [m] hmax 8.66 x10 -9
Maximum simulation time [s] Tmax 2 x 10 -6
Laser properties
Raw beam diameter [m] 2*rspot 0.003
Nominal output [mJ] Elaser 25
Maximum repetition rate [Hz] flaser 1
Nominal pulse width [ns] 4
Peak power at 1064nm [MW] Plaser ~2
Emission Wavelength [nm] λlaser 1064
Laser ablation properties
Number of laser pulses 10
Time between pulses [µs] 0.196
Pulse width [ns] 4
S.D Gaussian laser beam (gp) rspot/3 0.001
Ablation temperature [K] Tablate 2000
Sample properties
Initial sample temperature [K] Tsoil / Text 293
* Soil – dry & loose
Density [kg/m3] ρ
soil 1600
Moisture content [%] Wsoil 0
Porosity [%] ε 46
Thermal conductivity [W/mK] ksoil 0.15
Specific heat capacity [J/kg K] Cpsoil 800
* Soil – dry & compressed
Density [kg/m3] ρ
soil 1950
Moisture content [%] Wsoil 0
Porosity [%] ε 29
Thermal conductivity [W/mK] ksoil 0.15
Specific heat capacity [J/kg K] Cpsoil 800
* Soil – wet & loose
Density [kg/m3] ρ
Moisture content [%] Wsoil 24.6
Porosity [%] ε 39
Thermal conductivity [W/mK] ksoil 2.75
Specific heat capacity [J/kg K] Cpsoil 1632
* Soil – fine sandy clay
Density [kg/m3] ρ
soil 1067
Moisture content [%] Wsoil 54.6
Porosity [%] ε 37
Thermal conductivity [W/mK] ksoil 4.20
Specific heat capacity [J/kg K] Cpsoil 2646
718 719 720
TABLE 2
721
BOUNDARY CONDITION EQUATIONS
722
Boundary No. Boundary condition Equation
Whole geometry Heat transfer coefficient
General heat equation (where, Q is heat source)
Conduction length 2*sqrt(αcond*tstep)
Soil thermal diffusivity (αcond) ksoil/Cpsoil/ρsoil
Resolved length scale 6*sqrt(αcond*tmax)
Conduction length 2*sqrt(αcond*tstep)
1 Laser power (Gaussian
distribution (gp))
Plaser[kW/m2]*(gp(x)/800)*
pulse(t)
1,4 Ablation velocity ht.Plaser.q0/(ρsoil[kg/m3]*Hfs
[kJ/kg]) 2,3 Thermal insulation (where, n is
refractive index)
-n.q = 0
1 Heat flux (ht) -n.q = q0
1 Convective heat flux q0 = h (Text – T)
1 Heat transfer coefficient (ht) (T-Tablate)[1/K])
1 Diffusive surface -n.q = εσ(T4
amb-T4)
4 hmax Conduction length/5
1,2,3 Lcond 2*sqrt( αcond *tstep)
[image:41.595.80.503.380.695.2]References
728
Andrew Knight et al, “Characterization of Laser-Induced Breakdown 729
Spectroscopy (LIBS) for Application to Space Exploration”, Applied 730
Spectroscopy, Vol 54, No. 3, 2000. 731
732
Bruno Bousquet et al, “Towards quantitative laser-induced breakdown 733
spectroscopy analysis of soil samples”, Spectrochimica Acta Part B, 62, 1582-734
1589, 2007. 735
736
Gabriel Gustinelli Arantes de Carvalho et al, Influence of particle size
737
distribution on the analysis of pellets of plant materials by laser-induced
738
breakdown spectroscopy, Spectrochim. Acta Part B, 2015, 105, 130–135.
739 740
David Hahn and Nicolo. Omenetto. “Laser-Induced Breakdown Spectroscopy 741
(LIBS), Part II: Review of Instrumental and Methodological Approaches to 742
Material Analysis and Applications to Different Fields”, Applied Spectroscopy 743
Vol 66, No.4, 2012. 744
745
Fabio Castell et al, “Estimation of surface heat flux and an index of soil moisture 746
using adjoint-state surface energy balance”, Water resources research, 35, 10, 747
3115-3125, 1999. 748
749
Francesco Capitelli et al, “Determination of heavy metals in soils by Laser 750
Francisco Anabitarte et al. “Laser-Induced Breakdown Spectroscopy: 752
Fundamentals, Applications, and Challenges”, International Scholarly Research 753
Network ISRN Spectroscopy, Article ID 285240, 12 pages, 2012. 754
755
Gabriel. Gustinelli et al. “Influence of particle size distribution on the analysis of 756
pellets of plant materials by laser-induced breakdown spectroscopy”, 757
Spectrochimica Acta, Part B 105, 130–135, 2015. 758
759
Ines. Rauschenbach et al, “Laser induced breakdown spectroscopy on soils and 760
rocks: Influence of the sample temperature, moisture and roughness”, 761
Spectrochimica Acta, Part B 63, 1205–1215, 2008. 762
763
Jiangbo Han et al, “Dynamics of soil water evaporation during soil drying: 764
Laboratory experiment and numerical analysis”, Scientific World Journal, 2013. 765
766
Jiyu Peng, “Challenging applications for multi-element analysis by laser-induced 767
breakdown spectroscopy in agriculture: A Review”, Trends in Analytical 768
chemistry, 85, 260-272, 2016. 769
770
Junsei Kondo, Nobuko Saigusa, “Modelling the evaporation from bare soil with 771
a formula for vaporization in the soil pores”, Journal of the Meterological 772
Society of Japan, 72, 3, 1994. 773
Justin Freeman et al, “Comparison of optical emission from ns and femtosecond 775
laser produced plasma in atmosphere and vacuum conditions.” Spectrochimica 776
Acta Part B 87, 43–50, 2013. 777
778
Lakesh Sharma, Sukhwinder Bali, “A Review of Methods to Improve Nitrogen 779
Use Efficiency in Agriculture”, MDPI Sustainability, 10, 51, 2018. 780
781
Leon. Radziemski, David Cremers. “A brief history of laser-induced breakdown 782
spectroscopy: From the concept of atoms to LIBS 2012”, Spectrochimica Acta 783
Part B 87, 3–10, 2013. 784
785
Lilian Trevizan et al. “Evaluation of laser induced breakdown spectroscopy for 786
the determination of macronutrients in plant materials”, Spectrochimica Acta 787
Part B 63, 1151–1158, 2008. 788
789
Mark Post et al, “Autonomous Navigation with ROS for a Mobile Robot in 790
Agricultural Fields”, 14th International Conference on Informatics in Control, 791
Automation and Robotics (ICINCO), 2017. 792
793
Ningfang Yang. “Elemental Analysis of Soils Using Laser-Induced Breakdown 794
Spectroscopy (LIBS)”. The University of Tennessee, Knoxville. Master of 795
science thesis, August 2009. 796
797
Rosalba Gaudiuso et al, “Laser Induced Breakdown Spectroscopy for Elemental 798
Russell Harmon et al (a), “Laser-induced breakdown spectroscopy (LIBS) – an 800
emerging field-portable sensor technology for real-time, in-situ geochemical and 801
environmental analysis”, Geochemistry: Exploration, Environment, Analysis, 802
Vol. 5, pp. 21–28, 2005. 803
804
Russell Harmon et al (b) “Applications of laser-induced breakdown spectroscopy 805
for geochemical and environmental analysis: A comprehensive review”, 806
Spectrochimica Acta, Part B 87, 11–26, 2013. 807
808
Sarah Jantzi and Jose Almirall, “Characterization and forensic analysis of soil 809
samples using laser-induced breakdown spectroscopy (LIBS)”, Anal Bioanal 810
Chem, 400, 3341-3351, 2011. 811
812
Talib. Hussain and Mohammed Gondal. “Laser induced breakdown spectroscopy 813
(LIBS) as a rapid tool for material analysis”, 6th Vacuum and Surface Sciences 814
Conference of Asia and Australia (VASSCAA-6). Journal of Physics: 815
Conference Series 439, 012050, 2013. 816
817
Thomas Sauer, “Soil heat flux”, Nebraska, USDA-ARS/UNL Faculty, 2005. 818
819
Violeta Lazic et al, “Laser induced breakdown spectroscopy of soils, rocks and 820
ice at subzero temperatures in simulated martian conditions”, Spectrochimica 821
Acta, Part B 62, 1546 – 1556, 2007. 822
Yong He et al, “Quantitative Analysis of Nutrient Elements in Soil Using Single 824
and Double-Pulse Laser-Induced Breakdown Spectroscopy”, MDPI Sensors, 18, 825