City, University of London Institutional Repository
Citation
:
Zhao, Z., Dai, K., Camara, A. ORCID: 0000-0002-1675-2640, Bitsuamlak, G. and Sheng, C. (2019). Comparison of wind turbine tower failure modes under seismic and wind loads. Journal of Performance of Constructed Facilities, 33(2), doi: 10.1061/(ASCE)CF.1943-5509.0001279
This is the accepted version of the paper.
This version of the publication may differ from the final published
version.
Permanent repository link:
http://openaccess.city.ac.uk/id/eprint/21469/Link to published version
:
http://dx.doi.org/10.1061/(ASCE)CF.1943-5509.0001279Copyright and reuse:
City Research Online aims to make research
outputs of City, University of London available to a wider audience.
Copyright and Moral Rights remain with the author(s) and/or copyright
holders. URLs from City Research Online may be freely distributed and
linked to.
City Research Online: http://openaccess.city.ac.uk/ publications@city.ac.uk
Cite as: Zhao Z, Dai K, Camara A, Bitsuamlak G and Sheng C (2018). Wind turbine tower
failure modes under seismic and wind loads. Journal of Performance of Constructed Facilities (ASCE). Accepted, currently in press.
Comparison of Wind Turbine Tower Failure Modes
Under Seismic and Wind Loads
Zhao Z1, Dai K2, Camara A3, Bitsuamlak G4 and Sheng C1
1. State Key Laboratory of Disaster Reduction in Civil Engineering, Tongji University,
Shanghai, China.
2. Key Laboratory of Energy Engineering Safety and Disaster Mechanics, Ministry of
Education, Sichuan University, Chengdu, China.
3. School of Mathematics, Computing Science and Engineering, City, University of London,
London, UK.
4. Department of Civil and Environmental Engineering, University of Western Ontario,
Canada.
ABSTRACT
The main objective of this paper is to study the structural response and the failure modes of a
typical wind turbine tower under different strong ground motions and wind loading based on a
detailed finite element model of the tower. The ground motions were selected to match the design
response spectrum with different design characteristic periods (Tg) in order to explore the
influence of the frequency content of the earthquake on the response. The wind loads were
generated from tropical cyclone scenarios. Nonlinear dynamic time-history analyses were
conducted and the structural performance under wind load as well as short- and long-period
ground motions was compared. A modal pushover was applied to further clarify the failure related
to structural modes. It is observed that under strong wind loads the collapse of the wind turbine is
driven by the formation of a plastic hinge at its bottom part, which is attributed to the contribution
of the first (long-period) vibration modes of the structure activated by the wind loads. Under
earthquake excitations the bottom region is also critical in most cases but in some of them the
upper part of the tower triggers the collapse. The latter occurs because of the contribution of
high-order vibration modes in the earthquakes dominated by short periods, characteristic of rocky
ground conditions. In addition, it is found that long-period ground motions tend to magnify the
response of the structure in the elastic range and have associated a higher probability of failure for
extreme dynamic actions is strongly dependent on the relationship between the frequency content
of the excitation and the structural response.
Keywords: wind turbine tower, finite element modeling, nonlinear dynamic analysis,
pushover, structural failure, extreme wind load, earthquakes
1
Introduction
Wind energy is widely used nowadays as a renewable source. The worldwide wind capacity
has reached 486 GW by the end 2016, including 168.73GW wind capacity of China [1 WWEA].
The IEC 61400 [2 IEC] and GL Guideline [3 Lloyd] are generally adopted for design of wind
turbine (WT) towers. The technology behind the wind energy infrastructure was originally
developed in Northern Europe, in which the risk of extreme loading conditions such as tropical
cyclonic winds or strong earthquakes is moderate. As a result, general standards do not cover the
design of the WT under such extreme conditions in detail. However, the wide development of
wind energy around the world has led to wind farms that are located in earthquake- and
cyclone-prone regions. There is a significant number of reports on WT tower failures under
extreme typhoons in China’s southeast coastal area [4 Chen, 5 Ishihara]. Failures of WT towers
subject to ground motions are rarer but the risk should be carefully considered given the fact that it
affects the entire wind farm, where a considerable number of equally-designed and non-redundant
WT towers are subject to the same seismic actions.
WT tower under wind and seismic actions have been studied through experimental testing,
field investigations and numerical analysis. The experimental testing of the collapse of WT towers
under large dynamic excitations presents important difficulties. Few towers were tested to failure,
including the large scale experimental program on a decommissioned WT tower by Prowell [6
Prowell]. There are some scale issues involved in the experimental testing of WT towers in wind
tunnels as well. Field investigations of failure towers after disastrous events can provide forensic
information that is valuable from the practical point of view, but these are the final stage results of
extreme events for which the failure process is not described. Numerical simulation techniques
based on the nonlinear finite element (FE) analysis, if properly used, are capable of presenting the
progressive collapse of the structure under extreme loading.
Previous numerical studies on the topic are generally focused on either earthquake or strong
wind excitations. Regarding the seismic response of WT towers, Nuta et al. [7 Nuta] performed
incremental dynamic analysis (IDA) based on the FE method to obtain fragility curves. Afterwards,
Patil et al. [8 Patil] carried out detailed fragility analysis under near-fault and far-fault ground
loads. More recently, Sadowski et al. [10 Sadowski] compared the IDA results of a WT tower with
welding imperfections under near- and far-fault earthquakes. With regards to the FE analysis of
WT towers under extreme wind loads, Zhang et al. [11 Zhang] performed dynamic time-history
analysis under simulated typhoon wind velocity histories to illustrate the WT tower failure modes.
Dai et al. [12 Dai] conducted FE analysis of a typical 1.5 MW WT tower and observed different
failure stages in the wind-induced collapse for different wind directions. Although many studies
carried on nonlinear dynamic FE calculation, few of them specifically compared the tower failure
process under strong ground motions or wind actions.
This paper studies the nonlinear response of a typical WT tower, representative of many wind
farms in the world, under wind and seismic actions. The detailed FE model of the WT tower is
presented first, followed by the proposed seismic and wind excitations. Dynamic analysis and the
nonlinear static (Pushover) results of the WT response under wind and seismic loads are discussed
in detail to observe strong influences of the frequency contents of the structure and the lateral load
on the different collapse mechanisms.
2
Finite Element Model and Modal Analysis
2.1
FE modeling
A typical 1.5-MW three-bladed horizontal-axis WT tower constructed widely on the
southeast coast of China was chosen for this study. It was designed as Class Ⅱa in IEC 61400 [2
IEC 61400], without explicit considerations about its seismic performance. The tower is a
near-cylindrical steel hollow tube. The outer diameter ranges from 4035mm at the base to
2955mm at the top, with the shell thickness (t) varying from 25mm to 10mm, respectively. The
position of the hub is 64.65m above the foundation and this height is divided into 22 segments that
are welded together, as shown in Figure 1. The mass of the tower is about 91 tonnes and the rotor
diameter is approximately 70m. At the top, the mass of the blades and the nacelle is 30 tonnes and
60 tonnes, respectively. Generally, the WT is in parked condition under extreme conditions, which
are the only ones considered in this work. The fore-aft direction refers to the one that is
perpendicular to the rotor plane (X direction in the FE model) and the side-to-side direction is the
one parallel to the rotor plane (Z direction).
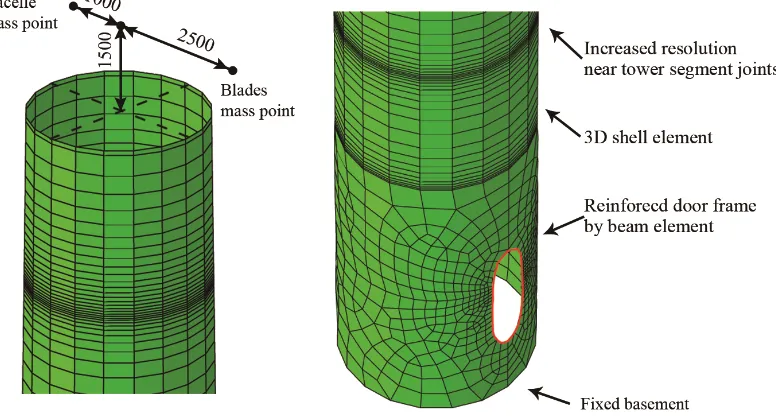
The tower model was built in ABAQUS 6.14-4 [13 ABAQUS], with the relevant details
shown in Figure 1. The tower wall was modelled by linear reduced-integration finite-strain S4R
3D shell elements, which are suitable for dynamic and static analyses. The mesh in each wall
segment mesh was modeled using a tetrahedral sweep grid technique with increased resolution
developed in these regions [10 Sadowski, 12 Dai]. The mesh at the bottom segment is relatively
irregular to model the geometrical discontinuity of the door, where the mesh is also refined as
shown in Figure 2. The foundation was considered completely rigid by constraining the
displacements and rotations at the bottom edge of the wall and, therefore, ignoring the
[image:5.595.137.442.165.512.2]soil-structure interaction (SSI).
Figure 1. Configurational details of the WT tower (units in mm). “t” represents the wall thickness.
The material in the wall is steel and it is modeled as an ideal elastic-plastic material with
post-yield strain hardening (0.1%). The steel type is S355 with a yield stress of 355MPa, a
Poisson’s ratio of 0.3, an elastic modulus of 200GPa and a density of 7850kg/m3. A simple
self-contact rule was employed to consider the contact between the wall shell of different
segments under large deformation. Current research works [14 Valamanesh] suggest that 1%
damping ratio is reasonable in a 1.5MW parked WT tower under earthquake actions. In this work,
the structural damping is introduced by means of a Rayleigh damping distribution in which the
first and the second vibration frequencies have 1% damping ratio. These two frequencies dominate
the structural response, as it will be demonstrated in this study.
Based on the engineering drawings of the WT tower, an elliptical cut in the tower wall was
beam elements according to the actual design. At the sections located 13m and 34m above
foundation, two stiffening flanges were included to increase the global bending stiffness. For
simplicity, these flanges are modelled by increasing the thickness of the corresponding shell
elements. The nacelle and the blades are simplified in the FE model as two lumped mass points
with kinematic coupling. The reason is to focus the attention on the structural performance of the
tower wall, which is where previous works have observed failure in these structures under extreme
[image:6.595.107.495.228.436.2]lateral loading. Figure 2 shows the details of the FE model.
Figure 2. Details of the FE model: (a) tower bottom; (b) tower top
2.2
Modal analysis
The first three vibration modes related to the global flexure of the WT tower are presented in
Figure 3 and Table 1. The vibration modes in the two horizontal directions (X and Z) are very
close to each other, as shown in Table 1. Only the modes associated with the deformation of the
wall in the X direction are shown in Figure 3. The cumulative effective mass of the first modes is
above 69.7%, which shows that the global dynamic response of the structure is dominated by the
first vibration modes. The accuracy of the FE model to represent these modes is supported by the
good agreement between the numerical results and those obtained in previous field dynamic
measurement of a real WT tower in China's southeast coastal area with the same dimensions [15
[image:6.595.88.508.691.756.2]Dai, 16 Dai].
Table 1. The first three global flexural vibration modes of the WT tower
Mode no. Direction Calculated
value [Hz]
Measured value
[Hz]
Relative error
[%]
Effective mass
ratio [%]
1 X 0.49 0.49 0 69.79
2 X 4.32 3.84 11.11 14.33
Z 4.42 4.08 7.69 14.53
3 X 12.02 - - 5.80
Z 12.84 - - 6.64
-1 -0.5 0 0.5 1
0 10 20 30 40 50 60 70
Normalized displacement
H
e
ig
h
t/
m
[image:7.595.89.510.67.443.2]1st mode 2nd mode 3rd mode
Figure 3. Modal shapes of the WT tower in the X direction
3
Dynamic excitations
3.1
Ground motion selection
Previous studies on the seismic response of WT towers classified earthquakes according to
the design spectrum [7 Nuta, 9 Asareh], fault distance and pulse-like effects [8 Patil, 10 Sadowski].
However, the dominant frequencies of the ground motions were not directly considered in the
selection process. WT towers usually have relatively low natural frequencies (around 0.5 Hz and
below, as shown in Table 1) and the objective of this work is to study how earthquakes with
different frequency content may lead to different structural response and failure modes. The
earthquake record selection was performed from the Pacific Earthquake Engineering Research
(PEER) database of strong ground motions [17 Ancheta PEER NGA-West2 Database] to match
the 5% damping design response spectrum given in the Chinese standard [18 GB 50011-2010].
The maximum spectral acceleration of this design response spectrum is 0.5 g, which was
proposed WT.
Two suites of ground motions with different site soil characteristic period (Tg) were selected.
This period is defined as the corner period that marks the transition at the response spectra
spectrum between the constant velocity and constant acceleration. It's worth noting that the shear
wave velocity was not a factor considered directly in the ground motion selection. A total of 20
ground motion records were selected, including 10 records with Tg=0.4s (corresponding to stiff
soil conditions and abbreviated as ST) and 10 records with Tg =1.1s (soft soil, referred to as LT).
Near-fault ground motions have distinct and potentially damaging characteristics such as
forward directivity, fling-step and hanging-wall effects [19 Yang]. Some of them show velocity
pulses for which WT towers may be vulnerable [8 Patil, 20 Stamatopoulos]. Therefore, all the
[image:8.595.88.510.668.765.2]ground motions considered in this work are near-fault, with a rupture distance below 20km
Table 2 lists all the selected ground motion records and Figure 4 presents the target response
acceleration spectrum and the spectra of each record in the two suits of ground motions. These
spectra were obtained as the square root of the sum of the squares (SRSS) of the two horizontal
components of each of the 10 ground motions in the set. Figure 4 also includes the mean spectrum
for each set, obtained as the arithmetic average of the 10 response spectra. The first two global
flexural periods of the WT tower are included in the figure. Although the fundamental mode has a
larger modal effective mass ratio than the second mode, as shown in Table 1, the associated
spectral acceleration of the second mode is much higher, and this suggests that the structural
response of the WT tower might be significantly influenced by the second mode as well. This will
be verified in the following.
The records are applied to the FE model of the WT as accelerations in the two horizontal
directions (X and Z). The vertical component was not considered based on the moderate influence
of the ground motion in this direction on the response of WT tower [10 Sadowski]. Each pair of
horizontal accelerograms in each earthquake is applied and the horizontal component of the
accelerogram with a higher PGA was input along the fore-aft direction, which coincides with the
position of the door opening. This is to maximize the potential damage in the tower. To reflect the
elasto-plastic performance of the WT tower, the PGAs of all the ground motions were scaled to
four levels: 0.1g, 1g, 2g and 3g.
Table 2. Ground motion records
No. Matching
Tg [s]
Earthquake name Year Station Vs30 [m·s-1] Scale factor
1 0.4 Imperial Valley-06 1979 El Centro Array #3 162.94 0.52
2 0.4 Chi-Chi 1999 TCU049 487.27 0.55
3 0.4 Imperial Valley-06 1979 Holtville Post Office 202.89 0.515
5 0.4 Darfield 2010 DSLC 295.74 0.535
6 0.4 Superstition Hills-02 1987 Brawley Airport 208.71 1.31
7 0.4 Imperial Valley-06 1979 Parachute Test Site 348.69 1.17
8 0.4 Chi-Chi 1999 TCU122 475.46 0.56
9 0.4 El Mayor-Cucapah 2010 Chihuahua 242.05 0.575
10 0.4 Iwate 2008 Mizusawaku Interior 413.04 0.515
11 1.1 Chi-Chi 1999 TCU065 305.85 0.355
12 1.1 Imperial Valley-06 1979 EC County Center FF 192.05 0.765
13 1.1 Darfield 2010 GDLC 344.02 0.325
14 1.1 Northridge-01 1994 Sylmar - Converter 251.24 0.29
15 1.1 Superstition Hills-02 1987 Parachute Test Site 348.69 0.44
16 1.1 Chi-Chi 1999 TCU120 459.34 0.8
17 1.1 Cape Mendocino 1992 Fortuna - Fortuna
Blvd 457.06
1.485
18 1.1 Duzce 1999 Lamont 1058 529.18 2.355
19 1.1 Darfield 2010 LRSC 295.74 2.055
20 1.1 El Mayor-Cucapah 2010 Cerro Prieto 242.05 0.605
0 1 2 3 4 5 6
0 0.2 0.4 0.6 0.8 1 S p e c tr a l a c c e le ra ti o n /g Period/s (a) Target RS Mean RS
0 1 2 3 4 5 6
0 0.2 0.4 0.6 0.8 1 S p e c tr a l a c c e le ra ti o n /g Period/s (b) Target RS Mean RS
Mode 1 Mode 1
[image:9.595.88.507.71.538.2]Mode 2 Mode 2
Figure 4. Ground motion acceleration response spectra and first two vibration periods of the structure.
(a) ST records, Tg=0.4s; (b) LT records, Tg=1.1s.
3.2
Wind load generation
The strong wind velocity field was simulated through the consistent discrete random flow
generation (CDRFG) method [21 Aboshosha]. This allows to generate wind velocity time-histories
at different points of the WT tower that are consistent with a target wind velocity power spectrum
whilst respecting the corresponding spatial and time correlations. Three levels of the mean wind
velocity at the hub level are considered in order to reach the nonlinear response and potentially the
based on the sum of harmonics, with a 0.2Hz frequency interval and lower and upper cut-off
frequencies of 0.01Hz and 10Hz, respectively. The duration of the generated signals is 600s and
the time interval is 0.1s. The rest of the parameters relevant to the simulation of the wind field are
listed in Table 3 and more details are included in [12 Dai]. A total of 3 independent wind velocity
fields (referred to as case 1, case 2, case 3) are generated for each of the 3 values of the mean wind
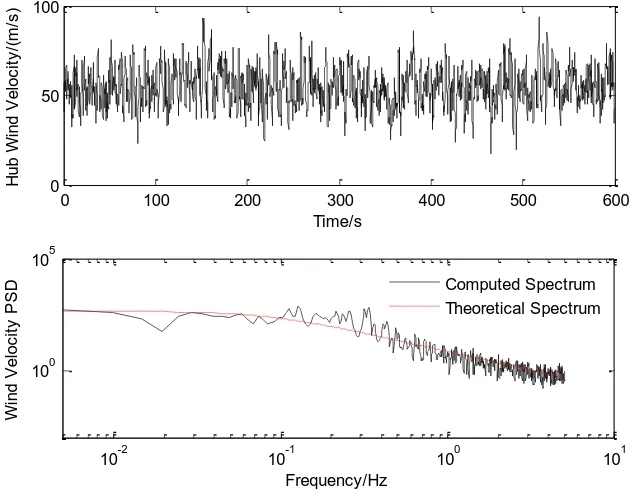
velocity in order to account for the record-to-record variability in the response. One wind velocity
time-history generated at the hub with Uref = 50m/s is presented in Figure 5, along with its power
[image:10.595.85.508.248.624.2]spectrum density (PSD) and the corresponding target.
Table 3. Parameters used in the wind load simulation
Parameter Used model Model parameter description and
value
Mean velocity profile U(z)=Uref (z/Zref ) η
z is the height
Power exponent η is 0.16 (rural area defined in [22 GB 50009-2012])
Hub height Zref is 65m
Hub mean velocity Uref is 50m/s,
55m/s, or 60m/s
Turbulence intensity
profile I(z)=Iref (z/Zref )
-d
Power exponent d is 0.18 [22 GB 50009-2012]
Hub height turbulence intensity Iref
is 0.16 (class A in [2 IEC 61400-3])
Turbulence length scale
profile Lu(z)= Lu (ref) (z/zref )
γ
Hub height turbulence length scale
Lu (ref) is 77m
Reference height zref is 10m
Power exponent γ is 0.3
Turbulence power spectrum
2 2 5/6
4( ( ) / ( ))
( )
(1 70.8( ( ) / ( ) )
u
u u
fL z U z
fS f
fL z U z
(Von Karman model)
2
u
is standard deviation of
fluctuating velocity
f is the frequency
Coherency function Coh(fm)=exp(-Cjfdxj /U(z))
Coherency decay constant Cj is 10
dxj is the distance between the
0 100 200 300 400 500 600 0
50 100
Time/s
H
u
b
W
in
d
V
e
lo
c
it
y
/(
m
/s
)
10-2 10-1 100 101
100 105
Frequency/Hz
W
in
d
V
e
lo
c
it
y
P
S
D Computed Spectrum
[image:11.595.134.450.96.341.2]Theoretical Spectrum
Figure 5. Wind velocity time-history and PSD at the hub in one of the records.
The Blade Element Momentum (BEM) theory [23 Hansen 2008] was used to obtain the wind
load on the blades. Each blade was discretized as 17 elements along its length. The lift and the
drag forces depended on the angle of attack can be obtained. Moreover, the thrust force in the
shaft and the tangential force induced by each blade elements are calculated. The total shaft thrust
and the tangential force are the summation of these element forces.
The wind load time-histories on the tower body and the nacelle are obtained as:
2
1/ 2
dF t
C
U
t A
(1)where the air density 𝜌 is 1.25 kg/m3; U(t) is the wind velocity time-history; C
d is the drag
coefficient, which is 1.2 for WT tower body or 1.3 for nacelle respectively; A is the projection
area.
In the event of extreme winds such as tropical cyclones, the WT is generally par ked and
the blades are in “feather” condition to reduce wind loading in the fore-aft direction. However, due
to the rapid changes in the wind direction that are characteristic in strong wind events, the inflow
wind may be parallel to the side-to-side direction (i.e., the Z direction in FE model) of the WT
tower, which was shown to be critical for the response of the WT [13 Dai, 24 Wang].
Consequently, the wind inflow in this work was considered to be in the side-to-side direction.
4
Time-history analysis
4.1
Structural elastic response
The study of the structural response starts with the analysis in the elastic range in order to
have a clear understanding of the participation of different vibration modes. An initial study
showed that the WT tower remained elastic under all the selected ground motions scaled to 0.1g
PGA, which is considered in this section. Time-history responses of the relative horizontal
displacement at the top of the tower (in which the ground displacement at the base was extracted
from the total displacement at the top) and the bending moment at the base were extracted from
the FE model. The time-history results in the two horizontal directions were combined for each
earthquake using the SRSS method, and the arithmetic mean, the root mean square (RMS) and the
[image:12.595.87.507.349.416.2]peak response for the ST and LT ground motions were obtained. These values are included in
Table 4.
Table 4. WT tower response with PGA of 0.1g.
Ground motion type Top displacement [m] Base moment [kN·m]
Mean RMS Maximum Mean RMS Maximum
ST 0.037 0.045 0.11 2441 3045 8188
LT 0.065 0.082 0.19 4338 5472 13119
Note: RMS denotes the root mean square value.
The results indicate that when the response of the WT tower is elastic, it is more vulnerable
to LT ground motions. This is explained by the higher spectral acceleration associated with the
fundamental vibration period (Sa(T1)) in LT earthquakes in comparison with ST records when the
PGAs are the same, as shown in Figure 4.
In addition, the acceleration recorded at the tower sections for which the modal displacement
in the first two vibration modes is maximum has been studied for two representative ST and LT
earthquakes, namely records No.4 and No.17 in Table 2, respectively. The two considered sections
correspond to the points A1 and A2 in Figure 1, at heights of 61.8m and 39.8m from the tower
base, respectively. The study of the acceleration at these sections is also under wind excitation.
WT with mean velocity of 50m/s at the hub height (case 1), for which it has been observed that the
structural response is also elastic. The two horizontal X and Z components of the acceleration
signals were processed to obtain their PSDs, which were then combined by the SRSS and then
normalized with respect to the peak value at the fundamental frequency. The normalized PSD
curves and the mode shapes of the first two vibration modes obtained in the FEM are included in
Figures 6 and 7 for the tower sections A1 and A2, respectively. Figure 6 shows that the response of
the important contribution of the second vibration mode (4.32-4.42 Hz) to the acceleration at the
intermediate section (A2) under seismic actions, especially considering the ST record, for which
the second mode dominates the response at this position in the tower. This is due to the relatively
large spectral acceleration associated with the second vibration mode for ST ground motions, in
comparison to that in the first mode (see Figure 4(a)), and the large participation (modal
displacement) of the second mode to the response at this part of the tower. The results also
confirm that the elastic response of the upper half of the WT tower can be captured with the first
two vibration modes. Regardless of the position of the considered section in the tower, under wind
loading the structure is always dominated by the fundamental mode. This is due to the low
frequency content of the wind load in comparison to the ground motion excitations, which is
closer to the fundamental frequency of the structure.
0 1 2 3 4 5 6 7 8 9 10 11 12 13 14 15 0
0.2 0.4 0.6 0.8 1
Frequency/Hz
N
o
rm
a
liz
e
d
P
S
D
[image:13.595.157.450.307.489.2]ST No.4 LT No.17 Wind load
Figure 6. Acceleration PSD at section A1 under earthquake or wind
0 1 2 3 4 5 6 7 8 9 10 11 12 13 14 15 0
2 4 6 8 10
Frequency/Hz
N
o
rm
a
liz
e
d
P
S
D
ST No.4 LT No.17 Wind load
[image:13.595.158.451.521.708.2]4.2
Representative failure modes under strong seismic actions or wind loads
A series of nonlinear dynamic FE analysis were conducted for the 20 seismic records under
three PGA levels (1g, 2g and 3g) and the 3 different wind velocity fields generated for the 3
intensity levels (50m/s, 55m/s and 60m/s). Four different failure modes were observed during the
analysis and these are presented in Figures 8-10 for a selection of representative ground motions
scaled to different PGA, and also in Figure 9 for one of the wind velocity records. Four stages
have been identified in the failure process: (1) initial plastic hinge formation; (2) plastic hinge
development; (3) full-section plastic hinge formation; (4) local buckling. The yielding contour
map of the tower for each stage is included in Figures 8-11 to illustrate the failure process.
It was observed from progressive failure of the WT tower under seismic or wind actions that
the plastic hinge is initiated at the base of the tower (failure stage 1). However, as the input
seismic energy increases the damage spreads towards the top of the tower, and the yielding of the
steel tends to be concentrated at the welding between the different rings composing the tower wall.
The collapse is eventually reached when a single section of the WT tower yields along its entire
perimeter, forming a full plastic hinge and the consequent mechanism of the part of the WT tower
above it. Under both load types, the tower usually collapses in a very short time once the
full-section plastic hinge occurs due to the low structural redundancy of the WT tower.
The position of the full plastic hinge WT was observed to occur at four different locations
under different strong ground motions. However, when the WT is subject to extreme wind loads
the failure is always concentrated at a single location that is positioned 8.8 m above the base of the
tower. Due to the variation of the failure location under different actions, the traditional damage
index based on the residual deformation considering the full tower height [7,9] is questionable in
the failure process. Therefore, we suggest a modified index to consider the effect of different
failure heights:
/ ( )
t t c
CDRD H H (2)
where CDR is the proposed collapse drift ratio; Dt is the displacement at the tower top; Ht is the
tower height; and Hc is the height of failure location. In all the cases the height is measured from
the base of the tower.
In addition, the Omega ratio proposed in [25 Camara et al. 2017] was calculated to study the
energy dissipated by plasticity at different locations of the tower during the analysis. The Omega
ratio is defined as the cumulative dissipated plastic energy divided by the total external work at the
instant of the analysis for which it is calculated, being both energies defined in the entire tower
wall. The evolution of the CDR and the Omega ratio for the whole tower during the analysis is
development of the plastic hinge (failure stage 2). Two characteristic values of the time-history
response are marked with vertical red dashed lines in these figures and these are later processed in
the failure mode statistics: (1) at the time-step in which the full-section plastic hinge is formed,
and (2) the time-step when the CDR reaches 0.1. It is observed that generally the lower the
position of the full plastic hinge the higher the plastic energy absorbed by hysteresis in the steel of
the wall and the larger the Omega ratio. Figure 8 shows that when the position of the plastic hinge
is relatively high, the capacity of the structure to absorb the seismic energy is limited and the
Omega ratios are 10% and 32% for the aforementioned time instants, respectively. This is
regarded as a brittle and undesirable response because the structure has a low capacity to dissipate
the seismic energy before the collapse occurs. The failure mode for the plastic hinge at the top of
the tower in Figure 8 is in clear contrast with that observed in Figure 9, in which up to 76% of the
seismic energy is absorbed before collapse by the plastic hinge at the bottom part of the tower
(located 5.9m above the base). This is attributed to the larger radius and thickness of the tower
wall sections close to the base, which renders a larger dissipation capacity.
0 2 4 6 8 10
0 0.05 0.1 0.15 0.2
Time/s
C
o
ll
a
p
se
d
ri
ft
r
a
ti
o
0 2 4 6 8 10
0 0.2 0.4 0.6 0.8
Time/s
O
m
e
g
a
r
a
ti
[image:15.595.100.491.379.569.2]o
0 20 40 60 80 100 0 0.05 0.1 0.15 0.2 Time/s C o ll a p se d ri ft r a ti o
0 20 40 60 80 100
[image:16.595.100.490.79.269.2]0 0.2 0.4 0.6 0.8 Time/s O m e g a r a ti o
Figure 9. Failure mode under 3g No.8 ST ground motion
0 5 10 15 20 25 30 35 0 0.05 0.1 0.15 0.2 Time/s C o ll a p se d ri ft r a ti o
[image:16.595.99.492.302.484.2]0 5 10 15 20 25 30 35 0 0.2 0.4 0.6 0.8 Time/s O m e g a r a ti o
Figure 10. Failure mode under 3g No.19 LT ground motion
0 10 20 30 40 50 60 70 0 0.05 0.1 0.15 0.2 Time/s C o ll a p se d ri ft r a ti o
0 10 20 30 40 50 60 70 0 0.2 0.4 0.6 0.8 Time/s O m e g a r a ti o
[image:16.595.102.492.520.702.2]4.3
Failure mode statistics
The tower failure locations for the nonlinear time-history seismic and wind analyses are
summarized in Tables 4 and 5, respectively. In few cases, represented with the symbol “*” in the
tables, the tower entered failure stages 1 and 2, but didn’t reached stage 3. The symbol “-”
indicates that the tower remained in elastic range for the entire analysis. The results show that the
LT ground motions are more prone to induce localized yielding (failure stages 1 and 2) and the
development of a full-section plastic hinge with buckling failure (failure stages 3 and 4), which is
on account of the higher spectral acceleration associated with the fundamental mode (Sa(T1)) in LT
ground motions as it was previously discussed.
All the local buckling failure cases gathered in Tables 4 and 5, and illustrated in Figures 8-11
for particular records, occur at locations in which the tower wall thickness changes, namely 5.9 m
above the base (9% of total height, thickness change from 25mm to 19mm), 8.8m (14% height,
thickness change from 19mm to 18mm), 25.4m (39% height, thickness change from 14mm to
13mm) and 39.9m (61% height, thickness change from 11mm to 10mm). The results indicate that
the change of thickness concentrate the stresses of the wall shell in bending under lateral dynamic
actions, and lead to the potential development of full plastic hinges.
The comparison of the Omega ratio for all the failure cases when the full-section plastic
hinge is initiated and when the CDR reaches 0.1 is shown in Figure 12. The axis of ordinates is the
failure locations under the extreme dynamic actions and axis of abscissas is the corresponding
Omega ratio. The results are consistent with those discussed in Section 4.2 with the exception of
the failure at 5.9m height. The mean Omega ratios at this location are lower than the cases of
failure locations at 8.8m and 25.4m, which may result from the fact that the change in thickness at
the 5.9m is so significant (6mm) that the tower wall tends to show less plastic dissipation before
collapsing. Comparing the highest failure location with other positions of the plastic hinge it is
confirmed that it provides the least plastic dissipation. This suggests the need for designs in which
the plastic hinge is developed as close as possible to the foundation (with the additional benefit of
easiness to repair after the damage) and the tower wall thickness change is as small as possible.
A summary of the position of the plastic hinges along the tower observed for the ST and LT
ground motions is illustrated in Figure 13. It can be seen that the tower collapse occurs usually at
sections that are located in the lower half of the tower for both types of earthquakes. Interestingly,
the tower failures at the middle-upper region (39.9 m) are more common (33%) in the ST ground
motions than in the LT ones (17%). Taking into account the larger Omega ratio when the plastic
hinge is closer to the base of the tower, this result suggests that the capacity of the wall to dissipate
tend to exhibit a more brittle response. In contrast with the seismic loading, the WT tower failed at
the same position of the tower under the 9 strong wind simulations. All six failure locations occur
8.8m above the tower base and exhibit a relatively large plastic dissipation. The reasons for the
variation in the failure position are further discussed in Section 4.4.
Table 4. Failure locations under 20 ground motions. (*) the tower entered failure stages 1 and 2, but didn’t reached failure stage 3. (-) the tower remains in elastic range during the analysis.
No.
ST ground motion
No.
LT ground motion
Failure height under 1g
PGA/m
Failure height under 2g
PGA/m
Failure height under 3g
PGA/m
Failure height under 1g
PGA/m
Failure height under 2g
PGA/m
Failure height under 3g
PGA/m
1 - 5.9 5.9 11 * 25.4 25.4
2 - * 5.9 12 - 5.9 5.9
3 - 39.9 39.9 13 * 8.8 39.9
4 - 5.9 5.9 14 - 8.8 8.8
5 - * 25.4 15 8.8 25.4 39.9
6 - * 5.9 16 8.8 5.9 25.4
7 - - 39.9 17 8.8 39.9 5.9
8 * 25.4 5.9 18 - 8.8 25.4
9 * 25.4 39.9 19 - 25.4 25.4
[image:18.595.92.508.187.515.2]10 - * 39.9 20 8.8 25.4 39.9
Table 5. Failure locations under strong winds
Case Failure height under 50m/s
hub mean velocity
Failure height under 55m/s hub mean velocity
Failure height under 60m/s hub mean velocity
1 - 8.8 8.8
2 - 8.8 8.8
0 0.2 0.4 0.6 0.8 1 0 5 10 15 20 25 30 35 40 45 50 Omega ratio Fa ilu re h e ig h t/ m (a)
[image:19.595.97.504.78.331.2]0 0.2 0.4 0.6 0.8 1 0 5 10 15 20 25 30 35 40 45 50 Omega ratio Fa ilu re h e ig h t/ m (b) ST LT Wind Mean ST LT Wind Mean
Figure 12. Omega ratio obtained when: (a) the full-section plastic hing is initiated ; (b) the CRD =
0.1 47% 20% 33% (a) 17% 33% 33% 17% (b) 5.9m 8.8m 25.4m 39.9m
Figure 13. Failure height distribution: (a) ST ground motions; (b) LT ground motions
4.4
Pushover analysis
The tower failure difference under different loads is attributed to structural mode
participation under loads with different frequency contents. In order to explore this effect further,
static non-linear static (pushover) analyses were conducted.
Most previous the pushover analysis WT towers considered exclusively the contribution of
the fundamental mode to obtain the load pattern [8 Patil] or directly applied a single point load or
displacement at the top [9 Asareh, 26 Guo]. However, the contribution of higher-order modes can
be important in the seismic response depending on the frequency content of the excitation.
Therefore, a modal pushover analysis based on the inertia forces associated with the first two
[image:19.595.166.430.372.537.2]obtained as:
i i i
F m (3)
where mi and ϕi are the mass and the modal displacement in the ith-element.
In addition to the modal pushover performed to explore the seismic response of the WT, the
mean wind load pushover was performed to study the failure location under the mean wind load.
The mean wind velocity and the approach to obtain wind loads from velocity were described in
Section 3.2. The load patterns of pushover analysis and mean wind load pushover are shown in
Figure 13. The large concentration of the applied load at the top of the tower in the pushover
analysis and wind static analyses is due to the mass and the exposed wind surface of the blades
and the nacelle, respectively.
0 0.5 1
0 10 20 30 40 50 60 70 To w e r h e ig h t/ m
Normalized load pattern (a)
-0.50 0 0.5 1 10 20 30 40 50 60 70 To w e r h e ig h t/ m
Normalized load pattern (b)
0 0.5 1
0 10 20 30 40 50 60 70 To w e r h e ig h t/ m
[image:20.595.96.504.291.553.2]Normalized load pattern (c)
Figure 13. Load pattern in the pushover analysis and the static wind analysis: (a) 1st mode
pushover; (b)2nd mode pushover; (c) mean wind load pushover
The load patterns in the nonlinear static analyses were increased progressively until the
failure of the WT tower, which is illustrated in Figure 14. Considering the first and the second
mode load patterns, the structure fails at the cross sections that are located 8.8m and 42.8m above
the ground, respectively. It is clear that the failure location of the tower moves upward under the
second mode load pattern. This effect can only be captured if the contribution of the second modes
than the fundamental one and the load distribution along the entire height of the tower is
introduced in the pushover analysis. The results of the pushover analysis are consistent with the
mode and tend to shift the failure location upwards in the tower. Under the effect of mean wind
load, the WT tower collapses due to the formation of a plastic hinge at the bottom part of the
tower (5.9m from the base), which is due to the similarity of this load pattern and that associated
with the first vibration mode. The result is also consistent with the position of the plastic hinge in
[image:21.595.99.469.170.416.2]the wind dynamic analyses.
Figure 14. Failure of the WT under the load patterns associated with the first two modes and the mean wind load pushover (the Von Mises stress is included in the contour plots, with units in
MPa)
4.5
Discussion
Figure 15 compares the PSDs normalized with respect to the peak value at the fundamental
frequency of three typical ground motion records (ST No.3, LT No.14, LT No.19) for which three
different failure locations are observed and the same normalized PSD of a wind load time-history
(Uref=55m/s, case 1). It can be observed that the frequency content of the earthquakes is
characterized by the significant contribution of a broad range of high-order frequencies, which
results in more high-order mode contributions. On the other hand, the wind action tends to be
dominated by lower frequencies that are in the region of the fundamental mode and significantly
0.2 0.49 1 4.32 5 10-3
10-2 10-1 100
Frequency/Hz
N
o
rm
a
liz
e
d
P
S
D
Ground motion record No.3 Ground motion record No.14 Ground motion record No.19 Wind load (U
ref = 50m/s,case 1) Mode 2
[image:22.595.102.491.88.300.2]Mode 1
Figure 15. Normalized PSD of different ground motions histories and a wind record
Combined with the failure location observed in of the pushover analysis, the frequency
content of the lateral actions on the tower is clearly connected to its collapse mode. Indeed, the LT
ground motion record time-history No.14 is clearly dominated by low-range frequencies in
comparison to the others, and it has been observed that the failure in the tower occurs at its bottom
part. However, the ST record No.3 has a significant contribution of frequencies close to the 2nd
mode and this leads to the brittle failure at the middle-upper region of the tower (Figure 8). The
LT record No.19 has a medium-range frequency content compared with the other two records and
the failure occurs at the middle-low region of the tower (Figure 10). Considering the whole set of
ground motions and wind velocity fields, the statistical analysis presented in Section 4.3 showed
that ST ground motions maximize the participation of the second vibration mode (Figures 4(a) and
15) and tend to shift upwards the failure position of the tower (Figure 7). This is normally
associated with a relatively low dissipation capacity and a fast development of the full plastic
hinge (only 0.5 s from initiation to CDR = 0.1 in Figure 8) and collapse in comparison with the
more ductile failures with hinge locations at the bottom part of the tower (25 and 10s from damage
initiation to CDR = 0.1 in Figures 9 and 11), which are typical of LT ground motions and extreme
wind actions.
It should be mentioned that despite the trends observed above, not all the ST or LT ground
motions lead to failure locations at the upper or bottom parts of the tower, respectively. This is due
to the record-to-record variability in the acceleration spectrum, although the ground motions were
selected to match the target response spectra. Even the same ground motion may change the
failure location that it induces when scaled to increasing PGA levels, for which acceleration peaks
change the overall response of the tower.
5
Conclusions
A typical WT tower under extreme loads was studied in this paper based on a detailed FE
model of the steel tubular wall with shell elements. Two suites of ground motions with different
frequency content features were selected and a series of wind velocity time histories were
generated. A total of 89 nonlinear dynamic analyses were performed and additional nonlinear
static (pushover) analysis were conducted to obtain the following findings:
(1) The elastic response of the WT tower in elastic range tends to be larger under earthquakes
that are dominated by long vibration periods (LT), in comparison to those with a shorter period
(ST) frequency content. This is due to the contribution of the fundamental mode of the structure to
the response.
(2) Under lateral loads, the initiation of the yielding always occurs at the bottom part of the
tower due to the bending stresses in the wall. As the loading increases, yielding concentrates in the
welding connections between different rings in the tower, where the thickness of the wall changes.
Once the entire perimeter of one section yields a full plastic hinge is developed and the tower
collapses due to its low structural redundancy. However, the position of the full-section plastic
hinge depends on the frequency content of the excitation.
(3) Pushover analyses can provide with useful information about potential plastic hinge
locations. Load patterns associated with relevant higher-order vibration modes and not only the
fundamental one should be considered in order to capture dangerous failure modes that are located
at the middle and at the top regions of the tower.
(4) Due to the participation of the fundamental mode and mean wind load distribution, wind
actions always induce the failure at the bottom half of the tower. This is also the case in most of
the LT ground motions considered because of the large spectral acceleration in the frequency band
close to the fundamental mode. However, ST earthquakes are more likely to trigger failures at the
middle or the upper part of the tower owing to the influence of the second vibration mode.
(5) Even if the accelerograms are selected to match the same target spectrum, there are
significant differences in the seismic response of the WT tower and the collapse mode that it
exhibits for different earthquakes. This is due to the record-to-record variability of their
acceleration spectra.
(6) From the design point of view, failure locations at the lower part of the tower are
recommended because in this region the tower sections are larger and have more capacity to
damage and the final collapse. Special attention should be paid to WT farms in regions where the
seismic risk is dominated by ST motions for which the contribution of high-order modes is more
relevant and failure may occur at the middle or top areas of the tower, in which the smaller tubular
sections have a reduced dissipation capacity and the plastic hinge fully develops soon after
yielding starts. This type of response is deemed to be more unfavorable.
References
[1] WWEA. World wind market has reached 486 GW from where 54 GW has been installed last year. http://www.wwindea.org/11961-2/.
[2] IEC 61400-1. Wind turbines – Part 1: design requirements.
[3] Germanischer Lloyd. Guidelines for certification of offshore wind turbines. Germanischer Lloyd, Hamburg, Germany.
[4] Chen X, Li C F, Xu J Z. Failure investigation on a coastal wind farm damaged by super typhoon: A forensic engineering study. Journal of Wind Engineering and Industrial Aerodynamics, 2015, 147, 132-142.
[5] Ishihara T, Yamaguchi A, Takahara K, et al. An analysis of damaged wind turbines by typhoon Maemi in 2003. The sixth Asia-Pacific Conference on Wind Engineering. Seoul
Korea, September 12-14, 2015.
[6] Prowell I, Veletzos M, Elgamal A, et al. Experimental and Numerical Seismic Response of a 65 kW Wind turbine. Journal of Earthquake Engineering, 2009, 13, 1172-1190.
[7] Nuta E, Christopoulos C, Packer J A. Methodology for seismic risk assessment for tubular steel Wind turbine towers: application to Canadian seismic environment. Canadian Journal of
Civil Engineering, 2011, 38: 293-304.
[8] Patil A, Jung S, Kwon O-S. Strutural performance of a parked Wind turbine tower subjected to strong ground motions. Engineering Structures, 2016, 120: 92-102.
[9] Asareh M A, Schonberg W, Volz J. Fragility analysis of a 5-MW NREL Wind turbine considering aero-elastic and seismic interaction using finite element method. Finite Elements
in Analysis and Design, 2016, 120: 57-67.
[10] Sadowski A J, Camara A, Málaga-Chuquitaype C, et al. Seismic analysis of a tall metal Wind turbine support tower with realistic geometric imperfections. Earthquake Engineering &
Structural Dynamics, 2017, 46: 201-219.
[11] Zhang Z H, Li J H, Zhuge P. Failure analysis of large-scale wind power structure under
simulated typhoon, Mathematical Problems in Engineering, 2014, 2014: 1-10.
[12] Dai K S, Sheng C, Zhao Z, et al. Nonlinear response history analysis and collapse mode study of a Wind turbine tower subjected to tropical cyclonic winds. Wind and Structures,
2017, 1(25): 79-100.
[13] ABAQUS. ABAQUS Version 6.14-4 Commercial Finite Element Software. Dassault
Systèmes, Simulia Corporation, Providence: RI, USA, 2014.
[14] Valamanesh V, Myers, A T. Aerodynamic damping and seismic response of horizontal axis Wind turbine towers. Journal of Structural Engineering, 2014, 140(11): 04014090.
[16] Dai K S, Wang Y, Huang Y C, et al. Development of a modified stochastic subspace
identification method for vibration based structural health monitoring of in service utility scale wind turbine towers. Wind Energy, 2017, 20: 1687–1710.
[17] Ancheta T D, Darragh R B, Stewart J P, et al. PEER NGA-West2 Database. Pacific Earthquake Engineering Research Center.
[18] GB 50011-2010. Standard for seismic design of buildings. (in Chinese)
[19] Yang D X, Wang W. Nonlocal period parameters of frequency content characterization for near-fault ground motions. Earthquake Engineering & Structural Dynamics, 2012, 41:
1793-1811.
[20] Stamatopoulos G N. Response of a Wind turbine subjected to near-fault excitation and comparison with the Greek Aseismic Standard provisions. Soil Dynamics and Earthquake
Engineering, 2013, 46: 77-84.
[21] Aboshosha H, Elshaer A. Bitusamlak G T, et al. Consistent inflow turbulence generator for
LES evaluation of wind-induced responses for tall buildings. Journal of Wind Engineering and Industrial Aerodynamics, 2015, 142: 198-216.
[22] GB 50009-2012. Load code for the design of building structures. (in Chinese) [23] Hansen, M O L. Aerodynamics of Wind turbines, 3ndEd., Earthscan, London, UK.
[24] Wang Z Y, Zhao Y, Li F Q, et al. Extreme dynamic responses of mw-level Wind turbine tower
in the strong typhoon considering wind-rain loads. Mathematical Problems in Engineering, 2013, 2013: 1-13.
[25] Camara, A., Cristantielli, R., Astiz, M.A. and Málaga-Chuquitaype, C. (2017). Design of hysteretic dampers with optimal ductility for the transverse seismic control of cable-stayed bridges. Earthquake Engineering and Structural Dynamics, 46(11), pp. 1811–1833.