and Public Health
Review
An Integrative, Systematic Review Exploring the
Research, Effectiveness, Adoption, Implementation,
and Maintenance of Interventions to Reduce
Sedentary Behaviour in Office Workers
Bradley MacDonald *, Xanne Janssen , Alison Kirk, Mhairi Patience and Ann-Marie Gibson
School of Psychological Sciences and Health, University of Strathclyde, 16 Richmond Street, Glasgow G1 1XQ, UK; [email protected] (X.J.); [email protected] (A.K.); [email protected] (M.P.); [email protected] (A.-M.G.)
* Correspondence: [email protected]
Received: 2 November 2018; Accepted: 27 November 2018; Published: 15 December 2018
Abstract:Sedentary behaviour is associated with poor health outcomes, and office-based workers are at significant health risk, as they accumulate large proportions of their overall sitting time at work. The aim of this integrated systematic review was to collate and synthesize published research on sedentary behaviour interventions in the workplace that have reported on at least one an aspect of the reach, effectiveness, adoption, implementation, and maintenance (RE-AIM) framework. Studies were included if they involved adult office workers, were conducted in an office setting, and changes in sedentary behaviour had been measured as a primary outcome. Five electronic databases were searched yielding 7234 articles, with 75 articles (61 individual interventions) meeting the inclusion criteria. Reach indicators were the most frequently reported RE-AIM dimensions, which were reported on average 59% of the time. Efficacy/effectiveness was the second most reported dimension at 49% reporting across all of the indicators. Implementation indicators were reported an average of 44% of the time, with indicators of adoption and maintenance reported as the lowest of all indicators at 13% and 8%, respectively. Recommendations are provided to improve reporting across all RE-AIM dimensions, which is an important first step to enable the effective translation of interventions into real world settings.
Keywords: sitting time; sedentary; occupational; office workers; RE-AIM; translation; evaluation; review
1. Introduction
Sedentary behaviour (SB), or sitting time, is associated with an increased risk of chronic diseases, such as metabolic syndrome, cardiovascular disease, and diabetes mellitus, in addition to increased all-cause mortality in adults [1–3]. Despite the health risk, representative samples indicate that the prevalence of sedentary behaviour is high in Western adults (between 6.8 and 11.2 h/day) [4–6]. Research suggests that office-based workers are at significant health risk, as they accumulate large proportions of their overall sitting time at work [7–9]. The global prevalence of occupational sitting will likely continue to rise as the labour market continues to shift towards computerised employment [10]. Consequently, the United Kingdom has developed guidance for employers in order to promote the avoidance of prolonged periods of sedentary work [11].
There has been an increase in interventions targeting sedentary office workers [12–15], and a number of reviews of the intervention work have followed [16–19]. The majority of these reviews have provided an evaluation of these interventions in relation to indicators of “efficacy” [16–19]. However,
potential for successful translation and future real-world implementation [20]. Critics argue that other indicators that facilitate an understanding of generalisability and translation are equally important to evaluate, particularly if these additional indicators impact the success of future implementation, and consequently the potential public health impact of a given intervention [20,21].
The RE-AIM evaluation framework is one of several existing methods used to evaluate or report on the additional indicators that could influence the future external validity of an intervention. Glasgow et al. (1999) [22] proposed five dimensions in which these indicators sit—reach,
efficacy/effectiveness,adoption,implementation,and maintenance. Reach is defined as the absolute number, proportion, and representativeness of individuals who are willing to participate in a given initiative. Efficacy/effectiveness refers to the impact of an intervention on the relevant outcomes, including potential adverse effects, quality of life, and economic outcomes. Adoption, within RE-AIM, is the absolute number, proportion, and representativeness of the settings and intervention agents who are willing to initiate a program. Implementation refers to the intervention agents’ (e.g., research teams) fidelity to the various elements of an intervention’s protocol. This includes consistency of delivery as intended, and the time and cost of the intervention. The maintenance dimension is concerned with both the setting and individual level. At the setting level, maintenance is the extent to which a program or policy becomes institutionalised or part of organisational practices and policies. At the individual level, maintenance has been defined as the long-term effects of a program on outcomes from six months onwards from the most recent contact [22,23].
Glasgow et al. (2004) [23] further explains that evaluating interventions over the five dimensions of the RE-AIM framework will help to facilitate an understanding of the potential external validity and public health impact of an intervention. This type of reporting is critically important as we move on a continuum from understanding an intervention effect produced under controlled conditions, towards implementation under real world conditions [21]. To date, no systematic reviews on sedentary behaviour interventions in office workers have been conducted using the RE-AIM framework. Therefore, the aim of the current study is to conduct a systematic review of sedentary behaviour interventions in the workplace focusing on the RE-AIM dimensions (reach, effectiveness, adoption, implementation, and maintenance). The review aims to gain an understanding of the proportion of RE-AIM indicators that are reported in the literature so as to identify whether gaps in reporting exist, which indicators are underreported, and which existing methods may be useful in collecting data on underreported indicators.
2. Methods
In order to capture published literature reporting on any dimension of the RE-AIM framework, an integrative, systematic review approach was used. The integrative methodology is specifically designed to facilitate the inclusion of a broad range of research designs, both qualitative and quantitative, so as to comprehensively understand a given phenomenon [24].
2.1. Search Strategy
Table 1.Inclusion and exclusion criteria and search terms based on PICOS (population, intervention type, and comparator, outcomes of interest, and setting).
PICOS Table Inclusion Criteria Exclusion Criteria Search Terms
Participants/Population Adult office workers
Children, non-working adults, workers outside of office setting, older adults
Office staff, worksite, work *, employ *, staff, adults, white collar
Intervention
All interventions targeting SB in the workplace experimental and quasi-experimental designs, natural experiment and qualitative
Systematic reviews, meta-analysis, commentaries, conference proceedings, methodology studies, validation studies, lab-based studies
Pragmatic evaluation, process evaluation, program evaluation, feasibility, pilot, health promotion, health program, program *, trial, program theory, theory of change, logic model, health behaviour change, intervention, sitting desk, sitting workstation, cycle * workstation, treadmill desk, treadmill workstation *, active * workstation *, active * permissive workstation *, sitting workstation *, seated workstation *, height adjusted workstation *, hot desk, sit-stand desk
Comparator
All comparison or self-comparison (pre-post design, natural experiment)
Outcome SB measured & RE-AIM checklist elements
SB (sedentary, sedentary behave *, sedentary time, active *, sitting, sitting time, sitting behave *, screen time, screen based, chair based, deskbound, physical inactive *, inactive lifestyle, lack of activity) & RE-AIM-(Validity, external validity, internal validity, behaviour change, policy change, community change, participation, quality of life, reach, influence, effect *, success, usefulness, efficacy, adoption, acceptance, maintenance, preservation, acceptability, rate, appraise, analyses, implement, deliver *)
Setting Office setting
SB—sedentary behaviour; *—truncation symbol; RE-AIM: reach, efficacy/effectivness, adoption, intervention, maintenance.
2.2. Screening Process
Figure 1. Flow diagram of studies included in the review. RE-AIM—reach, effectiveness, adoption, implementation, and maintenance.
2.3. Data Extraction
The data was extracted using a combination of two validated RE-AIM coding sheets [23,25–27]. The combination of the two sheets facilitated in the coding of information across all five dimensions of the RE-AIM framework, looking at 28 individual indicators from each intervention. The alignment of these indicators to each dimension of the RE-AIM framework is noted below.
2.3.1. Reach
The items from the extraction tool that facilitated in reporting on the potential reach of an intervention included the following: the method used to identify the target population, inclusion criteria and exclusion criteria, use of qualitative methods to understand reach or recruitment, sample size, participation rate, and sample representatives. The participation rate was calculated based on the reported number of participants, divided by the number of eligible participants exposed to recruitment. The sample representativeness information was extracted if an intervention reported the demographics of both the participants and eligible non-participants.
Figure 1.Flow diagram of studies included in the review. RE-AIM—reach, effectiveness, adoption, implementation, and maintenance.
2.3. Data Extraction
The data was extracted using a combination of two validated RE-AIM coding sheets [23,25–27]. The combination of the two sheets facilitated in the coding of information across all five dimensions of the RE-AIM framework, looking at 28 individual indicators from each intervention. The alignment of these indicators to each dimension of the RE-AIM framework is noted below.
2.3.1. Reach
2.3.2. Efficacy/Effectiveness
The efficacy and effectiveness items included the following: assessment of the effect on outcomes at shortest assessment point, imputation procedures reported, the presence of quality of life measure, effects at longest follow-up, use of qualitative methods to understand outcomes, and percent attrition or dropout rate. If the attrition rate was not directly reported, it was calculated based on the participant numbers at randomization, as compared to the participant numbers at shortest assessment point.
2.3.3. Adoption
The items that were extracted foradoptionrelated to both the setting and participants. Specifically, the extent to which a study reported;the method of identifying target agent—an agent should be identified regardless of the type of intervention (e.g., device-based or consultation approach);level of expertise of delivery agents(e.g., was specific training or level of understanding or influence reported for different intervention agents)—may be less relevant in device based interventions;inclusion and exclusion criteria for target agent—relevant for all intervention types; the adoption rate (e.g., number of companies who took part/number of companies who were approached)—relevant for all intervention types;comparison of settings/participants of adoption vs. non-adoption settings(e.g., demographic or environmental differences between adoption of program/intervention vs. non-adoption)—relevant for all intervention types;and use of qualitative methods to understand either adoption at setting level and staff participation—relevant for all intervention types.
2.3.4. Implementation
Information relating to the implementation that was extracted and reported on. Specifically,the intervention type(e.g., individual component vs. multi-component)and intensity. With no specific guidance on a measure of intensity, the review team judged the reporting of intensity based on the reporting of the length of the intervention, as well as components of the intervention. Further items included the following: the extent the protocol was delivered as intended (e.g., did the intervention achieve its intended implementation goal or did protocol need to be adapted); a measure of cost (e.g., monetary or time commitment); and use of qualitative methods to understand the implementation of the study.
2.3.5. Maintenance
Maintenance was assessed using the following three items: was an individual’s behaviour assessed at least six months following the completion of the intervention; is the program still in place, was the program modified, and use of qualitative methods to understand long-term effects.
All of the relevant information was extracted and coded in an excel spreadsheet by two reviewers (B.M. and M.P.), with each researcher extracting half of the papers. Upon the completion of the extraction, each of the 28 items were colour coded green if the information was presented, or red if the information was not presented. All of the data extraction was then double checked by a third member of the review team (X.J.) so as to enhance reliability.
2.4. Quality Assessment
3.1. Study Selection
The initial searches identified 7234 articles, and after title and abstract screening, 303 full text articles were screened. Of these, 75 articles representing 61 individual interventions were included in the review (Figure1).
3.2. Characteristics of Identified Articles
Table 2.Characteristics of included articles.
Study Author and Year Continent (Country) Number of Participants Outcome Measurement Measurement Method Study Type Intervention Duration
Aittasalo et al. (2012) [29] Europe (Finland) n= 295
Primary—SB and PA Secondary—work ability and
employee participation
Objective—accelerometer Subjective—workforce sitting questionnaire and additional questions on work ability
Pre- and
post-longitudinal 12 months
Alkhajah et al. (2012) [30] Australia (Australia) n= 32
Primary—SB Secondary—body fat, fasting total
cholesterol, HDL cholesterol, triglycerides, and glucose levels
Objective—ActivPAL, bioimpedance, and cholestech LDX
analyzer
Quasi-experimental
design 3 months
Arrogi et al. (2017) [31] Europe (Belgium) n= 300
Primary—SB and PA Secondary—change in health-related
anthropometric measures and change in psycho-social variables
Objectively—sensewear accelerometer
Randomised control
trial (RCT) 3 months
Barbieri et al. (2017) [12] South America
(Brazil) n= 24 Primary—SB
Objective—monitoring sit–stand table positions
Randomised 2 group
design 2 months
Ben-Ner et al. (2014) [32] North America (USA) n= 43
Primary—SB and PA Secondary—effects of work
performance
Objective—Actical accelerometer Subjective—Likert scale
questionnaire
RCT 12 months
Bort-Roig et al. (2014) [33];
connected to [34,35] Europe (Spain) n= 100
Primary—Update of strategies and Engagement
Subjective—semi-structured
interviews and questionnaires Mix methods 21 weeks
Brakenridge et al. (2016)
[36];connected to [37] Australia (Australia) n= 50
Primary—SB
Secondary—standing and moving time, reliability and validity of the LUMOback, and predictors of
change.
Objective—ActivPAL Cluster randomisedtrial 3 months
Brakenridge et al. (2017)
[37];connected to [36] Australia (Australia) n= 50
Primary—participants perceptions of intervention
Subjective—interview and focus
groups Qualitative study 12 months
Carr et al. (2016) [38] North America (USA) n= 54
Primary—SB and PA Secondary—cardio metabolic health
outcomes, musculoskeletal discomfort, and work productivity
Objective—GENEActiv accelerometer, sphygmomanometer, Subjective—WHO Health and Work Performance Questionnaire
3, Standardized Nordic Musculoskeletal Symptom
Questionnaire
Two-group RCT 4 months
Carr et al. (2013) [39] North America (USA) n= 49
Primary—SB and PA Secondary—heart rate, blood pressure, height, weight, waist circumference, percent body fat, cardiorespiratory fitness, and fasting
lipids
Objective—stepwatch, stethoscope, sphygmomanometer, and
cholestech LDX analyzer
Study Author and Year Continent (Country) Number of Participants Outcome Measurement Measurement Method Study Type Intervention Duration
Carr et al. (2012) [40] North America (USA) n= 18 Primary—SB and PA Subjective—questionnaire
Pre- and post-descriptive
study
1-month
Chau, Daley, and Srinivasan et al. (2014) [41]; connected to
[42]
Australia (Australia) n= 42
Primary—evaluate the acceptability, feasibility, and perceptions of using
sit–stand workstations
Subjective—focus groups Qualitative 1 month
Chau, Daley, and Dunn et al.
(2014) [42];connected to [41] Australia (Australia) n= 49 Primary—SB and PA
Objective—ActiGraph accelerometer Subjective—occupational sitting and physical activity questionnaire
(OSPAQ)
RCT 1 month
Chau et al. (2016) [43] Australia (Australia) n= 31 Primary—SB and PA
Secondary—productivity outcomes Subjective—OSPAQ
Quasi-experimental
with control 2 weeks
Cifuentes et al. (2015) [44] North America (USA) n= 5
Primary—usability, safety, comfort, and productivity using treadmill work stations in a real-world setting
Subjective—Interview and focus
group Qualitative 6 months
Coenen et al. (2017) [45];
connected to [46–49] Australia (Australia) n= 231
Primary—musculoskeletal symptoms
Subjective—27-item Nordic
Musculoskeletal Questionnaire Cross-sectional No intervention
Coffeng et al. (2014) [50] Europe (Netherlands) n= 412
Primary—recovery experience Secondary—work-related stress, small breaks, physical activity (i.e.,
stair climbing, active commuting, sport activities, light/moderate/vigorous physical activity), and sedentary behaviour.
Subjective—questionnaire RCT 12 months
Cooley et al. (2014) [14];
connected to [51] Australia (Australia) n= 47
Primary—perceptions of the outcomes associated with a workplace health intervention designed to reduce prolonged
occupational sitting time
Subjective—Semi-structured
interviews Qualitative 13 weeks
Danquah IH, Kloster S, Holtermann A, Aadahl M,
Tolstrup J et al. (2017) [52];connected to [53]
Europe (Denmark
and Greenland) n= 461
Primary—SB Secondary—musculoskeletal pain
Objective—ActiGraph Subjective—three items on pain in
neck-shoulders
Cluster RCT 3 months
Danquah Danquah IH, Kloster S, Holtermann A,
Aadahl M, Bauman A, Ersbøll AK, et al. (2017); [53]
connected to [52]
Europe (Denmark
and Greenland) n= 461
Primary—SB Secondary—waist circumference
and body fat percentage
Objective—ActiGraph and
[image:8.842.79.763.105.505.2]Table 2.Cont.
Study Author and Year Continent (Country) Number of Participants Outcome Measurement Measurement Method Study Type Intervention Duration
Davis et al. (2014) [54] North America (USA) n= 37 Primary—SB, productivity
discomfort Objective—video analysis
Quasi-experimental
with cross over 1 month
De Cocker et al., (2015) [55] Europe (Belgium) n= 47
Primary—SB Secondary—feasibility and
acceptability
Subjective—Questionnaires Descriptive study 2 weeks
De Cocker et al., (2016) [56];
connected to [57] Europe (Belgium) n= 213
Primary—SB
Secondary—psycho-social correlates of sitting
Objective—ActivPal RCT 3 months
De Cocker et al., (2017) [57];
connected to [56] Europe (Belgium) n= 213
Primary—SB
Secondary—psycho-social correlates of sitting
Subjective—Workforce Sitting
Questionnaire (WSQ) Cluster RCT 1 month
Dewa et al. (2009) [58] North America
(Canada) n= 28
Primary—SB, PA, and mental health status
Subjective—international physical activity questionnaire (IPAQ)
Quasi-experimental
with control 1 month
Donath et al. (2015) [59] Europe (Switzerland) n= 38
Primary—SB
Secondary—concentration, postural sway, and lower limb strength
endurance
Objectively—ActiGraph RCT 3 months
Ellegast (2012) [60] Europe (Germany) n= 25 Secondary—health outcomesPrimary—SB and PA Subjectively—Activity logs RCT 3 months
Engelen et al. (2016) [61] Australia (Australia) n= 34
Primary—SB and PA Secondary—perceptions and
productivity
Objective—accelerometer Subjective—online activity logs,
mood state questionnaire, and orthopaedic medical check-up (G-46)
Natural experiment 2 months
Evans et al. (2012) [62] Europe (U.K.) n= 30 Primary—SB Objective—ActivPAL RCT 5 days
Fennel et al. (2016) [63] North America (USA) n= 62
Primary—SB, PA, and fitness related variables
Secondary—associated psychometric factors
Subjective—IPAQ questionnaire, international personality item pool,
self-efficacy and exercise habits survey, behavioural regulation in
exercise questionnaire-3
RCT 4 months
Ganesan et al. (2016) [64] Australia (Australia) n= 69,219
Primary—SB and PA Secondary—weight change/BMI
change and dietary change
Subjective—questionnaire Natural experiment 100 days
Gao et al. (2016) [65] Europe (Finland) n= 45
Primary—SB Secondary—musculoskeletal
discomfort and work ability
Subjective—questionnaire and
Likert scale items RCT 6 months
Gilson et al. (2009) [66] Europe (U.K.) n= 179 Primary—SB and PA Subjective—log book RCT 10 weeks
Gilson et al. (2016) [67] Australia (Australia) n= 57 Primary—SB Objective—chair fitted sitting
Study Author and Year Continent (Country) Number of Participants Outcome Measurement Measurement Method Study Type Intervention Duration
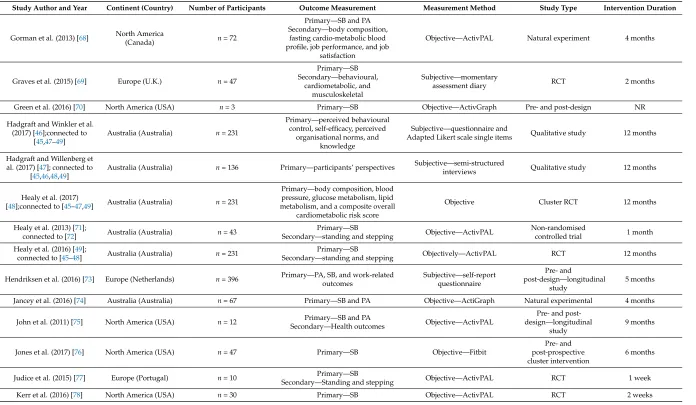
Gorman et al. (2013) [68] North America
(Canada) n= 72
Primary—SB and PA Secondary—body composition,
fasting cardio-metabolic blood profile, job performance, and job
satisfaction
Objective—ActivPAL Natural experiment 4 months
Graves et al. (2015) [69] Europe (U.K.) n= 47
Primary—SB Secondary—behavioural,
cardiometabolic, and musculoskeletal
Subjective—momentary
assessment diary RCT 2 months
Green et al. (2016) [70] North America (USA) n= 3 Primary—SB Objective—ActivGraph Pre- and post-design NR
Hadgraft and Winkler et al. (2017) [46];connected to
[45,47–49]
Australia (Australia) n= 231
Primary—perceived behavioural control, self-efficacy, perceived
organisational norms, and knowledge
Subjective—questionnaire and
Adapted Likert scale single items Qualitative study 12 months
Hadgraft and Willenberg et al. (2017) [47]; connected to
[45,46,48,49]
Australia (Australia) n= 136 Primary—participants’ perspectives Subjective—semi-structured
interviews Qualitative study 12 months
Healy et al. (2017)
[48];connected to [45–47,49] Australia (Australia) n= 231
Primary—body composition, blood pressure, glucose metabolism, lipid metabolism, and a composite overall
cardiometabolic risk score
Objective Cluster RCT 12 months
Healy et al. (2013) [71];
connected to [72] Australia (Australia) n= 43
Primary—SB
Secondary—standing and stepping Objective—ActivPAL
Non-randomised
controlled trial 1 month
Healy et al. (2016) [49];
connected to [45–48] Australia (Australia) n= 231
Primary—SB
Secondary—standing and stepping Objectively—ActivPAL RCT 12 months
Hendriksen et al. (2016) [73] Europe (Netherlands) n= 396 Primary—PA, SB, and work-relatedoutcomes Subjective—self-reportquestionnaire
Pre- and
post-design—longitudinal study
5 months
Jancey et al. (2016) [74] Australia (Australia) n= 67 Primary—SB and PA Objective—ActiGraph Natural experimental 4 months
John et al. (2011) [75] North America (USA) n= 12 Primary—SB and PA
Secondary—Health outcomes Objective—ActivPAL
Pre- and post-design—longitudinal
study
9 months
Jones et al. (2017) [76] North America (USA) n= 47 Primary—SB Objective—Fitbit
Pre- and post-prospective cluster intervention
6 months
Judice et al. (2015) [77] Europe (Portugal) n= 10 Primary—SB
Secondary—Standing and stepping Objective—ActivPAL RCT 1 week
[image:10.842.81.777.106.511.2]Table 2.Cont.
Study Author and Year Continent (Country) Number of Participants Outcome Measurement Measurement Method Study Type Intervention Duration
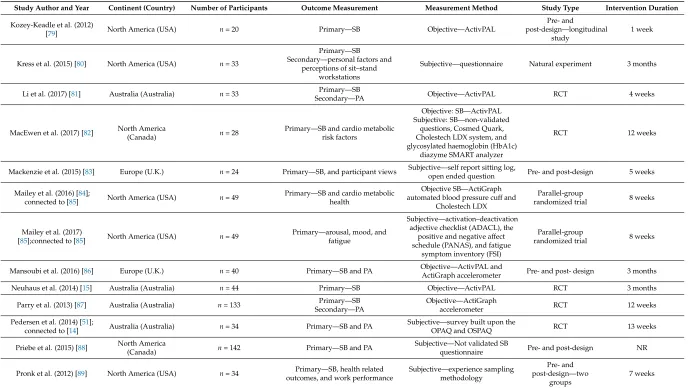
Kozey-Keadle et al. (2012)
[79] North America (USA) n= 20 Primary—SB Objective—ActivPAL
Pre- and
post-design—longitudinal study
1 week
Kress et al. (2015) [80] North America (USA) n= 33
Primary—SB Secondary—personal factors and
perceptions of sit–stand workstations
Subjective—questionnaire Natural experiment 3 months
Li et al. (2017) [81] Australia (Australia) n= 33 Primary—SB
Secondary—PA Objective—ActivPAL RCT 4 weeks
MacEwen et al. (2017) [82] North America
(Canada) n= 28
Primary—SB and cardio metabolic risk factors
Objective: SB—ActivPAL Subjective: SB—non-validated
questions, Cosmed Quark, Cholestech LDX system, and glycosylated haemoglobin (HbA1c)
diazyme SMART analyzer
RCT 12 weeks
Mackenzie et al. (2015) [83] Europe (U.K.) n= 24 Primary—SB, and participant views Subjective—self report sitting log,open ended question Pre- and post-design 5 weeks
Mailey et al. (2016) [84];
connected to [85] North America (USA) n= 49
Primary—SB and cardio metabolic health
Objective SB—ActiGraph automated blood pressure cuff and
Cholestech LDX
Parallel-group
randomized trial 8 weeks
Mailey et al. (2017)
[85];connected to [85] North America (USA) n= 49
Primary—arousal, mood, and fatigue
Subjective—activation–deactivation adjective checklist (ADACL), the
positive and negative affect schedule (PANAS), and fatigue
symptom inventory (FSI)
Parallel-group
randomized trial 8 weeks
Mansoubi et al. (2016) [86] Europe (U.K.) n= 40 Primary—SB and PA Objective—ActivPAL and
ActiGraph accelerometer Pre- and post- design 3 months
Neuhaus et al. (2014) [15] Australia (Australia) n= 44 Primary—SB Objective—ActivPAL RCT 3 months
Parry et al. (2013) [87] Australia (Australia) n= 133 Secondary—PAPrimary—SB Objective—ActiGraphaccelerometer RCT 12 weeks
Pedersen et al. (2014) [51];
connected to [14] Australia (Australia) n= 34 Primary—SB and PA
Subjective—survey built upon the
OPAQ and OSPAQ RCT 13 weeks
Priebe et al. (2015) [88] North America(Canada) n= 142 Primary—SB and PA Subjective—Not validated SBquestionnaire Pre- and post-design NR
Pronk et al. (2012) [89] North America (USA) n= 34 Primary—SB, health related outcomes, and work performance
Subjective—experience sampling methodology
Pre- and post-design—two
groups
Study Author and Year Continent (Country) Number of Participants Outcome Measurement Measurement Method Study Type Intervention Duration
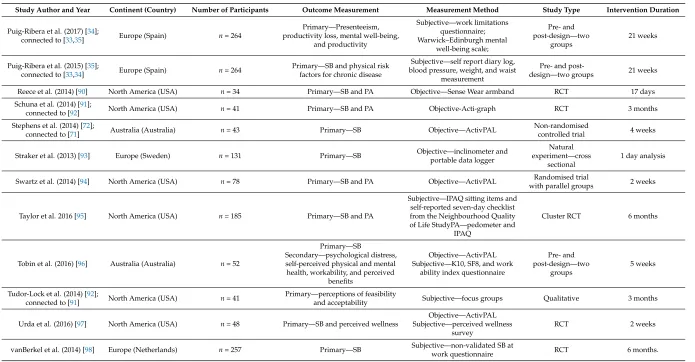
Puig-Ribera et al. (2017) [34];
connected to [33,35] Europe (Spain) n= 264
Primary—Presenteeism, productivity loss, mental well-being,
and productivity
Subjective—work limitations questionnaire; Warwick–Edinburgh mental
well-being scale;
Pre- and post-design—two
groups
21 weeks
Puig-Ribera et al. (2015) [35];
connected to [33,34] Europe (Spain) n= 264
Primary—SB and physical risk factors for chronic disease
Subjective—self report diary log, blood pressure, weight, and waist
measurement
Pre- and
post-design—two groups 21 weeks
Reece et al. (2014) [90] North America (USA) n= 34 Primary—SB and PA Objective—Sense Wear armband RCT 17 days
Schuna et al. (2014) [91];
connected to [92] North America (USA) n= 41 Primary—SB and PA Objective-Acti-graph RCT 3 months
Stephens et al. (2014) [72];
connected to [71] Australia (Australia) n= 43 Primary—SB Objective—ActivPAL
Non-randomised
controlled trial 4 weeks
Straker et al. (2013) [93] Europe (Sweden) n= 131 Primary—SB Objective—inclinometer andportable data logger
Natural experiment—cross
sectional
1 day analysis
Swartz et al. (2014) [94] North America (USA) n= 78 Primary—SB and PA Objective—ActivPAL Randomised trial
with parallel groups 2 weeks
Taylor et al. 2016 [95] North America (USA) n= 185 Primary—SB and PA
Subjective—IPAQ sitting items and self-reported seven-day checklist from the Neighbourhood Quality of Life StudyPA—pedometer and
IPAQ
Cluster RCT 6 months
Tobin et al. (2016) [96] Australia (Australia) n= 52
Primary—SB
Secondary—psychological distress, self-perceived physical and mental health, workability, and perceived
benefits
Objective—ActivPAL Subjective—K10, SF8, and work
ability index questionnaire
Pre- and post-design—two
groups
5 weeks
Tudor-Lock et al. (2014) [92];
connected to [91] North America (USA) n= 41
Primary—perceptions of feasibility
and acceptability Subjective—focus groups Qualitative 3 months
Urda et al. (2016) [97] North America (USA) n= 48 Primary—SB and perceived wellness
Objective—ActivPAL Subjective—perceived wellness
survey
RCT 2 weeks
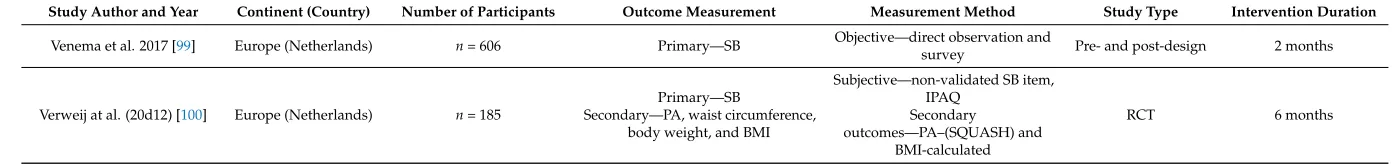
[image:12.842.78.773.104.466.2]Table 2.Cont.
Study Author and Year Continent (Country) Number of Participants Outcome Measurement Measurement Method Study Type Intervention Duration
Venema et al. 2017 [99] Europe (Netherlands) n= 606 Primary—SB Objective—direct observation and
survey Pre- and post-design 2 months
Verweij at al. (20d12) [100] Europe (Netherlands) n= 185
Primary—SB
Secondary—PA, waist circumference, body weight, and BMI
Subjective—non-validated SB item, IPAQ
Secondary outcomes—PA–(SQUASH) and
BMI-calculated
RCT 6 months
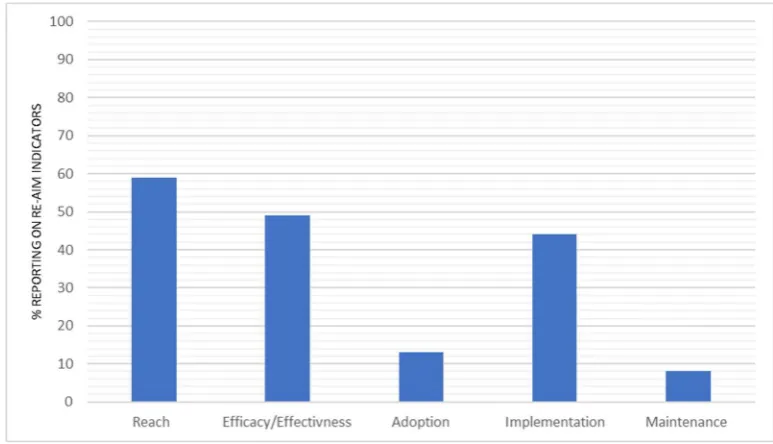
The total percentage of reporting across all of the indicators within the individual RE-AIM dimension is represented in Figure2. Reach indicators were reported on average 59% of the time. Efficacy/effectiveness was reported at 49% across all of the indicators. Implementation indicators were reported an average of 44% of the time. The overall percentage of interventions reporting on the indicators of adoption and maintenance indicators were 13% and 8%, respectively. A full break down of reporting across all of the indicators for individual studies is available in Supplementary Tables S1 and S2.
3.3. Percentage Reporting across RE-AIM Dimensions
[image:14.595.103.490.213.435.2]The total percentage of reporting across all of the indicators within the individual RE-AIM dimension is represented in Figure 2. Reach indicators were reported on average 59% of the time. Efficacy/effectiveness was reported at 49% across all of the indicators. Implementation indicators were reported an average of 44% of the time. The overall percentage of interventions reporting on the indicators of adoption and maintenance indicators were 13% and 8%, respectively.
Figure 2. The total proportion of reporting across all indicators within each RE-AIM dimension.
3.4. Reach
There was a significant variation between the reach indicators (Figure 3), with a high reporting of three indicators, namely, identifying target population (n =57, 93%), inclusion criteria (n =50, 82%), and sample size (n =61, 100%). The reporting of exclusion criteria and participation rate were lower, with both being reported at 61% (n = 37). There was low reporting for the characteristics of participants vs. non-participants (n =6, 10%), and for the use of qualitative methods to understand reach (n =4, 7%).
Figure 3. Percentage of studies reporting reach indicators.
Figure 2.The total proportion of reporting across all indicators within each RE-AIM dimension.
3.4. Reach
Int. J. Environ. Res. Public Health2018,15, 2876 15 of 29 3.3. Percentage Reporting across RE-AIM Dimensions
The total percentage of reporting across all of the indicators within the individual RE-AIM dimension is represented in Figure 2. Reach indicators were reported on average 59% of the time. Efficacy/effectiveness was reported at 49% across all of the indicators. Implementation indicators were reported an average of 44% of the time. The overall percentage of interventions reporting on the indicators of adoption and maintenance indicators were 13% and 8%, respectively.
Figure 2. The total proportion of reporting across all indicators within each RE-AIM dimension.
3.4. Reach
There was a significant variation between the reach indicators (Figure 3), with a high reporting of three indicators, namely, identifying target population (n =57, 93%), inclusion criteria (n =50, 82%), and sample size (n =61, 100%). The reporting of exclusion criteria and participation rate were lower, with both being reported at 61% (n = 37). There was low reporting for the characteristics of participants vs. non-participants (n =6, 10%), and for the use of qualitative methods to understand reach (n =4, 7%).
Figure 3.Figure 3. Percentage of studies reporting reach indicators. Percentage of studies reporting reach indicators.
3.5. Efficacy/Effectiveness
Figure4illustrates the percentage of reporting for individual efficacy/effectiveness indicators. High reporting was noted across several indicators, including the following: the measure of primary outcome at the shortest assessment point (n= 61, 100%), and the percent attrition rate (n= 47, 77%). The measurement of the primary outcome at extra follow up points was reported for 39 interventions (64%). The reporting dropped significantly for the remaining three indicators, with 15 interventions (25%) reporting on quality of life measurement, nine interventions (15%) reporting imputation or intention to treat analysis, and seven interventions (11%) reporting use of qualitative methods to understand outcomes.
Int. J. Environ. Res. Public Health 2018, 15, x FOR PEER REVIEW 14 of 27
3.5. Efficacy/Effectiveness
[image:15.595.92.502.87.304.2]Figure 4 illustrates the percentage of reporting for individual efficacy/effectiveness indicators. High reporting was noted across several indicators, including the following: the measure of primary outcome at the shortest assessment point (n = 61, 100%), and the percent attrition rate (n = 47, 77%). The measurement of the primary outcome at extra follow up points was reported for 39 interventions (64%). The reporting dropped significantly for the remaining three indicators, with 15 interventions (25%) reporting on quality of life measurement, nine interventions (15%) reporting imputation or intention to treat analysis, and seven interventions (11%) reporting use of qualitative methods to understand outcomes.
Figure 4. Percentage of interventions reporting efficacy/effectiveness indicators.
3.6. Adoption
Figure 5 illustrates the percentage reporting for individual adoption indicators. In total, 16 interventions (26%) reported methods to identify delivery target agent, 11 interventions (18%) reported the level of expertise of the delivery agents, and five interventions (8%) provided inclusion/exclusion criteria concerning adoption at the setting level. Furthermore, five interventions (8%) reported a rate of adoption at the setting level, two interventions (3%) reported the use of qualitative methods to understand adoption, and six interventions (10%) reported differences in characteristics (either participant or setting) of adoption vs. non-adoption.
[image:15.595.89.517.469.654.2]Figure 5. Percentage of interventions reporting adoption indicators. Figure 4.Percentage of interventions reporting efficacy/effectiveness indicators.
3.6. Adoption
Int. J. Environ. Res. Public Health2018,15, 2876 16 of 29
to understand adoption, and six interventions (10%) reported differences in characteristics (either participant or setting) of adoption vs. non-adoption.
High reporting was noted across several indicators, including the following: the measure of primary outcome at the shortest assessment point (n = 61, 100%), and the percent attrition rate (n = 47, 77%). The measurement of the primary outcome at extra follow up points was reported for 39 interventions (64%). The reporting dropped significantly for the remaining three indicators, with 15 interventions (25%) reporting on quality of life measurement, nine interventions (15%) reporting imputation or intention to treat analysis, and seven interventions (11%) reporting use of qualitative methods to understand outcomes.
Figure 4. Percentage of interventions reporting efficacy/effectiveness indicators.
3.6. Adoption
Figure 5 illustrates the percentage reporting for individual adoption indicators. In total, 16 interventions (26%) reported methods to identify delivery target agent, 11 interventions (18%) reported the level of expertise of the delivery agents, and five interventions (8%) provided inclusion/exclusion criteria concerning adoption at the setting level. Furthermore, five interventions (8%) reported a rate of adoption at the setting level, two interventions (3%) reported the use of qualitative methods to understand adoption, and six interventions (10%) reported differences in characteristics (either participant or setting) of adoption vs. non-adoption.
Figure 5. Percentage of interventions reporting adoption indicators. Figure 5.Percentage of interventions reporting adoption indicators.
3.7. Implementation
Figure6illustrates the reporting for implementation. The most commonly reported indicator was the intervention type and intensity (n= 60, 98%). In total, 36 (59%) interventions reported on the extent the protocol was delivered as intended, and eight interventions (13%) used qualitative methods to understand implementation. Finally, a measure of cost (protocol) was reported in three interventions (5%).
Int. J. Environ. Res. Public Health 2018, 15, x FOR PEER REVIEW 15 of 27
[image:16.595.111.486.127.340.2]3.7. Implementation
[image:16.595.124.471.463.699.2]Figure 6 illustrates the reporting for implementation. The most commonly reported indicator was the intervention type and intensity (n = 60, 98%). In total, 36 (59%) interventions reported on the extent the protocol was delivered as intended, and eight interventions (13%) used qualitative methods to understand implementation. Finally, a measure of cost (protocol) was reported in three interventions (5%).
Figure 6. Percentage of interventions reporting implementation indicators.
3.8. Maintenance
Concerning individual indicators of maintenance (Figure 7), five interventions (8%) reported on an individual behaviour assessment at least six months following the completion of the intervention; five interventions (8%) reported whether the program is still in place, six interventions (10%) reported the use of qualitative methods to understand setting level institutionalization, and four interventions (7%) reported if the program was modified.
Figure 7. Percentage of interventions reporting maintenance indicators. Figure 6.Percentage of interventions reporting implementation indicators.
3.8. Maintenance
Int. J. Environ. Res. Public Health2018,15, 2876 17 of 29
five interventions (8%) reported whether the program is still in place, six interventions (10%) reported the use of qualitative methods to understand setting level institutionalization, and four interventions (7%) reported if the program was modified.
3.7. Implementation
Figure 6 illustrates the reporting for implementation. The most commonly reported indicator was the intervention type and intensity (n = 60, 98%). In total, 36 (59%) interventions reported on the extent the protocol was delivered as intended, and eight interventions (13%) used qualitative methods to understand implementation. Finally, a measure of cost (protocol) was reported in three interventions (5%).
Figure 6. Percentage of interventions reporting implementation indicators.
3.8. Maintenance
[image:17.595.97.501.141.361.2]Concerning individual indicators of maintenance (Figure 7), five interventions (8%) reported on an individual behaviour assessment at least six months following the completion of the intervention; five interventions (8%) reported whether the program is still in place, six interventions (10%) reported the use of qualitative methods to understand setting level institutionalization, and four interventions (7%) reported if the program was modified.
Figure 7. Percentage of interventions reporting maintenance indicators. Figure 7.Percentage of interventions reporting maintenance indicators.
4. Discussion
The purpose of this review is to provide an understanding of the depth of reporting of indicators across the RE-AIM dimensions. Previous systematic reviews have investigated the effectiveness of workplace SB interventions [16–18]. However, to the authors’ knowledge, this is the first systematic review focusing on RE-AIM reporting in office-based SB interventions. This review is the first to synthesise a breadth of the evidence in the field, with a focus on the reporting of indicators important to the future implementation and translation of interventions.
The reach indicators were the most frequently reported of all of the RE-AIM dimensions; reported on average 59% of the time. Efficacy/effectiveness was the second most reported dimension at 49% reporting across all of the indicators. The implementation indicators were reported an average of 44% of the time. The overall percentage of studies reporting on the indicators of adoption and maintenance were the lowest of all of the RE-AIM framework indicators at 13% and 8%, respectively. The results revealed that 10 of the 28 indicators were reported more than 50% of the time however, and the remaining 18 indicators were reported less than 30% of the time, revealing a distinct contrast in the indicators that are routinely reported in interventions. In light of this result, the research team has focused the discussion primarily on the indicators or indeed the whole dimensions that have been “under-reported” or have been reported for less than 30% of the interventions. The discussion firstly presents specific methods used to capture the data from underreported indicators of RE-AIM; and secondly, provides future considerations and recommendations for collecting the data of under reported RE-AIM indicators. This is done in order to facilitate improved reporting (success and failure) across the RE-AIM dimensions, so as to improve our evaluation of generalisability and potential translation of interventions, as well as the potential for the public health impact of interventions [20,21,101].
4.1. Reach
Bort-Roig et al. (2014) [33] highlight the methods for reporting on these indicators specifically. De Cocker et al. (2016) delivered computer-tailored advice to influence sitting behaviour [56,57]. To report on the representativeness of participants vs. non-participants, the authors utilised the already available health information of the office employees that did not participate, and did a comparative analysis to the demographics of the workers who participated [55–57]. In De Cocker’s intervention, the office workers who were less educated were less likely to participate, therefore, an educational element may be critical in order to engage less educated office workers [56,57]. This example highlights how information on representativeness can provide further insight into how to best target intervention strategies.
Additionally, the data collected by Bort-Roig et al. (2014) used a qualitative methodology to facilitate an understanding of the participant uptake [33]. In the study, they interviewed the implementation team regarding their perceptions of factors that impacted on uptake within the study. They then triangulated the interview results with the participant surveys that rated the extent to which the uptake strategies were used [33]. This triangulation process facilitated understanding of reach, giving context to the factors that influenced the study population.
These two studies highlight methods that can be used to improve on the reporting of indicators of reach. Each method improved the understanding of the factors, which may impact on the future implementation and translation of the studies, and therefore, have a potential public health impact.
4.2. Efficacy/Effectiveness
As with reach, there are distinct differences in the indicators of efficacy/effectiveness that are routinely reported (Figure3). The reporting of measure/results (at shortest assessment) (n= 61, 100%), effects at longest (extra follow up) (n= 39, 64%), and the percent attrition rate (dropout rate) (n= 47, 77%) were significantly higher than the quality of life measurement (n= 15, 25%) and use of qualitative methods or data to understand outcomes (n= 7, 11%), both of which were underreported.
SB is associated with the additional health related outcomes that may affect the “quality of life” of the participants, including, back, shoulder, and neck pain [102–104], and a variety of psychological issues, for example, depression [105], distress [106], and anxiety [107]. Therefore, these outcomes are also important to measure so as to improve our understanding of the association, and to monitor negative unintended outcomes. Importantly, the measurement of additional quality of life outcomes has the potential to strengthen the arguments for the importance of reducing office-based SB. For example, the methods utilised in the Pronk et al. (2012) [89] intervention “take a stand” provided an example of reporting quality of life measurement [89]. In the intervention, the research team administered validated questionnaires to collect data related to additional work-related outcomes (pre-and post-intervention), which facilitated reporting in relation to the quality of life indicator. The results showed that reductions in the sitting time were significantly associated with reductions in upper back and neck pain, fatigue, confusion, and total mood disturbance [89]. In this example, the measurement of the additional outcomes provided evidence that the intervention was not negatively affecting other related health conditions. This type of measurement may help to increase our understanding of other additional benefits of reducing office-based SB.
It is clear that reporting on additional indicators of RE-AIM fostered a more holistic understanding of the real impact of the interventions. This information may now be used to help improve the future implementation and translation of the research into different settings.
4.3. Adoption
This review has highlighted the underreporting of all of the indicators of the adoption dimension (Figure4). This is an interesting finding that, on face value, appears to give evidence of poor reporting on setting level indicators. However, a limited number of interventions were implemented across multiple settings (n= 16, 26%) in this review. Most of the included interventions were implemented in one setting only and on a relatively small scale (67%, <50 participants); this illustrates a clear gap in the literature.
This review gives further evidence that there is a barrier to translating research from small scale SB interventions to larger scale effectiveness trials [16,101]. The result of this review suggests that one barrier to translation may be the under reporting of indicators that would facilitate effective translation. However, resources, for example time and money, are also significant barriers that often result in pragmatic decision making with respect to the scale of implementation [20,21,101]. The solution to these significant barriers may lie in our engagement with additional stakeholders in workplace health. Companies continue to increase resources in order to improve employee health and wellbeing, as they increasingly understand the relationship between productivity and health status [108–110]. However, workplace health promotion programs are often not informed by evidence, and a recent review suggests that programs that are informed by research have more potential to yield positive results [111]. Therefore, a more “practice based” [21] approach, in which researchers work directly with workplace health promotion stakeholders, would bring together both the evidence-based knowledge and resources needed to effectively translate on a larger scale [21]. For this approach to be successful, understanding and addressing the potential barriers to working directly with companies would be important. For example, with new data protection regulations being implemented, one barrier to overcome may be the companies’ willingness to share/collect the health data of employees, with potential concerns that, if misused, it may bring harm to their employees [112,113]. However, if the relationship is nurtured, and concerns are mediated, the approach could help embed public–private partnerships at earlier stages of research. This will help to build stronger practice-based relationships as projects develop [114]. The approach could also circumvent funding bodies, which can be reluctant to fund scaled up trials, which are seen as less “scientifically pure” [115]. Although trade-offs in experimental design may be made, this more pragmatic “practice-based” [21] approach would produce evidence that more accurately reflects the conditions in which it is expected to be applied [20,21,116,117]. Of the 26% of the interventions implemented across multiple settings, there are none that reported all of the adoption indicators. However, there are examples of quality reporting of some individual indicators. For example, Brakenridge et al. (2016, 2017), who had the highest reporting in the review (21 of 28 indicators), reported four of the seven indicators of adoption [36,37]. In Brakenridge et al. (2017), the researchers interviewed members of the implementation team and conducted focus groups with participants in order to understand the differences in implementation across settings [37]. Qualitative findings revealed that there were differences in the role model influence and management engagement across settings, and this may have impacted on variations in the intervention effects across settings [36,37]. Collecting this information may help to improve future translations of this type of intervention. Additionally, when reporting the level of expertise of the delivery agent, Aittasalo et al. (2017) [29] explained the training process of the delivery agents, including the number of hours spent training face to face [29].
The reporting of the indicators relating to the implementation dimension was mixed (Figure5). Nearly all of the studies included in this review (n= 60, 98%) reported on the type of intervention and intensity by explaining the intervention activities in detail, and many studies (n= 36, 59%) reported on the extent the protocol was delivered as intended (development of a protocol). There was minimal reporting on the indicators which that are important for obtaining similar effects in future iterations of the study. These would include indicators that, for example, question whether the protocol was delivered by the implementation team as the intended? What aspects of the intervention were more or less effective than others? What was the cost (e.g., time commitment or monetary) to implement the intervention? Reporting on these indicators is critical to understanding which specific behaviour change strategies were successfully implemented and caused an effect within a study, and which were less successful. For example, Bort-Roig et al. (2014) [33] found, using both questionnaire and focus group data, that walk–talk meetings and lunch walking groups were rarely utilised within the intervention, and sitting time and step count logging were the most critical enabler of behaviour change. These results would be important to consider for the future implementation of this intervention, and may even trigger adaptations to the less successful strategies, potentially improving the potential public health impact of the study [33].
4.5. Maintenance
There was under-reporting of all of the indicators related to the maintenance dimension of RE-AIM (Figure6), averaging just 8% overall (Figure1). Two of the indicators assessed whether studies report on (a) if the program is still in place and (b) if the program was modified. These two indicators were only reported 8% (n= 5) and 7% (n= 4), respectively; however, Parry et al. (2013) [87] exemplified how this type of information could easily be reported, explaining, “The trial was ended due to the lack of further organisations willing to participate within the two-year data collection period” [87]. A third indicator looked for reporting on the follow up measurement six months post intervention. This indicator was also underreported (n= 5, 8%). This result is indicative of the fact that 41 of included studies were less than four months in length. From this analysis, it is clear there is a need for longer follow up periods. Interestingly, all of the studies that reported six-month follow-up data did so using self-report methods. Although self-report has its limitations, these results indicate that it may be best placed to pragmatically evaluate the long-term effect, which is vital to understand if long term public health impact is the objective. The six studies that reported on the final indicator of maintenance utilised qualitative methods in order to understand the setting level institutionalisation. For example, in Cifuentes et al. (2015) [44], the reporting highlighted significant barriers to maintaining change in the long term and highlighted areas, which would need to be adapted for the successful future uptake of the intervention [44].
4.6. Indicators of Cost
4.7. Recommendations for Future Reporting
[image:21.595.79.517.277.733.2]In light of the significant gaps in reporting, the research team have created specific recommendations for the improved future reporting of office-based SB interventions (Table 3). Process evaluation is a critical part of any intervention study, however our review highlights a clear gap in the reporting of indicators that informs this practice [20]. The recommendations highlight that the RE-AIM framework may prove useful in providing a framework for collecting this breadth of process data or information. Additionally, it is clear from the recommendations that this process would require a mixed methods approach [118,119]. Using appropriate methods to capture the necessary data is the first step to both, improved translation, and population level impact.
Table 3. Recommendations for improved reporting across reach, effectiveness, adoption, implementation, and maintenance (RE-AIM), and examples of reporting methods used within included interventions.
RE-AIM Dimension Recommendations for Improved Reporting across the RE-AIM Framework for Interventions Targeting Sedentary Behaviour in Office Workers
Reach
• Seek or collect basic demographic or health information of all workplace setting employees, which will help to compare participants vs. non-participants. Example method found in De Cocker et al. (2016) and De Cocker et al. (2017) [56,57].
• Report the number of participants exposed to recruitment activities and illustrate the calculation of participation rate of the study.
• Employ questionnaire or qualitative methods to understand barriers to reach of study. Example method found in Bort-Riog et al. (2014) [33].
Effectiveness
• If intention to treat methods are used, report specific method and rationale for appropriateness. Example method found in Arrogi et al. (2017) [31].
• Seek to use biological outcome measures (e.g., body composition, cardiovascular fitness, glucose metabolism and overall cardiomtabolic risk score). Example methods found in Healy et al. (2017) [48].
• Use questionnaire and/or qualitative methods to understand impact on quality of life and unintended or unexpected outcomes. Example methods found in Pronk et al. (2012) [89] and Hardgraft et al. (2017) [47].
• Additional questionnaires utilised for unexpected outcomes including: musculoskeletal (27-item Nordic musculoskeletal questionnaire), presenteeism (work limitations questionnaire (WLQ), percentage of work productivity loss (WLQ index score) and mental well-being (Warwick–Edinburgh mental well-being scale (WEMWBS)). Productivity—the work limitations questionnaire (WLQ) assessed profile of mood states (POMS) questionnaire.
Adoption
• Record and report on the specific recruitment processes, including: inclusion and exclusion criteria for businesses, the number of companies or sites approached, the number who declined available demographic information to report on representativeness of company demographics compared to local area statistics (e.g., state or province or council demographic statistics.). Example method found in Puig-Ribera et al. (2015) [35]. • Collect quantitative information from implementation team regarding level of training
and expertise and fidelity to implementation strategies. Example method found in Brakenridge et al. 2017 [37] Aittasalo et al. (2012) [29].
• Report a measure of cost to implement per setting.
Implementation
• Collect qualitative or questionnaire data from the implementation team regarding the fidelity to implementation strategies and facilitators and barriers to implementation. Example method found in Bort-Riog et al. (2014) [33].
• Collect qualitative or questionnaire data regarding facilitators and barriers to uptake of behaviour change strategies. Example method found in Bort-Riog et al. (2014) [33]. • Report on cost (monetary or time commitment) of implementation of individual
intervention strategies.
Maintenance
• Record and report plans for follow-up and any modifications to program.
The collection of data on under reported indicators can be done retrospectively [120]. However, it would be seen as best practice to imbed the necessary data collection methods in the initial study design, so as to inform the process evaluation [20]. Both retrospective and embedded process evaluation take careful and considered planning, however the RE-AIM recommendations would prove useful in both cases.
5. Strengths and Limitations
A key strength of the review is that it is the first review to look at a large proportion of published interventions that have been done targeting office based sedentary behaviour, in order to understand the state of reporting for effective future translation. This may be crucial to understand, as future population level impact relies on successful translation. Additionally, using the RE-AIM framework enabled an in-depth and critical analysis of the individual papers. This critical approach has facilitated the creation of specific and considered recommendations to enhance future intervention reporting within office-based sedentary interventions. Furthermore, the use of software tailored for reviews enabled quality assurance through the blinded double screening process. The study is not without limitations. Because of the focus on the quality of reporting across the RE-AIM dimensions, we did not include a quality assurance tool, which would be typically seen in an efficacy-based review. It could be the case that interventions that rate low across RE-AIM in this review rate high in other reviews, or vice versa. The review could also be limited by the number of databases (five) searched and the focus on workplace interventions that measure SB as a primary outcome.
6. Conclusions
The results of this review indicate that there is an imbalance in the reporting of indicators across the RE-AIM framework. The improvement of reporting across all interventions, designed to reduce sedentary behavior in office workers, will be an important first step in the effective translation of interventions into real world conditions [23]. Minimal studies have been implemented at scale with substantial follow up periods, suggesting that significant barriers exist, and this fuels arguments for a more pragmatic “practice-based” approach to intervention design, in which researchers work alongside delivery agents of workplace health [20,21,121]. Regardless of the intervention design or approach, the results and subsequent recommendations of this review would provide a useful starting point for researchers in the evaluation of important, often overlooked, indicators. Improved reporting may ultimately improve the translation of research on a large scale, and have impacts on public health as intended.
Supplementary Materials: Supplementary materials are available online at http://www.mdpi.com/1660-4601/15/12/2876/s1. Table S1: reporting of indicators of reach and effectiveness, across all of the included interventions, Table S2: reporting of indicators of adoption, implementation, and maintenance, across all of the included interventions.
Author Contributions: All of the authors contributed to the conceptualisations of the review. Searches and screening were done by B.M., M.P., and X.J. Data extraction was done by B.M., M.P., and X.J. Data analysis was done by B.M., X.J., and M.P. The paper was written by B.M., and all of the authors provided feedback on the draft manuscript and approved the final version.
Funding:This research received no external funding.
Conflicts of Interest:The authors declare no conflict of interest.
References
2. De Rezende, L.F.M.; Lopes, M.R.; Rey-López, J.P.; Matsudo, V.K.R.; do Carmo, L.O.J. Sedentary behavior and health outcomes: An overview of systematic reviews.PLoS ONE2014,9, e105620. [CrossRef] [PubMed] 3. Owen, N.; Healy, G.N.; Matthews, C.E.; Dunstan, D.W. Too much sitting: The population-health science of
sedentary behavior.Exerc. Sport Sci. Rev.2010,38, 105–113. [CrossRef] [PubMed]
4. Colley, R.C.; Garriguet, D.; Janssen, I.; Craig, C.L.; Clarke, J.; Tremblay, M. Physical activity of Canadian adults: Accelerometer results from the 2007 to 2009 Canadian Health Measures Survey.Heath Rep.2011,22, 7–14.
5. Bennie, J.A.; Chau, J.Y.; van der Ploeg, H.P.; Stamatakis, E.; Do, A.; Bauman, A. The prevalence and correlates of sitting in European adults—A comparison of 32 Eurobarometer-participating countries.Int. J. Behav. Nutr. Phys. Act.2013,10, 107. [CrossRef] [PubMed]
6. Matthews, C.E.; Chen, K.Y.; Freedson, P.S.; Buchowski, M.S.; Beech, B.M.; Pate, R. Amount of time spent in sedentary behaviors in the United States; 2003–2004. Am. J. Epidemiol.2008,167, 875–881. [CrossRef] [PubMed]
7. Parry, S.; Straker, L. The contribution of office work to sedentary behaviour associated risk. BMC Public Health2013,13, 296. [CrossRef]
8. Thorp, A.A.; Healy, G.N.; Winkler, E.; Clark, B.K.; Gardiner, P.A.; Owen, N. Prolonged sedentary time and physical activity in workplace and non-work contexts: A cross-sectional study of office; customer service and call centre employees.Int. J. Behav. Nutr. Phys. Act.2012,9, 128. [CrossRef]
9. Toomingas, A.; Forsman, M.; Mathiassen, S.E.; Heiden, M.; Nilsson, T. Variation between seated and standing/walking postures among male and female call centre operators.BMC Public Helath2012,12, 154. [CrossRef]
10. Frey, C.B.; Osborne, M.A. The future of employment: How susceptible are jobs to computerisation?Technol. Forecast. Soc. Chang.2017,114, 254–280. [CrossRef]
11. Buckley, J.P.; Hedge, A.; Yates, T.; Copeland, R.J.; Loosemore, M.; Hamer, M. The sedentary office: A growing case for change towards better health and productivity. Expert statement commissioned by Public Health England and the Active Working Community Interest Company. Br. J. Sports Med. 2015, 49, 094618. [CrossRef] [PubMed]
12. Barbieri, D.F.; Srinivasan, D.; Mathiassen, S.E.; Oliveira, A.B. Comparison of sedentary behaviors in office workers using sit-stand tables with and without semiautomated position changes.Hum. Factors2017,59, 782–795. [CrossRef] [PubMed]
13. Hutchinson, J.; Headley, S.; Matthews, T.; Spicer, G.; Dempsey, K.; Wooley, S.; Janssen, X. Changes in sitting time and sitting fragmentation after a workplace sedentary behaviour intervention. Int. J. Environ. Res. Public Health2018,15, 1148. [CrossRef] [PubMed]
14. Cooley, D.; Pedersen, S.; Mainsbridge, C.J. Assessment of the impact of a workplace intervention to reduce prolonged occupational sitting time.J. Qual. Health Res.2014,24, 90–101. [CrossRef] [PubMed]
15. Neuhaus, M.; Healy, G.N.; Dunstan, D.W.; Owen, N.; Eakin, E.G. Workplace sitting and height-adjustable workstations: A randomized controlled trial.Am. J. Prev. Med.2014,46, 30–40. [CrossRef] [PubMed] 16. Shrestha, N.; Kukkonen-Harjula, K.T.; Verbeek, J.H.; Ijaz, S.; Hermans, V.; Pedisic, Z. Workplace interventions
for reducing sitting at work.Cochrane Database Syst. Rev.2018,6, CD010912. [CrossRef] [PubMed]
17. Tew, G.; Posso, M.; Arundel, C.; McDaid, C. Systematic review: Height-adjustable workstations to reduce sedentary behaviour in office-based workers.Occup. Med.2015,65, 357–366. [CrossRef]
18. Neuhaus, M.; Eakin, E.G.; Straker, L.; Owen, N.; Dunstan, D.W.; Reid, N. Reducing occupational sedentary time: A systematic review and meta-analysis of evidence on activity-permissive workstations.Obes. Rev. 2014,15, 822–838. [CrossRef]
19. Chau, J.Y.; van der Ploeg, H.P.; Van Uffelen, J.G.; Wong, J.; Riphagen, I.; Healy, G.N. Are workplace interventions to reduce sitting effective? A systematic review.Br. J. Sports Med.2010,51, 352–356. [CrossRef] 20. Bauman, A.; Nutbeam, D.Evaluation in a Nutshell: A Practical Guide to the Evaluation of Health Promotion
Programs, 2nd ed.; Mcgraw Hill: Sydney, Austrailia, 2013.
21. Green, L.W.; Glasgow, R.E. Evaluating the relevance; generalization; and applicability of research: Issues in external validation and translation methodology.Eval. Health Prof.2006,29, 126–153. [CrossRef]
Behav. Med.2004,27, 3–12. [CrossRef] [PubMed]
24. Whittemore, R.; Knafl, K.J. The integrative review: Updated methodology.J. Adv. Nurs.2005,52, 546–553. [CrossRef] [PubMed]
25. Harden, S.M.; Gaglio, B.; Shoup, J.A.; Kinney, K.A.; Johnson, S.; Brito, F.; Blackman, K.C.A.; Zoellner, J.M.; Hill, J.L.; Almeida, F.A.; et al. Fidelity to and comparative results across behavioral interventions evaluated through the RE-AIM framework: A systematic review.Syst. Rev.2015,4, 155. [CrossRef] [PubMed] 26. Allen, K.; Zoellner, J.; Motley, M.; Estabrooks, P.A. Understanding the internal and external validity of health
literacy interventions: A systematic literature review using the RE-AIM framework.J. Health Commun.2011, 16, 55–72. [CrossRef] [PubMed]
27. Estabrooks, P.; Dzewaltowski, D.; Glasgow, R.; Klesges, L. School-based health promotion: Issues related to translating research into practice.J. Sch. Health2002,73, 21–28. [CrossRef]
28. McGoey, T.; Root, Z.; Bruner, M.W.; Law, B. Evaluation of physical activity interventions in youth via the Reach, Efficacy/Effectiveness, Adoption, Implementation, and Maintenance (RE-AIM) framework: A systematic review of randomised and non-randomised trials. Prev. Med. 2015,76, 58–67. [CrossRef] [PubMed]
29. Aittasalo, M.; Livson, M.; Lusa, S.; Romo, A.; Vähä-Ypyä, H.; Tokola, K. Moving to business–changes in physical activity and sedentary behavior after multilevel intervention in small and medium-size workplaces. BMC Public Health2017,17, 319. [CrossRef]
30. Alkhajah, T.A.; Reeves, M.M.; Eakin, E.G.; Winkler, E.A.; Owen, N.; Healy, G.N. Sit–stand workstations: A pilot intervention to reduce office sitting time.Am. J. Prev. Med.2012,43, 298–303. [CrossRef]
31. Arrogi, A.; Schotte, A.; Bogaerts, A.; Boen, F.; Seghers, J. Short-and long-term effectiveness of a three-month individualized need-supportive physical activity counseling intervention at the workplace. BMC Public Health2017,17, 52. [CrossRef]
32. Ben-Ner, A.; Hamann, D.J.; Koepp, G.; Manohar, C.U.; Levine, J. Treadmill workstations: The effects of walking while working on physical activity and work performance.PLoS ONE2014,9, e88620. [CrossRef] [PubMed]
33. Bort-Roig, J.; Martin, M.; Puig-Ribera, A.; González-Suárez,Á.M.; Martínez-Lemos, I.; Martori, J.C. Uptake and factors that influence the use of ‘sit less; move more’occupational intervention strategies in Spanish office employees.Int. J. Behav. Nutr. Phys. Act.2014,11, 152. [CrossRef] [PubMed]
34. Puig-Ribera, A.; Bort-Roig, J.; Giné-Garriga, M.; González-Suárez, A.M.; Martínez-Lemos, I.; Fortuño, J.; Martori, J.C.; Munoz-Ortiz, L.; Mila, R.; Gilson, N.; et al. Impact of a workplace ‘sit less; move more’program on efficiency-related outcomes of office employees.BMC Public Health2017,17, 455. [CrossRef] [PubMed] 35. Puig-Ribera, A.; Bort-Roig, J.; González-Suárez, A.M.; Martínez-Lemos, I.; Giné-Garriga, M.; Fortuño, J.;
Martori, J.C.; Munoz-Ortiz, L.; Mila, R.; McKenna, J.; et al. Patterns of impact resulting from a ‘sit less; move more’web-based program in sedentary office employees.PLoS ONE2015,10, e0122474. [CrossRef] [PubMed] 36. Brakenridge, C.L.; Fjeldsoe, B.; Young, D.; Winkler, E.; Dunstan, D.; Straker, L. Evaluating the effectiveness of organisational-level strategies with or without an activity tracker to reduce office workers’ sitting time: A cluster-randomised trial.Int. J. Behav. Nutr. Phys. Act.2016,13, 115. [CrossRef] [PubMed]
37. Brakenridge, C.L.; Healy, G.N.; Hadgraft, N.T.; Young, D.C.; Fjeldsoe, B.S. Australian employee perceptions of an organizational-level intervention to reduce sitting.Health Promot. Int.2017. [CrossRef] [PubMed] 38. Carr, L.J.; Leonhard, C.; Tucker, S.; Fethke, N.; Benzo, R.; Gerr, F. Total worker health intervention increases
activity of sedentary workers.Am. J. Prev. Med.2016,50, 9–17. [CrossRef] [PubMed]
39. Carr, L.J.; Karvinen, K.; Peavler, M.; Smith, R.; Cangelosi, K. Multicomponent intervention to reduce daily sedentary time: A randomised controlled trial.BMJ Open2013,3, e003261. [CrossRef]
40. Carr, L.J.; Walaska, K.A.; Marcus, B.H. Feasibility of a portable pedal exercise machine for reducing sedentary time in the workplace.Br. J. Sports Med.2012,46, 430–435. [CrossRef] [PubMed]