Characterization of the Coating and Tablet Core Roughness by
1Means of 3D Optical Coherence Tomography
2Daniel Markl1, Patrick Wahl1, Heinz Pichler1, Stephan Sacher1, Johannes G. Khinast1,2,* 3
4
1Research Center Pharmaceutical Engineering GmbH, Inffeldgasse 13, Graz, Austria 5
2Institute for Process and Particle Engineering, Graz University of Technology, Inffeldgasse 13, Graz, 6
Austria 7
*corresponding authors electronic address: [email protected] 8
9
ABSTRACT
10
This study demonstrates the use of optical coherence tomography (OCT) to simultaneously 11
characterize the roughness of the tablet core and coating of pharmaceutical tablets. OCT is a high 12
resolution non-destructive and contactless imaging methodology to characterize structural properties 13
of solid dosage forms. Besides measuring the coating thickness, it also facilitates the analysis of the 14
tablet core and coating roughness. An automated data evaluation algorithm extracts information 15
about coating thickness, as well as tablet core and coating roughness. Samples removed periodically 16
from a pan coating process were investigated, on the basis of thickness and profile maps of the tablet 17
core and coating computed from about 480,000 depth measurements (i.e., 3D data) per sample. This 18
data enables the calculation of the root mean square deviation, the skewness and the kurtosis of the 19
assessed profiles. Analyzing these roughness parameters revealed that, for the given coating 20
formulation, small valleys in the tablet core are filled with coating, whereas coarse features of the 21
tablet core are still visible on the final film-coated tablet. Moreover, the impact of the tablet core 22
roughness on the coating thickness is analyzed by correlating the tablet core profile and the coating 23
thickness map. The presented measurement method and processing could be in the future transferred 24
to in-line OCT measurements, to investigate core and coating roughness during the production of film-25
coated tablets. 26
Keywords: Optical coherence tomography, solid oral dosage form, coating, roughness, 3D thickness 27
map 28
1.
INTRODUCTION
29Although tablet coating is a well-established unit operation in the pharmaceutical industry, the 30
achievable quality of coating is still limited by the fact that it is a highly complex process, which depends 31
on many parameters. Slight changes of the coating equipment and process parameters may impact 32
the physicochemical properties of the film, and consequently, affect the coating quality. The key 33
descriptors of coating quality, particularly for functional coatings, are film coating thickness and its 34
uniformity. Another important parameter of the dosage form is the roughness of the tablet core and 35
of the coated tablet. It is well known that the roughness of uncoated tablets affects friability (Riippi et 36
al., 1998) and polymer adhesion (Felton, 2013; Rowe, 1978). Surface roughness is further related to 37
the porosity (Bawuah et al., 2014; Rowe, 1978), and thus to the disintegration and dissolution behavior 38
of the tablets. Moreover, the roughness of a film-coated tablet influences the gloss and permeability 39
of the film. The roughness of the tablet core, as well as of the coated tablet, thus impact the dosage 40
form’s properties and its performance. Therefore, measuring the roughness of the uncoated and 41
coated tablet will help to better understand the impact of changes to process parameters and 42
modifications of the formulation on the performance of the solid dosage form. 43
Surface roughness was previously investigated using stylus instruments (Rowe, 1979; 1978), optical 44
microscopy (Seitavuopio et al., 2003), laser profilometer (Seitavuopio et al., 2003), scanning electron 45
(Seitavuopio et al., 2003) and UV imaging (Klukkert et al., 2015). However, these techniques do not 47
allow the characterization of the roughness of the uncoated, and of the coated, tablet simultaneously 48
at the same position. The simultaneous measurement of the roughness of both interfaces enables the 49
analysis of the impact of the tablet core roughness on the coating uniformity, as well as on the 50
roughness of the film coated tablet. Moreover, most techniques are time-consuming and do not 51
facilitate the measuring of a large number of tablets, which is required to calculate significant statistical 52
parameters. 53
The most promising methods to study the roughness of tablet cores and film coatings are optical 54
imaging methods, such as confocal laser scanning microscopy (CLSM) and optical coherence 55
tomography (OCT). Ruotsalainen et al. (Ruotsalainen et al., 2003) used CLSM to study the tablet 56
core/coating interface and the surface of the film-coated tablet. They investigated the effects of 57
spraying air pressure and short-term storage on aqueous hydroxypropyl methylcellulose (HPMC)-58
coated tablets containing an auto-fluorescent agent in the coating solution in order to achieve a good 59
contrast of the coating layer when using CLSM. Recently, we and other research groups have 60
demonstrated how OCT can be applied to measure the coating thickness of tablets (Lin et al., 2015; 61
Markl et al., 2015a; 2015b; Zeitler et al., 2007) and pellets, (Li et al., 2014; Markl et al., 2015c) as well 62
as to study the roughness of uncoated tablets (Juuti et al., 2009). OCT is a high-resolution imaging 63
methodology to produce cross-sectional images of film coatings, in a non-destructive and contactless 64
manner. This modality allows the direct measurement of the coating thickness, based on the 65
knowledge of the refractive index of the coating. The very high acquisition rate of OCT (up to MHz 66
depth scan rates (Wieser et al., 2010)) renders this method a promising tool for the in-line monitoring 67
of coating processes. This has been reported for the coating of tablets in a pan coater (Markl et al., 68
2015a; Lin et al., 2017) as well as the coating of pellets in a fluid-bed coater (Markl et al., 2015c). 69
Different data processing procedures have been developed to rapidly analyze the OCT measurements 70
and to determine the coating thickness at several positions of individual tablets (Markl et al., 2015b, 71
Lin et al., 2015). These data yield significant statistics about the uniformity of the coating as it facilitates 72
the analysis of the intra- and inter-tablet coating variability besides the average coating thickness. 73
This study shows, for the first time, how to analyze the topography of a tablet core and its film-coating 74
at the same location using OCT in a 3D mode. Such an analysis cannot be performed with traditional 75
surface profilometers as they are not capable of providing information about structures below the 76
surface. We employed OCT to investigate the correlation between the uncoated and coated tablet, as 77
well as the coating thickness. This was performed by analyzing 3D OCT data of 11 samples (each 78
consisting of 6 tablets) from different stages of a lab-scale pan coating process. 79
2.
MATERIALS AND METHODS
802.1Materials
81
350 g of round bi-convex tablets were coated in a laboratory-scale pan coater (ProCepT, Zelzate, 82
Belgium), equipped with a 1-L drum and a Schlick spray nozzle, with a 0.8 mm tip. The tablet cores 83
consisted of 50 mg acetylsalicylic acid, lactose monohydrate, microcrystalline cellulose, highly 84
dispersed silicone dioxide (SiO2), starch, talc, and triacetin. The tablet cores (n = 20) had an average 85
tablet diameter of 7.14 mm, thickness of 3.75 mm, curvature radius of 7.56 mm, and weight of 149.7 86
mg. The enteric coating was composed by 42.3% Eudragit L30 D-55, 1.2% triethyl citrate, 6.2% talc and 87
50.3% water. Pan speed, spray rate, inlet air flow rate and inlet air temperature were kept constant 88
throughout the entire coating process at 40 min−1, 1.40 g/min, 0.4 m3/h, and 42°C, respectively. The 89
process ran for 88 minutes, until a total mass of 120 g of coating material was sprayed onto the tablets, 90
yielding a total coating thickness of 51.2 ± 2.8 µm (the standard deviation corresponds to the inter-91
tablet coating variability of 6 samples). The coating thickness as a function of process time is provided 92
in Figure S.1 in the supplementary information. Tablet samples (each sample consists of 6 tablets) were 93
drawn every 8 min, yielding 11 samples in total. The samples are from the coating process (B01) 94
presented in Markl et al.(Markl et al., 2015a), whereas all tablets were measured again with the 3D 95
2.2Optical coherence tomography
97
In OCT an optical beam emitted by a broadband light source (i.e., high spatial but low temporal 98
coherence) is focused onto the surface of the sample. The main part of the light is directly reflected by 99
the surface of the sample. A substantial fraction of the light penetrates into the coating structure and 100
is then reflected back by subsequent interfaces, separating two media with different indexes of 101
refraction, i.e., the coating and the core material. Therefore, coating/tablet core interface is visible if 102
the coating layer is (i) thicker than the resolution limit of the used system (> 10 µm), (ii) the coating 103
does not exhibit high scattering losses due to particles in a size range of the operating wavelength, and 104
(iii) there is a change in refractive index between adjacent media (i.e., air/coating and coating/tablet 105
core). Measuring the optical path length difference between the reflections of the coating surface and 106
the coating/material core interface allows the determination of the coating thickness, based on the 107
knowledge of the refractive index of the coating material. 108
The base OCT system presented previously in Markl et al., 2015a allows the use of two different probes, 109
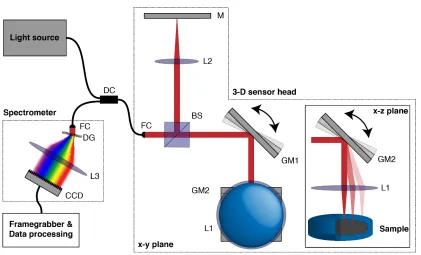
namely a 1D and 3D imaging probe. The latter was employed in this study in order to acquire 3D data 110
of a sample of interest, in an off-line configuration. The light source operates at a central wavelength 111
of 832 nm and has a spectral bandwidth of 75 nm, which provides a theoretical axial resolution of 4.1 112
µm. The 3D imaging probe allows the reconstruction of depth-resolved cross-sections, or volumes, by 113
scanning the probing beam laterally across the sample, with the aid of galvanometer mirrors GM1 and 114
GM2 (Cambridge Technologies), and sub-sequent acquisition of depth scans at successive lateral 115
positions (see Figure 1). The light emerging from the fiber is split at a non-polarizing bulk beam splitter 116
BS (splitting ratio 50/50, Thorlabs) into a reference and a probe beam. The probe beam is focused by 117
an achromatic lens L1 (Thorlabs, focal length, f = 36 mm). This setup provides a theoretical lateral 118
resolution of 10 µm and a depth of focus of 171 µm. The spectrometer consists of a fiber collimator FC 119
(OZ Optics, diameter = 20 mm), a transmissive diffraction grating DG (Wasatch Photonics Inc., Logan, 120
Utah, USA, 1200 lines/mm), an achromatic lens L3 (Thorlabs, focal length = 100 mm) and a line scan 121
camera with a 2048 pixel CCD array (Atmel Aviiva, 14 x 28 µm² pixel size, 12 bit resolution). The output 122
voltage of each CCD pixel is proportional to the number of photons hitting an individual pixel, 123
accumulated during the CCD exposure time of 30 µs. 124
Single depth scans and cross-sections are labelled as A- and B-scans, respectively. Cross-sectional 125
images are synthesized from successive A-scans. Moreover, three-dimensional volumetric data can be 126
created by acquiring sequential B-scans. Throughout this study we analyzed only 3D OCT data 127
consisting of 512 B-scans, which covers a volume of 3.12 x 3.12 x 1.6 mm³; each 2D image has a 128
dimension of 1024 x 1024 (3.12 x 1.6 mm²). The total acquisition time per volume lasts for about 1 129
minute. 130
An automated data evaluation algorithm extracts information about coating thickness, as well as tablet 131
core and coating roughness. This analysis can be carried out either on the basis of cross-sectional 132
images or by using 3D data of the samples. The focus in this study is the analysis of 3D images of the 133
samples removed periodically from a pan coating process. A thickness map and profile maps of the 134
tablet core and coating are computed from about 480,000 depth measurements per sample. This data 135
137
2.3Roughness Analysis
138
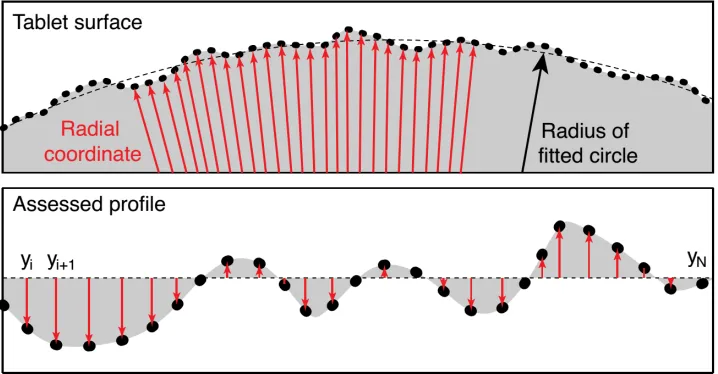
A surface profile is in general defined as the result of an intersection between the surface and a defined 139
plane (Figure 2). In the case of OCT, this plane is a B-scan, which was acquired perpendicular to the 140
tablet face. The data evaluation procedure developed for the coating thickness analysis of 2D OCT 141
images was applied on the 3D volume data. This algorithm was presented in Markl et al. and consists 142
of four stages: (1) converting the raw spectra to image data by applying a non-uniform Fourier 143
transform (Markl et al., 2015b), (2) detecting the air/coating and coating/core interfaces, (3) correcting 144
the coating/core interface from distortions induced by the refraction of the beam on the air/coating 145
interface, and (4) determining the coating thickness. The application of the algorithm on each B-scan 146
of the 3D data allows the generation of a coating thickness map. Moreover, these data facilitate the 147
determination of coating and core profiles from the detected coating interfaces. The coating and core 148
profiles represent the deviations of the air/coating and coating/core interfaces from their respective 149
mean lines. The mean lines of both interfaces are assumed to follow a circle due to the bi-convex shape 150
of the tablets. Consequently, analyzing the roughness of bi-convex tablets requires the determination 151
of the deviations of the actual surface from a circle with a specified radius and center. A circle was 152
therefore fitted in each detected interface and each point on the interface was represented by a polar 153
coordinate, as schematically shown in Figure 2 for the air/coating interface. The radius of the fitted 154
circle was then subtracted from the radial coordinate, yielding the coating and core profiles. 155
The calculated deviation in height of the interfaces from the fitted circle is the surface roughness of 156
the interface. Roughness is typically expressed by statistical parameters, as defined in international 157
standards (e.g., DIN EN ISO 4287). One of the most common descriptors is the root mean squared 158
[image:4.595.89.510.71.326.2]deviation, which can be expressed as 159
𝑅𝑞 = %1 𝑁( 𝑦*+
,
*-. (2.1)
with 𝑦* as the surface height at measurement position 𝑖 (see Figure 2) and 𝑁 as the total number of
160
measurements. Other statistical parameters are skewness (𝑅𝑠𝑘) and kurtosis (𝑅𝑘𝑢), which are defined 161
as 162
𝑅𝑠𝑘 = 1
𝑅𝑞3𝑁( 𝑦*3 ,
*-.
, (2.2)
𝑅𝑘𝑢 = 1
𝑅𝑞5𝑁( 𝑦*5 ,
*-.
. (2.3)
Skewness measures the profile symmetry about the mean line and kurtosis is a descriptor of the 163
sharpness of the profile. A negative 𝑅𝑠𝑘 represents a surface which mainly consists of valleys, whereas 164
a positive value indicates that the surface is predominantly peaks. The kurtosis is a measure for the 165
sharpness of the profile, where a spiky surface will have a high kurtosis value. 166
167
168
2.4Validation of OCT profile measurements
169
The OCT roughness analysis was validated by roughness maps generated by a contact profilometer 170
(Veeco DEKTAK 150), using a 0.9 µm radius tip which can provide a vertical resolution of up to 1 Å. The 171
contact profilometry measurements were performed on the tablet surface covering a range of 3 x 3 172
[image:5.595.119.478.400.587.2]mm² (250 x 3000 px). The acquisition time per profile map was about 1 hour. 173
Figure 2: Schematic of the coating profile generation from the detected air/coating interface. 𝑦* is the height of the surface profile at position 𝑖 for a total of 𝑁
3.
Results and discussion
1743.1Comparison of OCT and contact profilometry
175
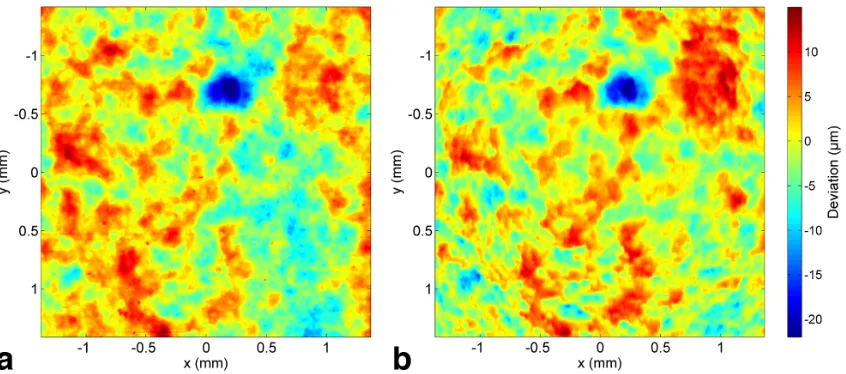
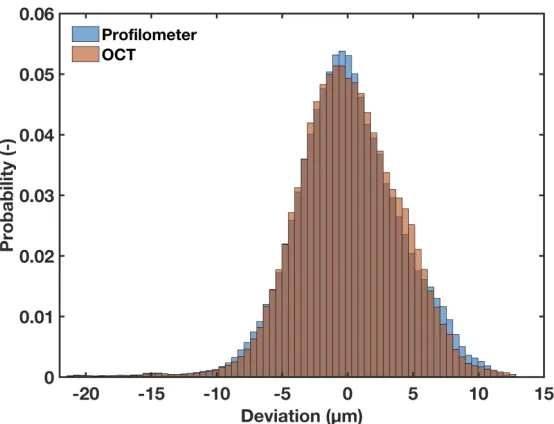
Figure 3 shows 2D roughness maps of one film-coated tablet, by means of contact profilometry and 176
OCT. Both measurements are in very good agreement, which is also indicated by the statistical 177
roughness parameters listed in Table 1 and by the frequency distribution in Figure 4. Slight deviations 178
between the profilometer and OCT measurements are due to the different instrument settings (i.e., 179
scanning range, vertical and horizontal resolution) and due to a slight rotation of the tablet between 180
the two measurements. Moreover, the OCT data suffers from minor distortions which are mainly due 181
to the so-called fan distortion, which is related to the rastering of the surfaces using optical scanners 182
(e.g. galvanometer mirrors). This effect curves the OCT image deeper and it is stronger the farther 183
away from the center. Fan distortion can be corrected by a three-dimensional distortion correction 184
algorithm as proposed by Ortiz et al., 2010. 185
186 187 188 189 190 191 192
[image:6.595.88.511.447.634.2]193
Figure 3: 2D roughness maps of a final film-coated tablet at the same position using (a) contact profilometry and (b) 3D OCT. The color bar is valid for both figures. The statistical roughness parameters of both measurements are given in Table 1.
Table 1: Statistical roughness parameters from contact profilometry and OCT of the same tablet (sample from process time 88 mins). The data is shown in Figure 3.
Contact
profilometry OCT
𝑅𝑞 µm 3.98 4.09
𝑅𝑠𝑘 - -0.23 -0.23
194
3.2Correlation between coating profile, tablet core profile and coating thickness
195
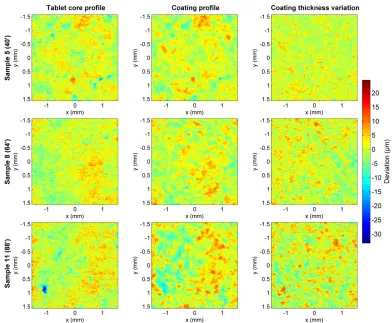
In the following we focus on the results from the OCT measurements, allowing the measurement of a 196
much larger number of tablets due to the high acquisition rate, as well as due to the advantage of 197
measuring the coating and the tablet core profile simultaneously (Figure 5). Further results are shown 198
in Figure S.2 in the supplementary information. Comparing the core and the coating profiles reveals 199
that small valleys of the tablet core profile are filled with coating. However, larger valleys and peaks in 200
[image:7.595.159.436.75.287.2]the core are still present in the coating. 201
202
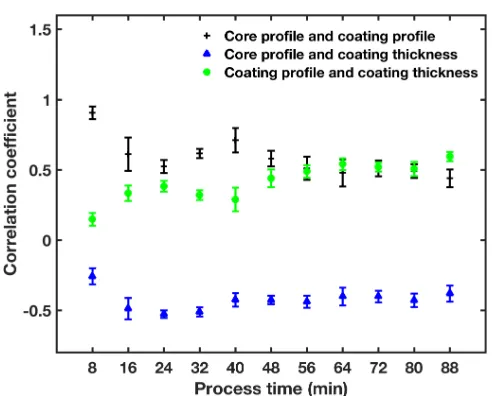
A more detailed investigation of the relation between the core profile, coating profile and the coating 203
thickness can be performed by calculating correlation coefficients (Figure 6). As expected, a weak 204
linear correlation (coefficient close to 0) at the early stages of the coating process can be observed for 205
the core profile/coating thickness. This is also true for the coating profile and coating thickness. On the 206
contrary, the coating profile and the core profile are highly correlated, i.e. both profiles are almost 207
identical, as the coating is still very thin and thus below the resolution limit of OCT at this stage of the 208
process. The most significant changes of the coefficients occur in the first half of the coating process 209
(< 48 min), where the average coating thickness is < 28 µm. The correlation coefficient between the 210
coating and core profile approaches 0.5, which evidences that the final coating profile still represents 211
features from the original core profile. The negative correlation coefficient of the core profile and 212
coating thickness variation reflects a negative linear dependence between these two variables, which 213
indicates that a valley or a peak in the core profile causes a larger or smaller coating thickness, 214
[image:8.595.100.492.73.396.2]respectively. 215
216
3.3Statistical roughness parameters
217
The correlation of the different profiles can be further analyzed on the basis of the statistical roughness 218
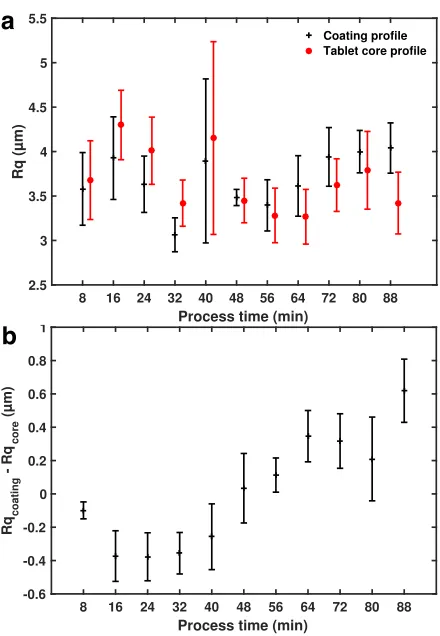
parameters (𝑅𝑞, 𝑅𝑠𝑘 and 𝑅𝑘𝑢). The root mean square deviation for the coating and the core profile is 219
illustrated in Figure 7a. 𝑅𝑞 deviates at the beginning of the process (< 24 min) from the values at the 220
end of the process, even though the roughness of the tablet cores should be similar throughout all 221
measurements. We want to remind the reader at this point that tablets were drawn from the process 222
at each stage for the analysis and they were not returned to the process. Although the tablet cores are 223
from the same batch, the roughness of the tablet cores clearly varies as indicated by the standard 224
deviation of the tablet core 𝑅𝑞 as well as by the difference in average 𝑅𝑞 between each process stage. 225
The coating roughness is constant towards the end of the process in contrast to the tablet core 226
roughness, which indicates that the coating process compensates, to a certain extent, the roughness 227
variations of the tablet cores. Moreover, the timely deviation of the tablet core 𝑅𝑞 is primarily due to 228
the thin coating layer (15 µm at 24 min) at the beginning of the process, which cannot be accurately 229
resolved by the OCT system in use, causing a misdetection of the tablet core interface. The large 230
standard deviation at process time 40 min is due to a defect, which is discussed below on the basis of 231
the kurtosis. 232
However, the roughness of the tablet at process times < 48 min is higher than that of the coating 233
surface, as the coating droplets preferentially fill in irregularities in the tablet core which causes a 234
smoother surface (Figure 7). On the contrary, the coating is slightly rougher than the core towards the 235
end of the process. The roughness of the coating surface strongly depends on the coating application 236
conditions, as was shown by Twitchell et al., 1995. The authors stated, on the basis of light section 237
microscope measurements, that increasing the spray gun-to-bed distance, changing the spray shape 238
from a narrow cone to a wide flat spray or decreasing the atomizing air pressure produce rougher 239
surfaces. 240
[image:9.595.175.421.71.269.2]241
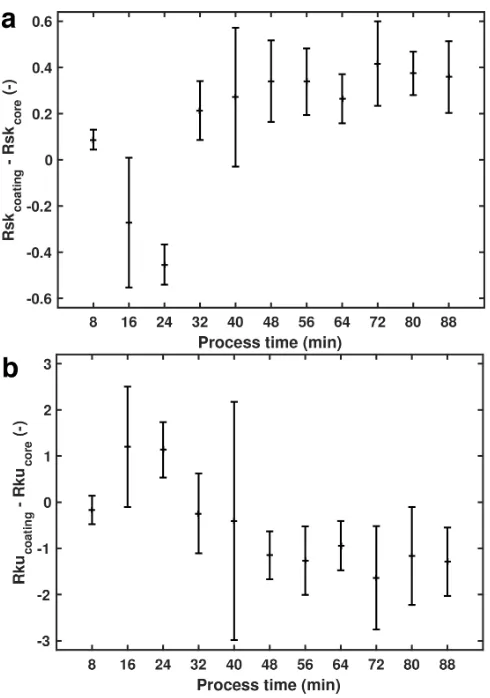
The roughness difference between coating and core profile can also be characterized by the skewness 242
and kurtosis of both profiles (Figure 8). Similar to the changes in 𝑅𝑞, we also observe a change in 𝑅𝑠𝑘
243
and in 𝑅𝑘𝑢, at the middle of the process. A smoother surface of the coated tablet is also supported by 244
the kurtosis values. We would like to remind the reader at this point that kurtosis is a measure for 245
sharpness and a spiky surface will have a high kurtosis value. The kurtosis difference, as shown in Figure 246
8b, thus highlights that the tablet surface is smoother (less spiky surface) after coating (𝑅𝑘𝑢coating <
247
𝑅𝑘𝑢core). However, it may be preferable to have a rough tablet core surface, which would provide
248
greater interfacial contact between coating solution and tablet. A rougher surface, and thus a larger 249
surface area, causes stronger adhesion bonds between the tablet and the film (Nadkarni et al., 1975). 250
Figure 7: Analysis of the root mean square deviation as a function of process time. (a) Average
𝑅𝑞 ± standard deviation (errorbar) for each profile. The process time of the tablet core profile was shifted by 2 min in order to enhance the visibility of all data points. (b) The average and standard deviation values are calculated from the differences between 𝑅𝑞 of the coating and the core profile of each tablet.
8 16 24 32 40 48 56 64 72 80 88
Process time (min) -0.6
-0.4 -0.2 0 0.2 0.4 0.6 0.8 1
Rq
coating
- Rq
core
(µm)
8 16 24 32 40 48 56 64 72 80 88
Process time (min)
2.5 3 3.5 4 4.5 5 5.5
Rq (µm)
[image:10.595.187.407.74.392.2]Coating profile Tablet core profile
a
251
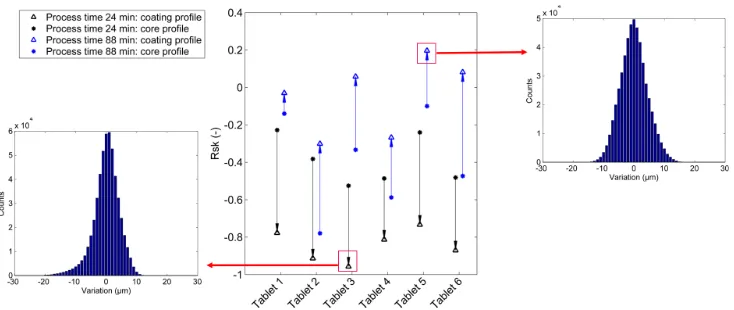
Figure 9 depicts the skewness of individual tablets drawn from the process at 24 min and 88 min 252
(process end). The skewness of the tablet core is larger at the beginning of the process than that of the 253
coating, whereas the absolute value of the tablet core skewness is closer to 0 (see data of process time 254
24 min in Figure 9). In contrast to the beginning of the process, the data follows a normal distribution 255
at the end of the process and is thus more symmetrical (i.e. skewness value is closer to 0). Therefore, 256
at the early stages of the process the coating negatively impacts the surface symmetry by forming 257
additional valleys (𝑅𝑠𝑘coating < 𝑅𝑠𝑘core< 0). The coating positively impacts the roughness symmetry 258
at the end of the coating process, as indicated by the skewness of the coating, which is closer to 0 than 259
that of the core profile. 260
The large standard deviation at process time 40 min is due to a defect in the tablet core, as illustrated 261
in Figure 10. Since the tablets are not the same for different process stages, this defect can only be 262
observed in the results from one tablet drawn from the process at 40 min. The tablet with this defect 263
is also an outlier in the 𝑅𝑠𝑘 and in the 𝑅𝑞 analysis. However, the kurtosis is highly sensitive to such 264
local and small defects, which could have a major impact on the performance of this tablet. It can be 265
clearly observed, by comparing the tablet core and coating profiles, that the defect is in the tablet core. 266
The core profile has a higher value than the coating profile, meaning that negative spikes are filled with 267
coating. However, 𝑅𝑞 of the coating and of the core (Figure 7) showed that the final coated surface is 268
in general rougher than the surface of the tablet core, but it is more symmetric and less spiky than the 269
original surface, as indicated by 𝑅𝑠𝑘 and 𝑅𝑘𝑢. 270
Such data can be used to gain more insight into the impact of the core roughness on the overall coating 271
uniformity. In particular, analyzing how closely the coated tablet surface follows the uncoated tablet 272
surface strongly depends on the process conditions. It is thus of great interest to have a fast and non-273
[image:11.595.175.420.76.425.2]destructive tool, such as OCT, to investigate the roughness of the tablet core and coating, on the basis 274
of statistical roughness parameters. 275
276 277 278
279
4.
Conclusion
280This study reports how the surface roughness evolves during a tablet coating process, by comparing 281
tablet core profile and coating profile using 3D OCT measurements of a part of a tablet face. The data 282
reveal that small valleys are filled with coating, whereas coarse features of the tablet core are visible 283
on the final film-coated tablet. This clearly affects the coating uniformity, as observed in the correlation 284
between the coating thickness variation and the core profile. In addition, the presented concept could 285
be used to detect defects and irregularities in the tablet core, as well as in the coating surface, with 286
one single measurement. Such a detailed investigation cannot be performed with a contact 287
profilometer, which only provides data on the final dosage form surface. In this study we focused on 288
[image:12.595.97.464.112.267.2]investigating the tablet faces and the results may vary for the tablet band or the surface close to the 289
[image:12.595.97.463.375.530.2]Figure 9: Skewness of six tablets which were randomly drawn from the process after 24 min (black) and after 88 min (blue). The arrows point from the core to the coating value of the same tablet.
edges as it is well known that the coating thickness differs between the tablets faces, the edges and 290
the tablet band. OCT is capable of measuring the tablet band, but it may provide inaccurate 291
measurements of the coating close to the edges. 292
Moreover, the presented concept could be further transferred to in-line OCT measurements (Markl et 293
al., 2015a), allowing the investigation of core and coating roughness during production. Specifically, 294
for functional and active coatings, slight changes of the coating equipment and process parameters 295
may impact the physicochemical properties of the film, and may thus affect the coating quality. The 296
applicability of OCT to measure functional or active coatings primarily depends on the used coating 297
formulation, which may cause strong scattering losses leading to a reduced penetration depth and 298
limiting the maximum detectable coating thickness. 299
However, monitoring and controlling coating quality is of great importance to prevent output risks, 300
including batch reprocessing, batch reject and product recall. Characterizing coating properties such 301
as coating thickness, coating uniformity as well as roughness is therefore critical for the purpose of 302
quality control and quality assurance. 303
ACKNOWLEGMENT
304
This work has been funded within the Austrian COMET Program under the auspices of the Austrian 305
Federal Ministry of Transport, Innovation and Technology (bmvit), the Austrian Federal Ministry of 306
Economy, Family and Youth (bmwfj) and by the State of Styria (Styrian Funding Agency SFG). COMET 307
is managed by the Austrian Research Promotion Agency FFG. 308
REFERENCES
310
Bawuah, P., Mendia, A.P., Silfsten, P., Pääkkönen, P., Ervasti, T., Ketolainen, J., Zeitler, J.A., Peiponen, 311
K.-E., 2014. Detection of porosity of pharmaceutical compacts by terahertz radiation 312
transmission and light reflection measurement techniques. International Journal of 313
Pharmaceutics 465, 70–76. doi:10.1016/j.ijpharm.2014.02.011 314
Felton, L.A., 2013. Mechanisms of polymeric film formation. Int J Pharm 457, 423–427. 315
doi:10.1016/j.ijpharm.2012.12.027 316
Juuti, M., Tuononen, H., Prykäri, T., Kontturi, V., Kuosmanen, M., Alarousu, E., Ketolainen, J., Myllylä, 317
R., Peiponen, K.-E., 2009. Optical and terahertz measurement techniques for flat-faced 318
pharmaceutical tablets: a case study of gloss, surface roughness and bulk properties of starch 319
acetate tablets. Measurement Science and Technology 20, 015301. doi:10.1088/0957-320
0233/20/1/015301 321
Klukkert, M., Wu, J.X., Rantanen, J., Rehder, S., Carstensen, J.M., Rades, T., Leopold, C.S., 2015. Rapid 322
Assessment of Tablet Film Coating Quality by Multispectral UV Imaging. AAPS PharmSciTech 17, 323
958–967. doi:10.1208/s12249-015-0414-x 324
Li, C., Zeitler, J.A., Dong, Y., Shen, Y.-C., 2014. Non-Destructive Evaluation of Polymer Coating 325
Structures on Pharmaceutical Pellets Using Full-Field Optical Coherence Tomography. Journal of 326
Pharmaceutical Sciences 103, 161–166. doi:10.1002/jps.23764 327
Lin, H., Dong, Y., Shen, Y., Zeitler, J.A., 2015. Quantifying Pharmaceutical Film Coating with Optical 328
Coherence Tomography and Terahertz Pulsed Imaging: An Evaluation. Journal of Pharmaceutical 329
Sciences 104, 3377–3385. doi:10.1002/jps.24535 330
Lin, H., Dong, Y., Markl, D., Williams, B.M., Zheng, Y., Shen, Y., Zeitler, J.A., 2017. Measurement of the 331
Intertablet Coating Uniformity of a Pharmaceutical Pan Coating Process With Combined 332
Terahertz and Optical Coherence Tomography In-Line Sensing. Journal of Pharmaceutical 333
Sciences 106(4), 1075-1084. doi:10.1016/j.xphs.2016.12.012 334
Markl, D., Hannesschläger, G., Sacher, S., Leitner, M., Buchsbaum, A., Pescod, R., Baele, T., Khinast, 335
J.G., 2015a. In-Line Monitoring of a Pharmaceutical Pan Coating Process by Optical Coherence 336
Tomography. Journal of Pharmaceutical Sciences 104, 2531–2540. doi:10.1002/jps.24531 337
Markl, D., Hannesschläger, G., Sacher, S., Leitner, M., Khinast, J., Buchsbaum, A., 2015b. Automated 338
pharmaceutical tablet coating layer evaluation of optical coherence tomography images. 339
Measurement Science and Technology 26, 1–12. doi:10.1088/0957-0233/26/3/035701 340
Markl, D., Zettl, M., Hannesschläger, G., Sacher, S., Leitner, M., Buchsbaum, A., Khinast, J.G., 2015c. 341
Calibration-free in-line monitoring of pellet coating processes via optical coherence tomography. 342
Chemical Engineering Science 125, 200–208. doi:10.1016/j.ces.2014.05.049 343
Nadkarni, P.D., Kildsig, D.O., Kramer, P.A., Banker, G.S., 1975. Effect of surface roughness and coating 344
solvent on film adhesion to tablets. Journal of Pharmaceutical Sciences 64, 1554–1557. 345
doi:10.1002/jps.2600640931 346
Ortiz, S., Siedlecki, D., Grulkowski, I., Remon, L., Pascual, D., Wojtkowski, M., Marcos, S., 2010. Optical 347
distortion correction in Optical Coherence Tomography for quantitative ocular anterior segment 348
by three-dimensional imaging. Optics Express 18, 2782–2796. doi:10.1364/OE.18.002782 349
Riippi, M., Antikainen, O., Niskanen, T., Yliruusi, J., 1998. The effect of compression force on surface 350
structure, crushing strength, friability and disintegration time of erythromycin acistrate tablets. 351
European Journal of Pharmaceutics and Biopharmaceutics 46, 339–345. doi:10.1016/S0939-352
6411(98)00043-5 353
Rowe, R.C., 1979. Surface roughness measurements on both uncoated and film-coated tablets. 354
Pharmacy and Pharmacology Communications 31, 473–474. doi:10.1111/j.2042-355
7158.1979.tb13557.x 356
Rowe, R.C., 1978. The measurement of the adhesion of film coatings to tablet surfaces: the effect of 357
tablet porosity, surface roughness and film thickness. Journal of Pharmacy and Pharmacology 30, 358
343–346. doi:10.1111/j.2042-7158.1978.tb13252.x 359
Ruotsalainen, M., Heinämäki, J., Guo, H., Laitinen, N., Yliruusi, J., 2003. A novel technique for imaging 360
Pharmaceutics and Biopharmaceutics 56, 381–388. doi:10.1016/S0939-6411(03)00118-8 362
Seitavuopio, P., Heinämäki, J., Rantanen, J., Yliruusi, J., 2006. Monitoring tablet surface roughness 363
during the film coating process. AAPS PharmSciTech 7, E1–E6. doi:10.1208/pt070231 364
Seitavuopio, P., Rantanen, J., Yliruusi, J., 2003. Tablet surface characterisation by various imaging 365
techniques. Int J Pharm 254, 281–286. doi:10.1016/S0378-5173(03)00026-7 366
Twitchell, A.M., Hogan, J.E., Aulton, M.E., 1995. Assessment of the thickness variation and surface 367
roughness of aqueous film coated tabelts using a ligh-section microscope. Drug Development 368
and Industrial Pharmacy 21, 1611–1619. doi:10.3109/03639049509069251 369
Wieser, W., Biedermann, B. R., Klein, T., Eigenwillig, C. M., Huber, R, 2010. Multi-Megahertz OCT: 370
High quality 3D imaging at 20 million A-scans and 45 GVoxels per second. Optics Express 18, 371
14685. doi:10.1364/OE.18.014685 372
Zeitler, J.A., Shen, Y., Baker, C., Taday, P.F., Pepper, M., Rades, T., 2007. Analysis of Coating 373
Structures and Interfaces in Solid Oral Dosage Forms by Three Dimensional Terahertz Pulsed 374
Imaging. Journal of Pharmaceutical Sciences 96, 330–340. doi:10.1002/jps.20789 375