City, University of London Institutional Repository
Citation
:
Vouros, G., Vlachou, A., Santipantakis, G., Doulkeridis, C., Pelekis, N.,Georgiou, H., Theodoridis, Y., Patroumpas, K., Alevizos, E., Artikis, A., Fuchs, G., Mock, M., Andrienko, G., Andrienko, N., Claramunt, C., Ray, C., Camossi, E. & Jousselme, A-L. (2018). Increasing maritime situation awareness via trajectory detection, enrichment and recognition of events. Lecture Notes in Computer Science (including subseries Lecture Notes in Artificial Intelligence and Lecture Notes in Bioinformatics), 10819, pp. 130-140. doi: 10.1007/978-3-319-90053-7_13
This is the accepted version of the paper.
This version of the publication may differ from the final published
version.
Permanent repository link:
http://openaccess.city.ac.uk/20034/Link to published version
:
http://dx.doi.org/10.1007/978-3-319-90053-7_13Copyright and reuse:
City Research Online aims to make research
outputs of City, University of London available to a wider audience.
Copyright and Moral Rights remain with the author(s) and/or copyright
holders. URLs from City Research Online may be freely distributed and
linked to.
Increasing Maritime Situation Awareness via Trajectory
Detection, Enrichment and Recognition of Events
G.A. Vouros1, A. Vlachou1, G. Santipantakis1, C. Doulkeridis1, N. Pelekis1, H.
Geor-giou1, Y. Theodoridis1, K. Patroumpas1, E. Alevizos2, A. Artikis1,2, G. Fuchs3, M.
Mock3, G. Andrienko3, N. Andrienko3, C. Claramunt4, C. Ray4, E. Camossi5 and
A.-L. Jousselme5
1
University of Piraeus, Greece
2
IIT, NCSR ‘D’, Greece
3
Fraunhofer Institute IAIS Sankt Augustin, Germany
4
Naval Academy Research Institute, France
5
CMRE, La Spezia, Italy
Abstract. The research presented in this paper aims to show the deployment and use of advanced technologies towards processing surveillance data for the detection of events, contributing to maritime situation awareness via trajecto-ries’ detection, synopses generation and semantic enrichment of trajectories. We first introduce the context of the maritime domain and then the main princi-ples of the big data architecture developed so far within the European funded H2020 datAcron project. From the integration of large maritime trajectory da-tasets, to the generation of synopses and the detection of events, the main func-tions of the datAcron architecture are developed and discussed. The potential for detection and forecasting of complex events at sea is illustrated by prelimi-nary experimental results.
Keywords: Big Spatio-temporal Data, Moving Objects, Trajectory Detection, Data Integration, Events Recognition/Forecasting.
1
Introduction
The datAcron project considered and defined maritime scenarios [2] that address operational concerns regarding fishing activities, highlighting the need for continuous (real-time) tracking of fishing vessels and surrounding traffic, as well as contextually enhanced offline data analytics. The secure fishing scenarios are designed to demon-strate our ability to detect and foresee situation indicators regarding collisions be-tween ships and vessels in distress optimizing rescuing operations. In addition to these, we are particularly interested on maritime sustainable development scenarios, where we aim at monitoring the impact of fishing activities, including the illegal ones. In particular, the protection of areas from fishing scenario tackles Illegal Unreported Unregulated (IUU) fishing, which is a global threat to the preservation of maritime ecosystems and could potentially undermine the sustainable development in large areas of the world that depend on maritime resources. In this scenario, we aim to sup-port authorities dealing with real-time monitoring of protected areas and areas where fishing is restricted, by predicting and detecting vessels entering the surveyed areas. The user needs to forecast whether and when a vessel enters, exits, sails or spends time in such areas.
This paper aims to show the deployment and use of advanced technologies devel-oped by the datAcron project (www.datacron-project.eu) towards events’ recognition in the protection of areas from fishing scenario. The objective is to demonstrate the part of the overall datAcron architecture that processes surveillance data for the detec-tion of events, contributing to maritime situadetec-tion awareness via trajectories’ detecdetec-tion, synopses generation and semantic enrichment of trajectories. The rest of the paper is organized as follows. First, section 2 describes the overall datAcron big data architec-ture. Next, the trajectory enrichment and detection, as well as events’ forecasting: Technologies to be demonstrated are described in sections 3 and 4. Finally Section 5 draws the conclusions and outline further work.
2
A Big Data Architecture for Time Critical Mobility
Forecasting
Time critical mobility operations in the maritime domain require integrating data that stems from a wide variety of diverse data sources, both archival (data-at-rest) and online (data-in-motion), which is also voluminous and produced at high rates. During data acquisition, various tasks need to be performed, including data cleaning, com-pression, transformation to a common representation model, data integration and in-terlinking. Besides real-time operations that must be supported with minimum latency requirements (i.e., in real-time), there exists a need for offline analysis to extract use-ful knowledge.
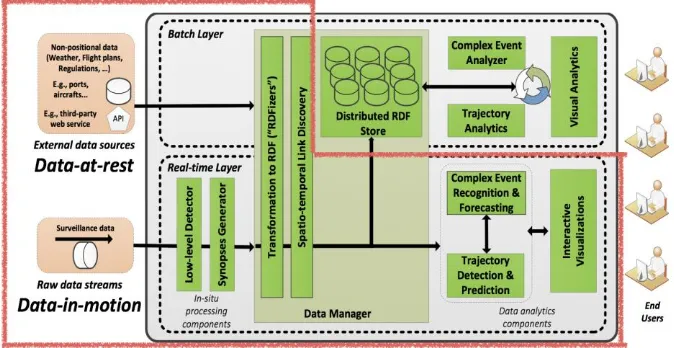
The real-time layer, which is the subject of this paper, involves feeding into the system streaming surveillance data describing the positions of moving objects, col-lected from terrestrial and satellite receivers. While consuming this data, statistics (min/max/avg) are computed over properties, such as speed and acceleration, in an online fashion; online data cleaning of erroneous data, and trajectory compression, are performed. Then, compressed trajectories (i.e., trajectory synopses) generated are transformed to RDF, according to the datAcron ontology [12], thereby facilitating the computation of links with relevant data originating from other sources. To this end, spatio-temporal link discovery is performed that discovers relations between surveil-lance data and archival data (e.g., weather, contextual data), resulting in enriched trajectories. Further online analysis of enriched trajectories is performed, aiming at: (a) deriving predictions of the future location of a moving object, and (b) complex event recognition and forecasting. Finally, real-time visualizations support human interaction with the datAcron system.
Fig. 1. The overall datAcron system architecture and the demonstrated components indicated by the cover (red) polygon.
In the batch layer, both the enriched trajectories as well as data from other sources that have been transformed in RDF are collected for persistent storage, in order to support offline data analytics. Due to the immense data volume, parallel data pro-cessing is performed over RDF data stored in a distributed way. On top of the distrib-uted RDF store, high-level data analysis tasks run, in order to perform trajectory anal-ysis as well as building models for complex event forecasting using machine learning techniques. Visual analytics provide the ability to discover hidden knowledge and patterns, by means of interaction with a domain expert or a data analyst.
[image:4.595.128.465.338.512.2]harnessing the scalability and low latency offered. For batch processing and analysis, we have selected Apache Spark which is the most popular batch processing frame-work to-date, achieving scalability, high performance, and exploiting in-memory processing. The stream-based communication between components is achieved by means of Apache Kafka.
This article concerns the streaming layer and describes the processing stages per-formed from congesting surveillance data to visualizations of trajectories detected and of events recognized and forecasted. However, it is separated in two parts: trajectory detection and complex events recognition and forecasting.
3
Trajectory Detection
The section describes the functionalities of components involved in the data inte-gration and enrichment part of the overall framework: (a) The in-situ processing com-ponent for cleansing and enrichment of surveillance data with derived information (e.g. average speed), as well as for the detection of low-level events; (b) trajectories’ synopses generation from raw streaming surveillance data via the detection and tag-ging of critical points, and (c) RDF generation of trajectory synopses and their linking to other data sources for the provision of enriched trajectories.
3.1 In-situ Processing and Low-level Events Detection
The low-level event detection component is aiming at enriching the raw-data gen-erated by the moving entities with basic derived attributes that serve as input for high-er-level processing. A major consideration in this low level is to achieve enrichment with low-latency, preferably by so-called “in-situ” processing. In-situ processing refers in general to the case of processing streaming data as “downwards” in-stream as possible. Processing streaming data close to data source provides a number of in-herent advantages, such as decreased communication delays, savings in communica-tion, and reduced overhead in sub-sequent evaluation steps. The low-level events refer to two basic datAcron tasks to be performed in real-time on the trajectories: generating metadata on incoming raw data for detection of erroneous data and ensur-ing data quality, and enrichensur-ing the data stream with contextual information for further analysis. For supporting the data quality assessment, attributes of min/max, medi-an/average of properties (e.g. speed, acceleration, etc.) are generated on a per trajecto-ry basis. In addition to that, raw position data are enriched with low-level events of entering or leaving of moving entities from one area to another one, by processing the real-time stream of moving entity positions.
3.2 Synopses Generation
trajectory segments of “normal” motion characteristics, since most vessels usually follow almost straight, predictable routes at open sea. Indeed, a large amount of raw positional updates may be suppressed, while only retaining locations that signify changes in actual motion patterns [15]. We opt to avoid costly trajectory simplifica-tion algorithms like [6][7] operating in batch fashion, online techniques employing sliding windows [8], or safe area bounds for choosing samples [7], as well as more complex, error-bounded methods. Instead, emanating from the novel trajectory sum-marization framework introduced in [11] for online maritime surveillance, but signifi-cantly enhanced with additional noise filters, the Synopses Generator applies single-pass heuristics for achieving succinct, lightweight representation of trajectories. We prescribe that each trajectory can be approximately reconstructed from judiciously chosen critical points of the following types:
- Stop: It indicates that an object remains stationary (i.e., not moving) by checking whether its instantaneous speed is lower than a threshold (e.g., 0.5 knots) over a peri-od of time.
- Slow motion: It signifies that an object consistently moves at low speed (e.g., < 5 knots) over a period of time.
- Change in Heading: Once there is an angle difference in heading of more than a
given threshold (e.g., > 5) with respect to the mean velocity vector (computed over
the most recent course of a given object), its current location should be emitted as critical.
- Speed change: Such critical points are issued once the rate of change for speed exceeds a given threshold (e.g., > 25%) with respect to its mean speed over a recent time interval.
- Communication gaps: These occur when an object has not emitted a message over a time period, e.g., the past 10 minutes.
Critical points can be emitted at operational latency (i.e., within milliseconds) and high throughput. Hence, this derived stream of trajectory synopses can keep in pace with the incoming raw streaming data. This module can also achieve dramatic com-pression over the raw streaming data with tolerable error in the resulting approxima-tion. At lower or moderate input arrival rates, data reduction is quite large (around 80% with respect to the input data volumes), but in few cases of very frequent posi-tion reports, compression ratio can even reach 99% without harming the quality of the derived trajectory synopses.
3.3 RDF Generation and Data Integration
The next step of the data processing workflow is to convert the synopses generated to RDF and integrate them to archival data into a knowledge graph. Since several different sources are blended into our domain, we designed and implemented a gener-ic RDF generation framework. Triples generated from the RDF generators are di-rected to a group of Link Discovery components.
and accept the data provided. It applies naive data cleaning, computes and converts values, applies simple filters, and generates values from the incoming entries, e.g. extracting the Well-Known-Text representation of a given geometry in a Shapefile. The output of these connectors is directed to instances of the triple generator compo-nent.
The triple generator is responsible to convert all the data coming through the data connector, into meaningful triples w.r.t. the datAcron ontology [12]. This component depends on the use of graph templates and variable vectors. The variables vector ena-bles transparent reference to variaena-bles and use of their values. The graph template on the other hand, uses these variables into triple patterns, i.e. triples where any of the subject or object can be either a variable or a function with variable arguments.
In contrast to other RDF generators, the proposed method needs no further knowledge of a specific vocabulary (e.g. compared to RML [3]), and it can be used by anyone who can write simple SPARQL queries. Furthermore, it requires no underly-ing SPARQL engine, and it inherently supports parallelization and streamunderly-ing data sources (e.g. compared to SPARQL-Generate [5] and GeoTriples [4]). In addition to these, the variables vector enables the RDF generation method to establish mappings to data “to-be-generated”, and they are not explicitly available in the source (e.g., the MBR or the WKT of a geometry).
3.4 Link Discovery
The output of the RDF generators is further exploited for the detection of associa-tions between entities, or the enrichment of the generated RDF graph with additional information from any of the sources available.
The link discovery component detects spatio-temporal and proximity relations such as “within” and “nearby” relations between stationary and/or moving entities. It is noteworthy that there is not much work on the challenging topic of spatio-temporal link discovery, nor on link discovery over streaming datasets. State of the art ap-proaches such as [10], [13], [14] focus on spatial relations in static archival datasets only. In particular RADON [13] employs optimizations that can be only applied if the datasets are a-priori accessible as a whole, which cannot be assumed for streaming datasets. Our work addresses explicitly proximity and spatio-temporal relations in both archival and streaming data sources.
The implemented component continuously applies SPARQL queries on each RDF graph fragment produced by an RDF generator, to filter only those triples relevant to the computation of a relation. It applies a blocking method to organize entities (either being moving or stationary entities), and a refinement function to evaluate pairs of entities in any block.
computes the complement of the union of those spatial areas that correspond to
enti-ties in a cell and intersect with the cell’s area: This cell area is called the mask of cell.
Thus, for each new entity we identify the enclosing cell, and then we evaluate that entity against the spatial mask of the cell. If it is found to be in the mask, we do not need to further evaluate any candidate pair with entities in that cell. In addition to masks, the link discovery component uses a book-keeping process for cleaning the grid, towards identifying proximity relations among entities when dealing with streamed data.
4
Complex Events Recognition and Forecasting
This section shows the on-line recognition and forecasting of events which are visual-ized together with the visualization of enriched stream of trajectories. This involves the Complex Events’ Recognition and Forecasting module consuming the enriched stream of trajectories’ synopses and streaming out events. Besides the critical points generated by the synopses generator, this module also consumes, in the form of events, extra information provided by the link discovery component, especially the spatial relations between vessels and areas.
Given the enriched stream of synoptic trajectories (i.e. streams of trajectory critical points linked with low level events, weather features and contextual information) and a set of patterns defining relations between low-level events, operational constraints and contextual information, we need to detect, in a timely manner, when patterns’ relations (involving temporal and spatial aspects) are satisfied. Whenever this hap-pens, a high-level (complex) event has been detected. In addition, we need to forecast the occurrence of complex events.
4.1 Event Detection and Forecasting
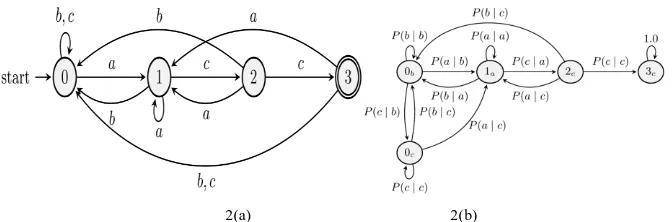
2(a) 2(b)
Fig. 2. (a) DFA and (b) corresponding Markov Chain.
Once we have obtained the PMC corresponding to an initial pattern, we can com-pute certain distributions that are useful for forecasting. At each time point the DFA and the PMC will be in a certain state, the question we need to answer is the follow-ing: how probable is it that the DFA will reach its final state (and therefore a complex
event will be detected) in k time steps from now (waiting-time distribution)?
Forecasts are provided in the form of time intervals, like I=(start, end). Such a forecast specifies that the DFA is expected to reach a final state in the future between
start and end with a probability of at least a given constant threshold θ (provided by end-user). These intervals are produced by a single-pass algorithm that scans a wait-ing-time distribution and finds the smallest (in terms of length) interval that exceeds this threshold. This method has been implemented in the Scala programming lan-guage in a system called Wayeb.
4.2 Use Cases
Several maritime scenarios and related events have been defined in [2] and event patterns have been formalized and implemented. We evaluated event detection and prediction using real vessel data obtained through the Automatic Identification Sys-tem (AIS). The dataset includes approximately 18 million of AIS positions transmit-ted by about 5,000 vessels sailing in the Atlantic Ocean around the port of Brest, France, between October 2015 and March 2016. Moreover, several navigation fea-tures such areas of interest, coastlines, ports locations… have been considered.
Amongst experiments realized, Figure 3 illustrates events from one pattern applied to a single vessel and one area of interest. The aim is to predict when the vessel is expected to enter the area. This “within” event is of crucial importance for the early detection and prevention of possible collisions: Maritime experts need to know whether a cargo vessel is heading towards a fishing area, since this indicates a possi-bility of collision.
thresholds defined with experts), have a high probability of leading to a “within” rela-tion (the vessel steadily approaches the area).
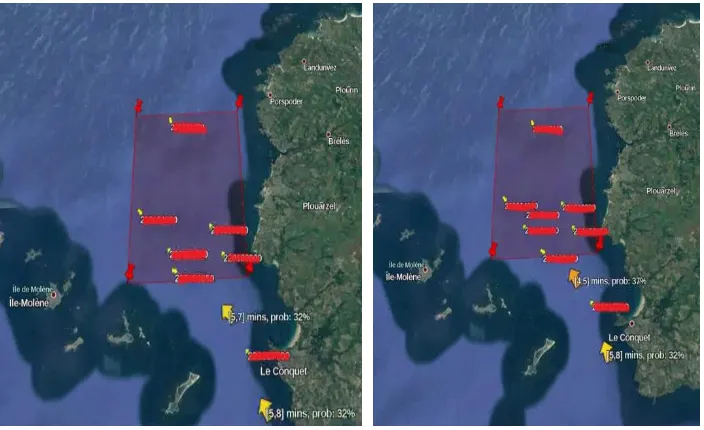
[image:10.595.125.477.293.508.2]Figure 3 shows an area (red rectangle) and vessels (enlarged arrows) along two similar routes. The arrow informs us (left Figure) that the vessels are expected to enter the area in 5 to 7 minutes with a probability at least 32% (resp. 5 to 8 minutes, 32 %). The other arrow in between has no such interval because it is on a route that does not cross the area (the vessel’s identities have been erased for privacy reasons). Results showed that, the closer the vessel is to the area, the higher the precision becomes and the smaller the forecast intervals (Figure 3, left). Additionally, when the vessel fol-lows a route that does not normally cross the area, the forecasting module refrains from producing intervals, indicating that it has learnt that this route doesn’t involve any “within” events.
Fig. 3. Visualization of events forecasting [Google earth V 7.1. Mer d'Iroise, France, 48°23'08.76"N, 4°51'37.54"W. SIO, NOAA, U.S. Navy, NGA, GEBCO. Digital-Globe 2015. http://www.earth.google.com, September, 2017].
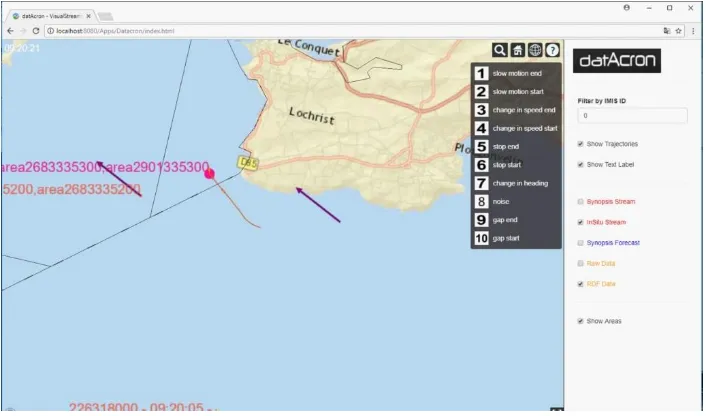
Fig. 4. Visualization dashboard for maritime events.
5
Conclusion
The research presented in this paper presents some preliminary results of the datAcron project whose objective is to advance the management and integrated ex-ploitation of voluminous and heterogeneous data-at-rest (archival data) and data-in-motion (streaming data) sources, so as to significantly advance the capacities of sys-tems to promote safety and effectiveness of critical operations for large numbers of moving entities in large maritime areas.
We introduce our current progress and achievements towards the real-time pro-cessing and analysis of big data for improving the predictability of trajectories and events regarding moving entities in maritime domain. There are still many challenges ahead to be addressed such as discovery of a interactions among moving ships in a timely manner, efficient query answering of very large knowledge graphs for online and offline analytics tasks, cross-streaming synopses generation at the data integration level, long-term online full trajectory predictions and improvements in forecasting complex events together with learning/refining their patterns by exploiting examples are amongst some of major challenges ahead we still plan to address.
Acknowledgments
References
1. E. Alevizos, A. Artikis, and G. Paliouras. Event Forecasting with Pattern Markov Chains. Proceedings of DEBS, pages 146-157, 2017.
2. A.-L. Jousselme, C. Ray, E. Camossi, M. Hadzagic, C. Claramunt, K. Bryan, E. Reardon, M. Ilteris, Maritime Use Case and Scenarios, H2020 datAcron Deliverable D5.1, 2016 (http://www.datacron-project.eu/).
3. A. Dimou, M. Vander Sande, P. Colpaert, R. Verborgh, E. Mannens, and R. de Walle. RML: A Generic Language for Integrated RDF Mappings of Heterogeneous Data. Pro-ceedings of LDOW, 2014.
4. K. Kyzirakos, I. Vlachopoulos, D. Savva, S. Manegold, M. Koubarakis. GeoTriples: a tool for publishing geospatial data as RDF graphs using R2RML mappings. Proceedings of the ISCW 2014, Posters & Demonstrations Track - Volume 1272, Riva del Garda, Italy, 393-396, 2014.
5. M. Lefrançois, A. Zimmermann, and N. Bakerally. A SPARQL Extension for Generating RDF from Heterogeneous Formats. Proceeding of ESWC, pages 35–50, 2017.
6. X. Lin, S. Ma, H. Zhang, T. Wo, and J. Huai. One-pass error bounded trajectory simplifi-cation. PVLDB, 10(7): 841-852, 2017.
7. J. Liu, K. Zhao, P. Sommer, S. Shang, B. Kusy, and R. Jurdak. Bounded quadrant system: Error-bounded trajectory compression on the go. Proceedings of ICDE, pages 987-998, 2015.
8. C. Long, R. Chi-Wing Wong, and H. V. Jagadish. Trajectory simplification: On minimiz-ing the direction-based error. PVLDB, 8(1): 49-60, 2014.
9. N. Marz and J. Warren. Big Data - Principles and best practices of scalable real-time data systems. Manning Publications. April 2015.
10. A. N. Ngomo. ORCHID - Reduction-ratio-optimal computation of geo-spatial distances for link discovery. Proceedings of ISWC, pages 395–410, 2013.
11. K. Patroumpas, E. Alevizos, A. Artikis, M. Vodas, N. Pelekis, and Y. Theodoridis. Online event recognition from moving vessel trajectories. GeoInformatica, 21(2): 389-427, 2017. 12. G. Santipantakis, G. Vouros, C. Doulkeridis, A. Vlachou, G. Andrienko, N. Andrienko, G.
Fuchs, J. M. C. Garcia, and M. G. Martinez. Specification of semantic trajectories support-ing data transformations for analytics: The datAcron ontology. Proceedsupport-ings of SEMANTICS, pages 17-24, 2017.
13. M. A. Sherif, K. Dreßler, P. Smeros, and A. N. Ngomo. Radon - Rapid discovery of topo-logical relations. Proceedings of AAAI 2017, pages 175–181, 2017.
14. P. Smeros and M. Koubarakis. Discovering spatial and temporal links among RDF data. Proceedings of LDOW, 2016.