A Deep-Learning Based Feature Hybrid Framework for
Spatiotemporal Saliency Detection inside Videos
Zheng Wang
a, Jinchang Ren
b, Dong Zhang
c, Meijun Sun
c,*, Jianmin Jiang
da
Media Technology and System (MTS) Lab., School of Computer Software, Tianjin University, Tianjin 300350, China
b
Centre for excellence in Signal and Image Processing, University of Strathclyde, Glasgow, U.K.
c School of Computer Science and Technology, Tianjin University, Tianjin, 300350, China
d Research Institute for Future Media Computing, College of Computer Science & Software Engineering, Shenzhen University,
China
*corresponding author, [email protected], [email protected]
Abstract: Although research on detection of saliency and visual attention has been active over recent years, most of the existing work focuses on still image rather than video based saliency. In this paper, a deep learning based hybrid spatiotemporal saliency feature extraction framework is proposed for saliency detection from video footages. The deep learning model is used for the extraction of high-level features from raw video data, and they are then integrated with other high-level features. The deep learning network has been found extremely effective for extracting hidden features than that of conventional handcrafted methodology. The effectiveness for using hybrid high-level features for saliency detection in video is demonstrated in this work. Rather than using only one static image, the proposed deep learning model take several consecutive frames as input and both the spatial and temporal characteristics are considered when computing saliency maps. The efficacy of the proposed hybrid feature framework is evaluated by five databases with human gaze complex scenes. Experimental results show that the proposed model outperforms five other state-of-the-art video saliency detection approaches. In addition, the proposed framework is found useful for other video content based applications such as video highlights. As a result, a large movie clip dataset together with labeled video highlights is generated.
Keywords: spatiotemporal saliency detection, Human gaze, convolutional neural networks, visual dispersion, movie highlight extraction.
1. Introduction
Visual saliency has been an important and popular research in image processing for decades with a sole purpose to mimic biological visual perception for machine vision applications. Substantial interests in the field as evidenced by the vast volume of publications, such as application of saliency concept for image/video compression and recognition[1]-[6], automatic image cropping[7], non-photorealistic rendering[8], adaptive image display on small devices[9], movie summarization[10], shot detection [11], human-robot interaction[12], and detection of multi-class geospatial targets[13][14] have been reported in the last two decades.
Historically, saliency detection research was first initiated by Treismanand Gelade in 1980[15] who proposed the “Feature Integration Theory”, which illustrated how visual attention was attracted by features in the imagery. Itti and Koch‟s model triggered strong interests in this field of research, including the use of low-level features to map the saliency regions/objects in the image scene[16]. He et al[17] proposed a biologically inspired saliency model using high-level object and contextual features for saliency detection based on Judd‟s concept [18]. Further extension of research along this line was reported by Goferman et al [19] who emphasized that four important factors, including local low-level features, global consideration, visual organization and high-level factors could affect saliency detections strongly. The methodology for feature extractions has also been improved.
Despite of intensive research in the image based saliency detection, video saliency has not been addressed until recent years. In fact, video saliency is quite different from that of still images, mainly because of the very limited frame-to-frame interval time for the observers‟ attention to be drawn by features in the scene. Although there are extensions from the image-based saliency models for the video stream such as the temporal intensity and orientation contrasts as dynamic features[20][21], better frame work is needed for more efficient saliency detection from video footage.
While most work in the field has been focusing on low level features, human attention prediction is considered to be dominated by some high-level features, such as objects, actions and events. Rudoy et al[22] employed viewer‟s gazing direction and also to use their actions as cue to locate the saliency features, as opposed to the conventional image based pixel feature extraction method. Han et al.[23] proposed that meaningful objects were important to saliency detection. Based on visual attention and eye movement data, a video saliency detection model was trained and it was found to outperform all other state-of-the-art algorithms.
information in video. Wenguang et al [26] captures spatial and temporal saliency via fully convolutional networks (FCNs) from frame pairs, but only using a frame pairs is not enough to fit the visual staying phenomenon for watching videos. Different with the mentioned works above, we proposed a novel deep learning and handcraft features hybrid framework for spatial dynamic attention of video by using consecutive 7 frames as input.
This paper focuses on eye fixation prediction task of video streams. A deep learning based combined feature framework is proposed to predict the spatial and temporal saliency regions and visual dispersion amongst video sequences. The features are extracted via an effective deep learning model, and they are then integrated with other handcrafted features. The effectiveness of these combined high-level features for saliency detection from video stream is assessed using five publicly available eye gazing datasets. In addition, a clip-vote dataset with about 596 movie clips and votes from 70 observers has also been employed to validate the applicability of the proposed approach for highlight extraction from movie streams.
Although research on saliency detection and visual attention have been receiving increasing attention in recent years, most of existing work focuses on still image rather than video based saliency detection. In this paper we proposed a deep learning based hybrid spatiotemporal feature framework for saliency prediction from video streams, and the main contributions of the present work can be summarized as follows:
A hybrid feature framework is proposed for saliency detection in video. Low-level features extracted from convolutional neural networks are found more effective than other commonly used handcrafted features such as intensity, color, orientation, and texture for saliency detection. The integration of high-level features with the low-level one, as well as the use of a customized classifier rather than that in CNN, are found very useful supplement to our framework. The performance of this hybrid feature framework is validated by five video datasets.
A CNN based feature hybrid method has been proposed for the spatial saliency detection using 7consecutive raw frames.
A 3D CNN with high level object features, scene complexity feature and a cluster weighted model have been employed for temporal dynamic attention detection.
In addition, based on the proposed TDA model, a movie clip dataset is constructed with subjective ranking of highlight levels. To the best of our knowledge, this is the first of such datasets to be made in this field. This data set may be useful for semantic video analysis as it is shown in this work.
According to experimental results, we have shown that this hybrid feature framework outperform five state-of-the-art methods for the saliency detections from five public eye fixation databases.
The remaining paper is organized as follows. Section 2 overviewed the related works. Section 3 provides an overview of the proposed approach, including definition of spatiotemporal attention and ground truth determination. In Section 4 and 5 the spatial dynamic attention model and temporal dynamic attention model are discussed, respectively, along with details in terms of feature extraction. Section 6 presents the experimental results and discussions on five publicly available datasets. In Section 7, experiments on our constructed movie clip database are reported. Finally, some concluding remarks are drawn in Section 8.
2. Related work
Saliency detection models in general can be categorized into visual attention prediction and saliency object detection. In this paper, we propose a deep learning framework for predicting eye fixation locations where a human observer may fixate[27][28][29]. Itti and Koch use low-level features to map the saliency regions/objects in the image scene[16]. Koch and Ullman [28] introduced a feed-forward bottom up model to combine features in the form of a saliency map to represent the most visually attractive region across the whole scene. Then a number of studies extended the concept and applied it for still image applications[30][31][32]. The idea is then further expanded by Itti et al[20] who proposed a rather influential saliency based visual attention model for rapid scene analysis in 1998. Recent work by Zhang et al[33] showed that simple, but effective, saliency detection could be achieved through the entropy of images in both RGB and LAB color spaces. Other work by Han et al[34] also demonstrated the effectiveness of sparse coding representations for saliency detection from still images. Details of other variety of approaches can be found in a recent survey by Itti‟s group[35].
For video Visual attention prediction, Quite different from that of the still image extended saliency model had been the bottom-up spatiotemporal methodology, which integrated the static and dynamic saliencies as proposed by Marat et al[11] for video application. Kim et al[36] extended the image based center-surround method for video stream by adding another temporal dimension. Hou and Zhang[37]proposed a spectral residual saliency model based on the similarity implied redundancies amongst image frames. In Guo et al[38],a saliency map was obtained when the amplitude spectrum of the quaternion transformed video frame remained at nonzero constant value. In Cui et al [39], a temporal spectral analysis method was proposed for fast motion saliency detection in video. Hou and Zhang [40] proposed to assess the entropy of features using incremental coding length (ICL). The dynamic and static saliency was computed by selecting features with longer code length increment value. Zhang D. et al [41] proposes an unsupervised event saliency revealing framework by extracts features from multiple modalities to represent each shot in the given video collection. Wang W. et al [42] use a novel spatiotemporal saliency detection method to estimate salient regions in videos based on the gradient flow field and energy optimization. What‟s more, co-saliency detection has received tremendous research interest in recent years, [43][44][45] was all proposed a new framework for Co-saliency Detection and achieve satisfy results.
[46][47][48] give up the temporal features which is very important in video, only use the single video frame and the deep learning models and other works [49][50]use the combining deep learning based features and handcrafted features in saliency detection. So the previous work did not apply to visual attention prediction. In [51], two stream convolutional networks for learning complementary information was used for dynamic attention prediction and video object segmentation. However, these methods train their models on multi-frame which causes heavy computational burden. W Wang et al [52] use the FCN to capture the spatial and temporal saliency information in Video salient object detection. A CNNs Based RGB-D Saliency Detection via Cross-View Transfer and Multi-View Fusion was proposed by J. Han et al [53].
3. Overview of the proposed approach
3.1.Introduction of spatiotemporal dynamic attention
In recent years, saliency detection from static images has been intensively investigated. Deduced from several image cues, Kochand Ullman[28] introduced the concept of saliency map to represent the conspicuousness regions of images. By using eye ball tracking devices to capture the viewer‟s most attended region of interest when people looking at specified images, several eye fixation datasets have been constructed, which have facilitated a number of methods for supervised-learning based image saliency detection [54]-[63]. However, the work on the behaviors of viewers‟ attention when they are watching video remains rare.
Unlike image saliency which only distributes in the spatial domain, video saliency can be distributed in both spatial and temporal dimensions. In other words, there are two kinds of visual attentions that are needed to address for video saliency detection, i.e. spatial and temporal distributions of audience‟s dynamic attention. They are respectively defined as spatial dynamic attention (SDA) and temporal dynamic attention (TDA).
SDA shares the same meaning with the saliency map used in the (still) image saliency [20]. For each video, a pixel-wise SDA value ranged within [0-1] is determined. A pixel with a larger SDA value meaning it is more likely to be gazed at. Therefore, SDA can be used to indicate the spatial intrinsic consistency when different observers are watching the same video.
TDA also has a value ranged within [0-1] yet it is frame based, which indicates the variation of human‟s attention on a continuous frame sequence as it is determined by using a temporal window of consecutive frames. This means that TDA is a measure of inter-observer agreement in the temporal domain. The assumption here is that a frame with larger inter-observer agreement, which corresponds to a higher TDA value, is considered more salient than those with low TDA values. Promising results using TDA for the detection of video highlights in movies are also reported in Section 7.
[image:3.612.162.463.447.571.2]In this paper SDA is designed to be calculated pixel by pixel. TDA is estimated by using frame sequence and each frame is assigned a TDA value, its ground truth can also be deduced from the eye fixation database. Similar definitions can be found in Jiang et al [64], which use dynamic attention value for each frame to calculate Visual Attention Index (VAI). In Han et al [23], spatial and temporal visual attention (SVA/TVA) values are determined by using object based visual features.
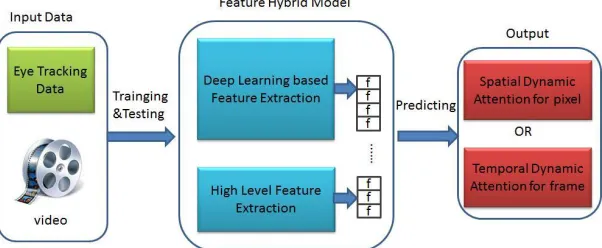
Fig.1. Feature Hybrid Deep Learning Based Framework for spatiotemporal saliency extraction.
Fig. 2. One sample frame extracted from the movie „Gladiator‟ when the evil King was verballyinfuriating the General (left) and results of predicting attention from the proposed method (right) to indicate that observers were in fact attracted by his facial expression.
To some extent, the proposed video saliency framework is similar to video highlight extraction as there is potential to use detected saliency attention to promote the extraction of video highlights. However, there are some differences between them as explained in an example below. As shown in Fig. 2, a frame from the movie „Gladiator‟ is extracted when the evil King was verbally infuriating the General. According to the highlight extraction algorithm in [66], the highlight degree of this part is low due to the accumulated stimulus of slow motion and low sound energy. On the contrary the eye fixation was concentrating on their faces, which actually demonstrated that observers were attracted by this part.
3.2. Computation of ground truth
To train the model and assess the performance, ground truth maps for human spatiotemporal dynamic attention are needed. Although there are no such databases of human attention, motivated by the findings that observer‟s attention and eye movement are highly correlated[67], some indirect ground truth can be derived from a large collection of human-eye gazing data. The computation of ground truth has been introduced in [23], where the spatiotemporal gaze density is generated using three human-eye gazing database, the VAGBA dataset [54], The Lübeck INB Dataset[55] and the IVB database [56]. For simplicity and consistent experimental comparison, the same ground truth computation method is adopted in our paper. In addition to the three datasets above, another two datasets, CRCNS[57] and DIEM (Dynamic Image and Eye Movement)[58]), are also used. This is because the lengths of these video streams are longer and their scenes are more complicated and the detailed description of these datasets is given in Section 6 (see in Table 1).
For each video in a given dataset, a 3D Gaussian model is used to estimate the probability of a pixel to be fixated in the spatiotemporal fixation map S[27]. As defined below, the ground truth value of SDA can be calculated by:
Mpp t y x pj k O p K
g
g
g
S
1 2 2 22 1
}
)
(
2
)
(
exp{
)
(
(1)Here g is a pixel in the spatial fixation mapSof current framek, the th
j gaze position of the th
p observer in kis denoted as
) , , ( , t y x gpj
k wherep[1,O]andj[1,Mp], whereOandMPare the total number of observers and recorded gaze positions of th
p observer, respectively. The spatial standard deviation of the 3D Gaussian kernelxandyis about 0.01 in image width. The temporal standard deviationt is equal to 130ms.
To calculate the TDA ground truth value which can evaluate the similarity of eye fixed of these observers in each frame, a“leave one out” method is adopted. Each time the spatial fixation map of all observers except one is computed similar as the SDA. We extract the top 25% points in this fixation map which have the highest probability of being fixed. And then compute the percentage of the visual fixations of the remaining observer that fall within those areas. If the remaining observer also looks at those areas, the TDA value will be 1. This process is iterated for all observers and can be defined by
O g p s k T O p p k K
1 { ( | ), }
)
( (2)
Here p k
g is all the gazing points of the th
p remaining observer in framek, is a threshold function to keep the top 25% fixated probability points in the spatial fixation mapsK|p, which is calculated from all observers except the
th
p remaining observer, the
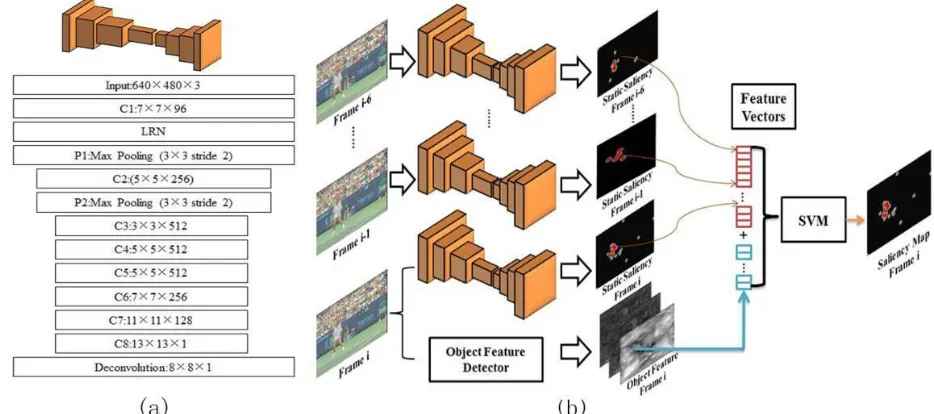
Fig. 3.The proposed feature hybrid spatiotemporal CNN model for the computation of SDA. (a) The architecture of the CNN model for single frame. (b) The feature hybrid framework for SDA with consecutive 7 frames as input.
In addition, a new clip-based video dataset is built to explorefurther applicationsof the proposed TDA model, such as video summarization[68] and highlight extraction[66]. For each of the video clip in the dataset, there are 70 subjects‟ selections, representing as 0/1 to indicate its attractiveness to the viewer. The TDA values are then combined with subjects‟ score and taken as features to train a SVM. Relevant technical detail and experimental results are discussed in Section 7.
4. SDA deep learning
Based on the previously introduced spatiotemporal dynamic attention framework, a SDA predicting model is proposed in this section and detailed as follows.
4.1.2D CNN based feature extraction
For most existing saliency detection approaches as found in [16][20][69]-[73], they all suffer from one big drawback where their classifiers are reliedon complex handcrafted features computed from the raw inputs. They may work well for biologically motivated low-level features such as intensity, color, orientation and texture. In real-world scenarios, however, it is not known which features are really important for achieving the task at hand asthe choice of features is highly goal-dependent. This has inevitably limited their generalization ability for dealing with complicated cases, such as video characterized by having wide variety of themes.
In recent years, deep learning models[74]-[78] have been proposed to learn hierarchy of features by building maps from low-level features to high-levelones. Applications of deep neural networks based systems have shown very competitive performance with respected to many other classifiers in many fields; such as human action recognition[79][80][81], tracking[82], nature language processing[83], audio processing[84], segmentation [85], and denoising[86]. The ImageNet database has been established to provide a comprehensive basis for image classification and object recognition research[87][88][89]. However, those image based methods cannot be directly applied for video saliency detection due to the lack of temporal information and dynamic attention model. For predicting of dynamic human attentions in videos, eye gazing video datasets have beenused in this paper for training the spatiotemporal video saliency model.
A 2D CNN architecture can be constructed by stacking multiple layers of convolution and subsampling in an alternating pattern. Each convolutional layer is used to extract features from a local neighborhood of the feature maps in the previous layer. As defined in Eq. (1), the value of a unit at position(x,y) in the th
j feature map in the th
i layer can be calculated by
)
tanh(
( )( )) 1 ( 1
0 1
0 ij
q y p x
m i m
P p
Q q
pq ijm xy
ij
w
v
b
v
i I
(3)where tanh()represents the hyperbolic tangent function;Pi and Qiare respectively the width and height of the convolutional kernel;mis the index of feature maps in the
th
i 1)
( layer which is connecting to current layer; p q ijm
optimizedthrough back-propagation (BP) algorithm. As for the max-pooling layers, their purpose is to achieve spatial invariance by reducing the resolution of the feature maps[90]. Meanwhile, max-pooling reduces the computational complexity of upper layers by selecting superior invariant features.
The architecture of Convolution Network resembles the VGG-M model [91] and static saliency model [92]. Static spatial saliency mapis obtained from single frame which does not contain temporal information[93]. The convolution network for single frame (Figure 2(a)) can be summarized as input layer (640×480×3)->convolution layer 1 (7×7×96)->local response normalization->max pooling layer 1 (3×3 stride 2)->convolution layer 2 (5×5×256) ->max pooling 2 (3×3 stride 2)->convolution layer 3 (3×3×512)-> convolution layer 4 (5×5×512)-> convolution layer 5 (5×5×512)-> convolution layer 6 (7×7×256)-> convolution layer 7 (11×11×128)-> convolution layer 8 (13×13×1)->deconvolution layer 1 (8×8×1 stride 4). That is, the input is a single frame, and last layer is deconvolution aims to produce a saliency map which are the same size as the input. In all convolution layers, the stride was set to 1. And all convolution layers except the last one are followed by a rectified linear unit non-linearity (ReLU) layer. The convolution network composed of 10 weight layer, and transfer learning was used in the first 3 convolution layers to initialize the weights with the pre-trained weights from the VGG-CNN-M network in [91]. The remaining weights were initialized randomly using the strategy in [94].
4.2.High-level features: object features
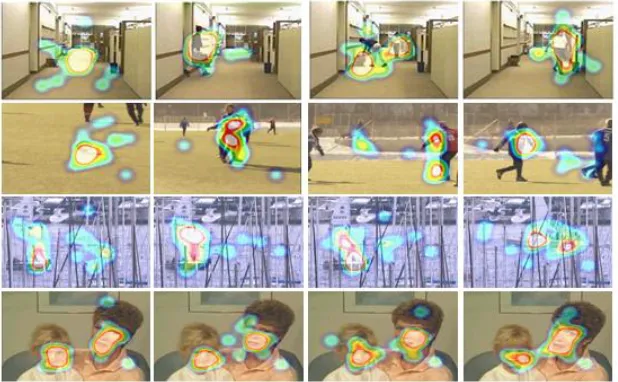
Human attentions, is mainly driven by objects, as validated in a number of previous works[95][96][97][98]. Some examples are given in Fig. 4, which shows that the eye gazing positions are always focused on the objects in a scene, such as pedestrian and human faces. It is further found that human attention can be biased toward objects and move with objects[22]. As a result, it is natural to assume that the region around objects may be more attractive to be gazed at.
[image:6.612.153.462.339.530.2]Inspired by the object-biased attractiveness of human attention, Han et al [23] extended the object bank method [99] to compute a response map for each video frame. In total there are 177 kinds of objects, and each has a specific trained detector. In this paper, the same object detection method in [23] is used. Based on the fact that pedestrian attracts more attention than other objects, a specific pedestrian detection algorithm [100] has been adopted in this work.
Fig. 4.Examples show how objects affect human dynamic attention in videos.
4.3.Experimental setup for determining SDA
In our experiments for SDA, five video datasets are employed. All the frames are resizedto 640×480×3 pixels. In order to train an optimizing convolution network for single frame image model, Caffe framework [101] is used in the model, and Stochastic Gradient Descent (SGD) with the Euclidean loss distance is used between the predicted saliency maps of the single frame with the ground truth maps. All obtained saliency values of single frame are normalized to [0, 1]. For the network, we trained over 200K iterations and set the initial learning rate to 10-7, the momentum to 0.9 and the weight decay to 0.0005. Validation training is used in this model. For the training dataset, 80% videos are used for training and the rest for validation.
5. TDA deep learning
[image:7.612.181.429.180.279.2]In this section, we will explain how to predict temporal dynamic attention by using the proposed framework. It is well-known that the visual gazinglocations of viewers are not always constant when they are watching video. The distribution of visual gazing location can be very dispersive particularly when the video/scene is not very interesting. However, the viewer‟s gazingtends to be focused atthe same place whenan interesting event was happening. This phenomenon is known as visual dispersion for still images[103] or temporal visual attention for videos [23]. Examples of visual dispersionare given in Fig. 5 to illustrate the concept. Based on our proposed framework, the visual dispersion is calculated foreach frame of the eye gazing dataset (see in Section 4.2). Using the value of visual dispersion as the ground truth of the TDA,the proposed features are mapped to visual dispersion as detailed below.
Fig. 5. Examples of visual dispersion when there is no region of interest (left) or there is a region of interest, the ball, where the eye fixation is focused upon.
5.1.3D CNN filter
Extraction of spatial and temporal features from multiple contiguous frames is commonly performed for the analysis and understanding of video[79][104][105][106]. In our framework, a 3D CNN architectureis proposed for spatiotemporal feature extraction from the raw video data. In the proposed 3D CNN architecture, a 3D kernel is applied to a cuboid formed by stacking multiple contiguous frames together, similar to that as suggested in[79][81].
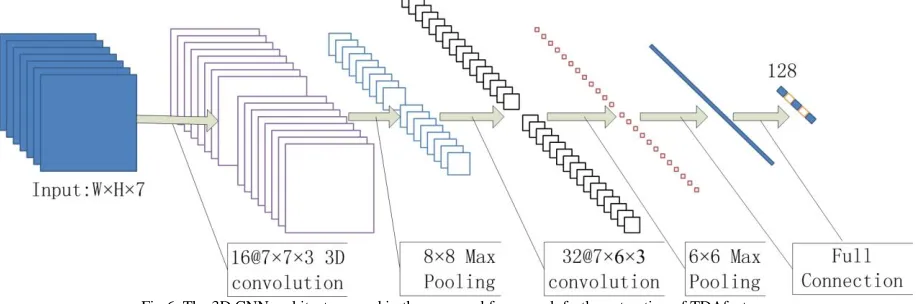
Fig.6. The 3D CNN architecture used in the proposed framework forthe extraction of TDAfeature.
As an extension to Eq. (3), the value of a unit at position(x,y,z) on the th
j feature map in the ithlayer is defined by
)
tanh(
1
0 1
0 1
0
) )( )( (
) 1
( ij
m P
p Q
q R
r
r z q y p x
m i pqr ijm xyz
ij
w
v
b
v
i i i
(5)
where the variables were as same as Equation (3).
An overview of our proposed 3D CNN architecture is illustrated in Fig. 6 and the workflow issummarized as follow: i. Use the original frame size and take 7 contiguous frames as a group as input for the 3D CNN;
ii. Filtered data maps are obtained from the 1st convolutional layer, which contains 16 convolution kernels with filters size 7 × 7× 3 giving 16 feature maps as the first layer output ;
iii. Features maps are obtained by max pooling of the 16 filtered data maps using 8 × 8 max pooling;
iv. The 2nd convolutional layer has a set of 32 3D convolutional kernels with filters size 7×6×3 and outputs 32 feature maps; v. Features maps are then processed by another max pooling of 6 × 6 subsampling step.
[image:7.612.83.541.391.543.2]Algorithm 1: 3D CNN architecture
Input: 7 contiguous frames Output: a 128D feature vector
1: Function : 3D CNN
2: 16 convolution kernels with filters size 7 × 7× 3 to calculated with the input to get the filtered data maps;
3: 8 × 8 max pooling was used to calculated the features maps;
4: 32 convolutional kernels with filters size 7×6×3 to calculated with the features maps;
5: 6 × 6 max pooling was used to calculated the features maps; 6: a full connection was apply in the features maps;
7: End function
[image:8.612.114.496.235.414.2]Note that at the training stage, all the parameters are optimized through back-propagation (BP) network.
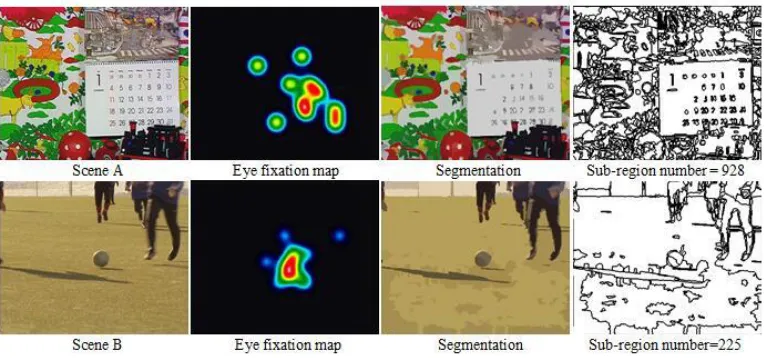
Fig. 7. Visual dispersion is affected by scene complexity which is measuring by using image sub-region segmentation.
5.2. High-level features: object features
The high-level image representation used in the proposed model is object based features[99] (see in Section 4.2), which is employed to determine the TDA feature below. By using the 177 object feature maps extracted from each frame in the SDA stage, every object feature map is translated to a likelihood value within [0,1], thusa 177 dimensional feature vector is derived from each frame. More details about the mapping process can be referred to [99]. Each element in the vector representsthe possibility/likelihood whether the corresponding object is contained in this frame.
Although in our opinion this object feature works on the computation of TDA, there is still room for further improvement especially in the consideration of contextual information. One example here is the object of a football in the context of soccer game, which can be very attractive when it is rolling towards the goal post. However, it becomes much less attractive if the ball rolls out of the field. As a result, it is essential to address the contrast or relationship between the objects in the high-level semanticspace.
Another high-level feature we proposed in this paper is the scene complexity response, which is motivated by the fact that human‟s attention can vary dramatically as according to the complexity of the scenes being observed. The amount of visual information as well as the visualclutter in a picture may contribute to the variability of observers‟ attention [107].
As shown in Fig. 7 the distribution of gazing position in the first scene is more disperse, simply because of the more clutter in the first scenethan the second. From the neurobiological point of view, this phenomenonstems from the co-functioning of two mechanisms in our human visual system (HVS), i.e. bottom-up and top-down mechanism [43][108]. Although the bottom-up mechanism occurs first, the top-down mechanism plays a more dominant role when they work together.
However, the above is true only if when the scene is static. For videos, it is believed that the two mechanisms dominate the attention alternately, depending on the complexity of the scene[107].When the scene complexity is low to medium, high-level features such as object attribution, content and event etc. affect observer‟s attention the most. Once the video scene turns to be too complicated, e.g. with too many objects, too much cluttering and/or too fast motion etc., the effect of the top-down mechanism is found reduced whilst the bottom-up mechanism becomes dominant. One possible explanation is that conventional image based features cannot be accurately extracted from complicated scenes. As a result, the top-down mechanism fails to work. As shown in Fig. 7, the first row is a frame of scenecontains many objects and the corresponding heat map indicates that the eye fixation is dispersive. The second row is a scene of football game, where the eye fixation is focused on the main object of the ball.
To assess the visual complexity in frames, we firstly scale the frame to a size of 256 256. Then a color mean shift segmentation and region fusion method[103] is employed to segment the image into sub-regions. If the image is too clutter the number of sub-regions will be large and vice versa. Finally, the number of sub-regions is normalized by dividing a maximal value. Fig. 7 shows two scenes and their eye fixation map and sub-region segmentation map. Thenumber of sub-regions of the segmented picture is also given. The calculation of this feature for the TDA is defined as following:
Max k k
FHI( )( ) (6)
Here the function refers to the color mean-shift segmentation and region fusion method in [103].
TABLE 2
AUCs of various models for the prediction of eye movements on five eye tracking datasets.
Ours Ours+Center OBJ[23] GBVS[16] MLSN[111] MCDL[112] STAD[113] SAG[114] TNSR[45] AUC in IVB 0.7993 0.8140 0.7895 0.7605 0.7888 0.7879 0.7698 0.7906 0.8015 AUC in CRCNS 0.7128 0.7237 0.6837 0.6653 0.6807 0.6931 0.6571 0.7017 0.7086 AUC in DIEM 0.7434 0.7461 0.6957 0.6746 0.7191 0.7094 0.6652 0.7359 0.7261 AUC in INB 0.8562 0.8646 0.8266 0.8062 0.8305 0.8482 0.8133 0.8481 0.8353 AUC in VAGBA 0.8391 0.8475 0.8215 0.8121 0.8233 0.8336 0.8117 0.8347 0.8294
TABLE 1
DETAILED DESCRIPTION OF 5 EYE FIXATION DATABASES
Name Video
Number
Observers Number
Resolution Duration Description Shot Cut Camera CRCNS-MTV 50 8 640*480 2-118Seconds Nature Scene, Interview, Ad,
Sport, Street, TV Game
Yes ( for its MTV data)
Dynamic & Static DIEM 84 50 720*576-1280*720 120-180 Seconds TV, News, Sport, Music,
Movie, People, Animal, Ad,
Yes Dynamic & Static IVB[23] 12 15 352*238 6-12Seconds Nature Scene, Interview, Ad,
Sport, Street
No Dynamic VAGBA[23] 50 14 1920*1280 10 Seconds Outdoor & Indoor No Static
[image:9.612.53.561.84.183.2] [image:9.612.50.574.213.319.2]Fig.8. ROC curves of various SDA models for eye movement prediction in five eye tracking datasets: CRCNS, DIEM, Lubeck INB, IVB and VAGBA.
Fig. 9.Precision-Recall curves of the various SDA models for the prediction of eye movements on five eye tracking benchmarks.
5.4.Experimental setup for determining TDA
[image:10.612.64.545.376.676.2]determining TDA value for each frame can be regarded as a regression problem. Specifically, the ratio of training and testing videos is set as 2:1. To suppress the onset effect where the central bias is the strongest, the frames within the first 1.5s are discarded. A 7-frame temporal window is then used to form a 3-D feature volume and feed into the 3D CNN for feature extraction, also the object feature and scene complexity response feature are calculated per frame.
The TDA value per frame is the measure of inter-observer agreement for one fixed frame. A higher TDA value of a frame means more attention consistency of viewers on the current time of video, vice-versa.
For the classifier selection, the cluster weighted model (CWM) [109] is adopted to predict the TDA value for each frame. CWM is a generalization of Gaussian mixture models, which can achieve more accurate linear regression results than simple linear models. The source code of CWM can be downloaded from the web of [110].
Let a CWM containNclusters in a feature space and each cluster is associated with a linear regression function. To do a mapping from the feature space to an output value (TDA in this paper), all the regression functions are mixed. The mixture proportions are determined by the CWM‟s mixture coefficients and the conditional probability of sample‟s features which satisfies the Gaussian distribution when representing each clusterci, where i=1,…, N. As a result, the joint probability density of a frame TDA ratingrj and the frame feature vector fjis decided by:
N
i i i i j j i
j
j f pc p f c pr f c
r
p( , ) 1 ( ) ( | ) ( | , ) (7)
where p(ci)is the weight for the clusterci. p(fi|ci)is the probability reflecting the influence of the clusterci in the feature space,
andp(rj |fi,ci)models the output distribution of the cluster. They can be formulated as the multivariate Gaussian with mean ui
and covariance matrix
i.
2 12
1 | | ) 2 ( ) 2 ) ( ) ( exp( ) | ( i u f u f c f p L
i j i
T i j
i
i (8)
2 2 * 2 ) 2 ) ( exp( ) , | ( i i j T i j i i j f w r c f r p
(9)
Where * j
f indicates the original feature vector fjwith a 1 concatenated to its end. We have obtained the feature fj of the jth frame, then the estimated rating which should minimizes expected squared error under the model is
N
i i i i
N
i j i i i
T i j c f p c p c f p c p f w r 1 1 * ) | ( ) ( ) | ( ) (
ˆ (10)
For the model‟s parameter set{p(ci),ui,
i,wi,
i}, it can be determined using the expectation-maximization (EM) method asdetailed in [109][110]. In the initialization process, p(ci)is set to a uniform distribution,
2 i
and
iare initialized to be the variances of the TDA values and features of the training frames, respectively. uiis estimated by randomly selected feature vectors from the training dataset, and wiis set to zero. For a given number of clusters, to avoid the local minima, the EM procedure isrepeated for 30 times and the result with the maximum log likelihood isused. In addition, the optimal number of clusters is determined by minimizing the total mean-squared error in a five-fold cross validation.
6. Learning and experimental results
Fig. 10. Results of saliency maps extracted from GBVS [16], OBJ [23], MLSN[111], MCDL[112], STAD[113], SAG[114], TMSR[45] and the proposed method in comparison of the ground truth.
6.1.Evaluation criteria and benchmarking approaches
For the evaluation of the proposed SDA (spatial dynamic attention) and TDA (temporal dynamic attention) models, two widely used metrics are used for quantitative performance assessment, including Receiver Operation Characteristics (ROC) with area-under-curve (AUC) and Precision versus Recall (P-R) Curve. For benchmarking purpose seven state of the art approaches[16][23][111][112][113][114][45] which have been shown almost the best performance on public datasets are selected. For these five benchmarking methods, the default parameters and the same datasets are used for training, testing and comparison with our proposed approach.
Among these seven benchmarking approaches, the first is the bottom-up visual saliency model from Harel et al. [16], in which feature maps are constructed based on Itti's method [20] and followed by normalization using a fully connected graph built over all grid locations of each feature (abbr. GBVS in the following part). The second is object-based spatial visual model from Han et al.[23] (abbr. OBJ in the following part), where object features are mapped to human eye fixation density via learning. Experimental results show that OBJ method is more robust than traditional methods that use contrast-based features, such as those in [115][116][117]. The third method (abbr. MLSN) proposed a multi-layer sparse network to learn low, mid and high level features from natural images. The fourth method (abbr. MCDL) use a multi-context deep learning framework for saliency object detection. Both global context and local context are taken in account. The fifth method (abbr. STAD) proposed a dynamic consistent spatiotemporal attention model by considering objects and motions in video. The sixth method (abbr. SAG) proposed a saliency-aware geodesic video object segmentation. The last method (addr. TMSR) proposed a novel approach based on two-stage multi-view spectral rotation co-clustering for co-saliency detection.
Since there is a strong bias to the center of the image for human fixations [18][118], we also model this center bias in our SDA model by calculating the distance from current pixel to the center of the frame in the process of training and predicting. This forms a one dimensional vector and is denoted as center feature in this paper, which is also concatenated to the SDA feature set for evaluation.
In addition, Pearson correlation coefficients[119] between the predicted TDA and the ground truth are also used in assessing the performance of the proposed TDA model.
6.2.SDA results from ROC analysis
which is used to compare the performance of the proposed SDA regression model with other approaches. The moving threshold range is [1, 0] with a step 0.1. The AUC is calculated as the area under the ROC curve to demonstrate the overall performance of a given saliency model. As can be seen, the proposed SDA model with Center feature produces the best results. Even without using the Centre feature, SDA is still found to outperform most others in all the five datasets. The MCDL method shows almost the same performance with the proposed method but it needs more computation cost to train multi deep learning frameworks.
To compare the quality of different saliency maps obtained by SDA methods, the P-R curves are illustratedin Fig. 9. In general, the proposed SDA model generates the best results over the five datasets, though OBJ method yields slightly better results in the IVB dataset when the recall value is between 0.14 and 0.44.
In addition, saliency maps extracted from different methods are also visually compared in Fig. 10, where the distribution of predicted eye fixation positions is used to generate the heat map. In most situations our predicted saliency maps match with the ground truth the best. For example, in the third row of „gamecube02‟ from the CRCNS dataset, our result is focusing on the main saliency object around the screen center as defined in the ground truth. Moreover, our model shows less attention to the text and sign at two corners on the top than other methods, which validates the efficacy of the proposed features. There are some weaknesses of our model, as in the second row, we have detected too many saliency regions, though the main object has been accurately identified.
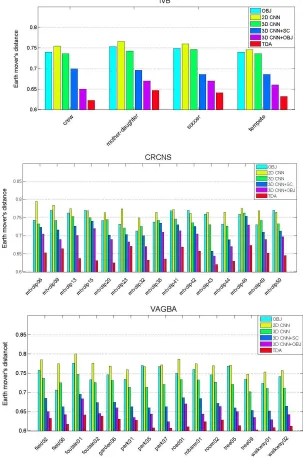
[image:13.612.155.458.228.685.2]6.3.The Earth Mover’s distance analysis for TDA
In addition to the high level features assessed above, the Earth Mover‟s Distance [120] between the randomly selected TDA and the ground truth are computed. To compute the TDA, the ratio of training and testing data is set as 2:1 in each dataset and relevant results are reported in Fig. 11 for comparison.Three datasets, IVB, CRCNS and VAGBA are used for comparisonas they respectively have low, medium and high spatial resolutions for testing. As can be seen, in all the three datasets the proposed TDA model consistently outperforms theothers, though the average EMD from the several approaches are not satisfied and can be further
improved upon. Due to the large number of objects contained in the video scene, object detection becomes a hard task in this context. As a result, how to address this difficulty for improving feature extraction and CNN architecture design is worth for future investigation.
6.4. The Earth Mover’s distance evaluation for SDA
To evaluate the proposed method more sufficiently, the Earth Mover‟s Distance (EMD)[120] is employed here. The EMD is a measure of the distance between two multi-dimensional distributions. Relevant SDA results are reported in Table 3 for comparison. Furthermore, the histogram intersection similarity is computed between the normalized saliency map and the ground truth. Relevant SDA results are reported in Table 4.
According to the EMD results, the proposed method performs better than others in most cases.
6.5. Further discussions of the proposed framework
In this paper, we propose a deep learning based feature hybrid framework for video saliency detection. The feature extraction by the deep learning network plays the most important role in this work for saliency detection, which is further improved by concatenating some high-level global features. Rather than putting all the hand-tuned features as an input layer to a deep learning network, they are combined with the output of the pre-trained deep learning net work for easy implementation and highly flexibility to adapt heterogeneous architecture features. For example, a video clip with high sound energy may indicate some exciting elements that draw more viewers‟ attention. Thus the sound feature can be taken into account to dynamically optimize the saliency area and consistency of attention in a frame. It is feasible in the proposed framework to concatenate the sound energy feature to other extracted features. As a result, our design is more flexible and better compatible with heterogeneous architecture features.
Another reason that the hand-tuned high-level features are not taken as input to CNN is the extremely high computation cost on the five video databases for training. Although the deep learning networks have been significantly improved comparing with the original artificial neural networks model, it still needs considerable computational cost for training and tuning, especially for videos. It takes about 5 days to train the deep learning network even with a high performance personal computer. More input data means more training time is needed. Though possibly the high-level feature maps may improve the results from the deep learning network,
TABLE 3
EMD results of SDA on five eye tracking datasets (smaller is better).
Ours Ours+Center OBJ GBVS MLSN MCDL STAD SAG TMSR
EMD in IVB 0.4988 0.4735 0.5734 0.6870 0.5100 0.5611 0.6608 0.5069 0.4905 EMD in CRCNS 0.6508 0.6231 0.6908 0.7125 0.6695 0.6453 0.7270 0.6515 0.6415 EMD in DIEM 0.6203 0.6117 0.6861 0.6883 0.6352 0.6662 0.7093 0.6313 0.6455 EMD in INB 0.3751 0.3666 0.3930 0.4714 0.4394 0.3833 0.4503 0.4016 0.4123 EMD in VAGBA 0.4013 0.3843 0.4213 0.4505 0.4337 0.3966 0.4782 0.4033 0.4081
TABLE 4
Histogram intersection results of SDA on five eye tracking datasets (higher is better).
Ours Ours+Center OBJ GBVS MLSN MCDL STAD SAG TMSR
[image:14.612.53.560.166.281.2] [image:14.612.50.561.307.417.2]we still need the balance between efficiency and efficacy. Actually, the proposed method is still competitive with state of the art methods, such as [112], where a similar deep CNN is used with joint global features and local features. As compared in Table 2, the proposed approach has not sacrificed the accuracy yet provides great flexibility to be further improved by considering more discriminative features, no matter they are homogeneous or heterogeneous.
The features used in this paper have shown their efficacy for video saliency detection, however motion based features have been excluded. This is due to the lack of stability of the extracted motion vectors, especially when there is clutter in the background, camera motion and multiple objects moving at the same time. Inaccurate motion features lead to unsatisfied saliency detection. Although there has been work on motion based video object extraction [121], it fails to work for quite a few videos in our datasets. This will be further investigated as we believe that accurate extraction of video objects and their motion vectors is of great importance for content understanding and saliency detection in videos.
For the choice of deep learning networks, CNN is employed as it has been successfully applied in a wide range of applications including, but not limited to, handwriting digital recognition, image classification, object recognition and speech recognition[79]-[89]. Considering the temporal window (frame buffer) requested for properly determining the temporal attention model, the long-short term memory networks (LSTMs) [122]may be potentially used for its strong ability in modeling sequential data, such as sound and text. However, in our problem the input is 2D frame sequence which is hardly to be processed in parallel for LSTMs. In [123] four LSTMs are employed to process an image along four different directions, where the results are found comparable to those from CNN. However, how to apply LSTMs for video saliency detection still needs a lot of work to do and it is worth for further investigation.
7. Film clips ranking based database
In this group of experiments, the proposed spatial-temporal video saliency model is applied for predicting movie highlights. Relevant results on a large clip-based database collected by us are reported below to further validate the efficacy of the proposed methodologies.
7.1.Construction of the movie clip dataset
The movie clip database collected by us contains 596 clips, which are manually chosen from a total of 20 movies. As listed in Table 5, these movies cover four major genres including action, horror, war and disaster. For each movie, 15-18 clips are extracted, with a length varying from 40 seconds to 2 minutes. The criterion of choosing clips here is to select three kinds of clips whose highlight levels are low, medium and high whilst keeping the number of clips in each category nearly identical.
TABLE5
LIST OF MOVIES USED IN CONSTRUCTING OF OUR DATASET.
No. Movie Names Genres
1 Red (2010) Action/Comedy
2 Mission: Impossible III(2006) Action/Thriller
3 Live Free or Die Hard (2007) Action/Thriller
4 Gladiator (2000) Action/Drama
5 Terminator 2: Judgment Day (1991) Action/Sci-Fi
6 The Day After Tomorrow (2004) Disaster/Sci-Fi
7 Twister (1996) Disaster/Drama
8 Titanic (1997) Disaster/Romance
9 The Perfect Storm (2000) Disaster/Drama
10 2012 (2009) Disaster/Family
11 The Silence of the Lambs (1991) Horror/Crime
12 Silent Hill (2006) Horror/Thriller
13 The Shining(1997) Horror
14 Final Destination (2000) Horror/Thriller
15 Alien: Resurrection (1997) Horror/Sci-Fi
16 Black Hawk Down (2001) War/History
17 The Lord of the Rings: The Return of the King (2003)
War/Action
18 Troy (2004) War/Romance
19 Brave heart (1995) War/History
20 Saving Private Ryan (1998) War/History
[image:15.612.194.420.440.652.2]total number of users, i.e. 70. The experimental highlight level for each movie clip is plotted in Fig. 12, which shows that our dataset contains clips with different highlight levels.
Fig. 12. Histogram of sorted user votes for clips
The advantage of the clip datasetwe built is that it is easy for understanding and implementation. The viewers need not to remember the complex ranking criterion. Instead, the only thing is to record their feelings about whether a clip is exciting enough, which makes the resultcloser to the intrinsic excitement of the video content. Of course there are disadvantages of the dataset. Firstly, as the isolated clips are presented without the context information, this may mislead viewers. Secondly, the ground true is not captured directly when the clip is being watched. Nevertheless, the use of viewer‟s majority vote may potentiallycancel outeffects caused by their subconsciously subjective experience and personal habit.
However, showing isolated clips is almost certainly suboptimal. For future work we believe that eye gazing tracking and electroencephalographic signal are better ways to generate ground truth for video highlight extraction.
7.2. Results and analysis
A simple test model has been adopted to map several low-level features to highlight-level semantics of movie highlight/excitement. To show the effectiveness of the TDA, TDA is regarded as a high-level feature in the movie clip which is further compared with the frequently-used low-level features, such as motion, shot cut density and sound energy [66]. By concatenating the TDA feature with the conventional features, a linear kernel SVM is employed for training and predicting in this movie clip highlight predicting problem. The ratio of training and testing data is 5:2 where again the best value for the parameter C is selected by a five-fold cross-validation.
For each movie clip, the absolute mean error between the predicted highlight score and the ground truth is computed for quantitative performance assessment. As the range of mean error is within [0-1], it is evenly divided into 10 sub-ranges. A histogram is used to show how many clips have mean prediction error lies within each sub-range, as illustrated in Fig. 13 for comparison. With the TDA feature, the number of clips with their mean prediction errors less than 0.1 has increased from nearly 80 to over 110. It is seen that more than 110 clips have prediction errors reduced to less than 0.1. For all other sub-ranges, the number of clips from the new approach is consistently reduced, showing the better efficacy of the proposed model for the detection of movie highlights/excitementwhen TDA feature is included in the model.
Fig. 13. Results for movie highlight prediction: By using the TDA feature, more clips fall in smaller error range than the result from [66].
As shown in Fig. 1, a deep-learning based hybrid feature extraction framework is proposed to address the problem of video saliency description and characterization. With the combination of proposed novel deep learning networks and conventional methods as feature extractors, the final hybrid features are used to predict the spatial and temporal saliency. Two detail applications are implemented for detection of spatiotemporal dynamic attention. Novel deep learning networks architecture for spatial saliency is proposed by considering both the spatial and temporal characteristics. A movie clip dataset with manually labeled video highlights. An application of highlight clip extraction is carried out by using temporal saliency results. A careful and thoughtful experimental research is shown that the proposed framework achieves the advantage that the outputs outperform five other methods
Future work will focus on finding novel architecture of deep learning network for video dynamic attention model. Especially for the dataset of videos in the wild[124], a human factor independence novel model is needed. To achieve this, the challenge is how to extract reliable and informative feature from the unconstrained videos[125].
Acknowledgements
The authors would greatly thank the Editors and anonymous reviewers for their constructive comments to further improve the clarity and quality of this paper.The authors wish to acknowledge the support they received from the National Natural Science Foundation, China, under grants 61572351, 61772360, and the joint project funded by the Royal Society of Edinburgh and NSFC 61211130125.
References
[1] U. Rutishauser, D. Walther, C. Koch, P. Perona, Is bottom-up attention useful for object recognition?, In Proc. IEEE Conf. Computer Vision and Pattern Recognition (2004) 37–44.
[2] Z. Wang, L. Lu, A. C. Bovik, Foveation scalable video coding with automatic fixation selection, IEEE Trans. Image Process. 12 (2) (2003) 243-254. [3] W. S. Geisler, J. S. Perry,Real-time foveated multi-resolution system for low-bandwidth video communication, In Proc. Human Vision and Electronic
Imaging(1998)294–305.
[4] X. Song, J. Zhang, Y. Han, J. Jiang. Semi-supervised feature selection via hierarchical regression for web image classification. Multimedia Systems 22(1) (2016) 41-49.
[5] K. Li, Y. Zhu, J. Yang, J. Jiang. Video super-resolution using an adaptive superpixel-guided auto-regressive model. Pattern Recognitions 51 (2016) 59-71. [6] Y. Zhu, K. Li, J. Jiang. Video super-resolution based on automatic key-frame selection and feature-guided variational optical flow. Signal Processing – Image
Communication 29(8) (2014) 875-886.
[7] A. Santella, M. Agrawala, D. DeCarlo, D. Salesin, M. Cohen, Gaze-based interaction for semi-automatic photo cropping,in CHI ‟06: Proc. the SIGCHI conference on Human Factors in computing systems, New York (2006) 771–780.
[8] D. DeCarlo, A. Santella, Stylization and abstraction of photographs, ACM Trans. Graphics 21 (3) (2002) 769–776. [9] M. Rubinstein, A. Shamir, S. Avidan, Improved seam carving for video retargeting, ACM Trans. Graph.27 (3)(2008) 16.
[10] S. Marat, M. Guironnet, D. Pellerin, Video summarization using a visual attention model,in Proc. 15th European Signal Proc. Conf. (2015) 1784-1788. [11] S. Marat, T. Ho-Phuoc, L. Granjon, N. Guyader, D. Pellerin, A. Gue´rin-Dugue´, Modeling spatio-temporal saliency to predict gaze direction for short videos,
Int. J. Computer Vision 82 (3) (2009) 231-243.
[12] C. Muhl, Y. Nagai, G. Sagerer, On constructing a communicative space in HRI,in Proc. 30th German Conf. Artificial Intelligence (2007) 264–278. [13] J. Han, P. Zhou, D. Zhang, G. Cheng, L.Guo, Z. Liu, S. Bu, J. Wu, Efficient, simultaneous detection of multi-class geospatial targets based on visual saliency
modeling and discriminative learning of sparse coding, ISPRS J, Photogrammetry and Remote Sensing 89 (2014) 37-48.
[14] J. Zhang, Y. Han, J. Jiang. Tensor rank selection for multimedia analysis. Journal of Visual Communication and Image Representation 30 (2015) 376-392. [15] A. M. Treisman, G. Gelade, A feature-integration theory of attention, Cognitive psychology 12 (1) (1980) 97-136.
[16] J. Harel, C. Koch, P. Perona, Graph-based visual saliency,in Proc. Neural Information Processing Systems (2007)545–552.
[17] S. He, J. Han, X. Hu, M. Xu, L. Guo, T. Liu, A biologically inspired computational model for image saliency detection, in Proc. ACM Int. Multimedia Conf. (2011) 1465–1468.
[18] T. Judd, K. Ehinger, F. Durand, A. Torralba, Learning to predict where humans look, in International Conference on Computer Vision (2009) 2106–2113. [19] S. Goferman, L. Zelnik-Manor, A. Tal, Context-aware saliency detection, IEEE Trans Pattern Anal. Mach. Intell. 34 (10) (2012) 1915-1926.
[20] L. Itti, C. Koch, E. Niebur, A model of saliency-based visual attention for rapid scene analysis, IEEE Trans Pattern Anal. Mach. Intell., 20 (11) (1998) 1254–1259.
[21] C. Siagian, L. Itti, Rapid biologically-inspired scene classification using features shared with visual attention, IEEE Trans Pattern Anal. Mach. Intell. 29 (2) (2007) 300–312.
[22] D. Rudoy, D. B. Goldman, E. Shechtman, Learning video saliency from human gaze using candidate selection, In Proc. IEEE Conf. Computer Vision and Pattern Recognition (2013) 1147–1154.
[23] J. Han, L. Sun, X. Hu, J. Han, L. Shao, Spatial and temporal visual attention prediction in videos using eye movement data, Neurocomputing145 (2014) 140-153.
[24] G. Li, Y. Yu, Visual Saliency Detection Based on Multi scale Deep CNN Features, IEEE Transon Image Processing25 (11) (2016) 5012-5024. [25] H. Lia, J. Chenb, H. Luc, Z. Chic, CNN for saliency detection with low-level feature integration, Neurocomputing226 (22) (2017) 212-220. [26] Wenguan Wang, Jianbing Shen, Ling Shao, Deep Learning For Video Saliency Detection, arXiv, 2017
[27] M. Dorr, T. Martinetz, K.R. Gegenfurtner, E. Barth, Variability of eye movements when viewing dynamic natural scenes, Journal of Vision 10 (10) (2010) 28. [28] C. Koch, S. Ullman, Shifts in selective visual attention: towards the underlying neural circuitry, Human Neurobiology 4 (4) (1986) 219.
[29] H. Chua, J. Boland, R. Nisbett, Cultural variation in eye movements during scene perception, In Proc. the National Academy of Sciences 102 (2005) 12629–12633.
[30] J.K. Tsotsos, S.M. Culhane, W.Y.K. Wai, Y. Lai, N. Davis, F. Nuflo, Modeling visual attention via selective tuning, Artificial Intelligence 78 (1995) 507-545. [31] R. Milanese, Detecting salient regions in an image: From biological evidence to computer implementation, PhD thesis, Univ. Geneva, 1993.
[32] S. Baluja, D. Pomerleau, Using a saliency map for active spatial selective attention: Implementation &initial results, in Proc. Neural Information Processing Systems (1994) 451–458.
[34] J. Han, S. He, X. Qian, D. Wang, L. Guo, T. Liu, An object-oriented visual saliency detection framework based on sparse coding representations, IEEE Trans. Circuits Syst. Video Technol. 23 (12) (2013) 2009–2021.
[35] A. Borji, L. Itti, State-of-the-art in visual attention modeling, IEEE Trans Pattern Anal. Mach. Intell.35 (1) (2012) 185–207.
[36] W. Kim, C. Jung, C. Kim, Spatiotemporal saliency detection and its applications in static and dynamic scenes, IEEE Trans. Circuits Syst. Video Technol.21 (4)(2011) 446–456.
[37] X. Hou,L. Zhang, Saliency detection: A spectral residual approach,in Proc. IEEE Conf. Computer Vision and Pattern Recog. (2007) 1–8.
[38] C. Guo, Q. Ma, L. Zhang. Spatio-temporal saliency detection using phase spectrum of quaternion Fourier transform, In Proc. IEEE Conf. Computer Vision and Pattern Recognition (2008) 1–8.
[39] X. Cui, Q. Liu, D. Metaxas, Temporal spectral residual: fast motion saliency detection, in Proc. ACM Int. Multimedia Conf. (2009) 617–620.
[40] X. Hou, L. Zhang, Dynamic visual attention: Searching for coding length increments, in Proc. Advances in Neural Information Processing Systems (2008) 681–688.
[41] D. Zhang, J. Han, L. Jiang, S. Ye, X. Chang. Revealing Event Saliency in Unconstrained Video Collection. IEEE Transactions on Image Processing 26 (4) (2017) 1746-1758.
[42] W. Wang, J. Shen, L. Shao. Consistent Video Saliency Using Local Gradient Flow Optimization and Global Refinement. IEEE Transactions on Image Processing 24 (11) (2015) 4185.
[43] J. Han, G. Cheng, Z. Li, D. Zhang. A Unified Metric Learning-Based Framework for Co-saliency Detection. IEEE Trans. on Circuits and Systems on Video Technology (99) (2017) 1-1.
[44] D. Zhang, D Meng, J. Han. Co-Saliency Detection via a Self-Paced Multiple-Instance Learning Framework. IEEE Transactions on Pattern Analysis & Machine Intelligence 39 (5) (2017) 865-878.
[45] X. Yao, J. Han, D. Zhang, F. Nie. Revisiting Co-Saliency Detection: A Novel Approach Based on Two-Stage Multi-View Spectral Rotation Co-clustering. IEEE Transactions on Image Processing 26 (7) (2017) 3196.
[46] C. Ma, J. B. Huang, X. Yang, M. Yang. Hierarchical convolutional features for visual tracking. in IEEE International Conference on Computer Vision, (2015) pp. 3074–3082
[47] L. Wang, W. Ouyang, X. Wang, H. Lu. Visual tracking with fully convolutional networks. in IEEE International Conference on Computer Vision, 2015. [48] Y. H. Tsai, G. Zhong, M. H. Yang. Semantic co-segmentation in videos. in European Conference on Computer Vision, (2016) pp. 760–775.
[49] G. Li, Y. Yu Visual Saliency Detection Based on Multiscale Deep CNN Features. IEEE Trans on Image Processing 25(11) (2016) 5012-5024. [50] H. Lia, J. Chenb, H. Luc, Z. Chic CNN for saliency detection with low-level feature integration. Neurocomputing 226(22) (2017) 212-220. [51] C. Bak, A. Erdem, E. Erdem. Two-stream convolutional networks for dynamic saliency prediction. (2016) arXiv preprint arXiv:1607.04730.
[52] W. Wang, J. Shen, L. Shao. Video Salient Object Detection via Fully Convolutional Networks. IEEE Transactions on Image Processing PP (99) (2017) 1-1. [53] J. Han, H. Chen, N. Liu, C. Yan, X. Li. CNNs Based RGB-D Saliency Detection via Cross-View Transfer and Multi view Fusion. IEEE Transactions on
Cybernetics PP (99) (2017) 1-13.
[54] D.J. Berg, S.E. Boehnke, R.A. Marino, D.P. Munoz, L.Itti, Free viewing of dynamic stimuli by humans and monkeys, J. Vis.9 (5) (2009) 1–15.
[55] E. Vig, M. Dorr, M.T. Martinetz, E. Barth, Intrinsic dimensionality predicts the saliency of natural dynamic scenes, IEEE Trans Pattern Anal. Mach. Intell.34 (6) (2012) 1080-1091.
[56] H. Hadizadeh, M.J. Enriquez,I.V. Baji, Eye-tracking database for a set of standard video sequences, IEEE Trans. Image Process.21 (2) (2012) 898-903. [57] L.Itti, Automatic foveation for video compression using a neurobiological model of visual attention, IEEE Trans. Image Process.13 (10) (2004) 1304–1318. [58] P. Mital, T. Smith, R. Hill, J. Henderson, Clustering of gaze during dynamic scene viewing is predicted by motion, Cognitive Computation3 (1)(2011) 5–24. [59] Y. Yuan, H. Lv, X. Lu. Semi-supervised change detection method for multi-temporal hyperspectral images. Neurocomputing 148(19) (2015) 363-375. [60] X. Lu, Y Yuan, P Yan. Sparse coding for image denoising using spike and slab prior. Neurocomputing 106 (6) (2013) 12-20.
[61] X. Lu , X Zheng, X Li. Latent Semantic Minimal Hashing for Image Retrieval. IEEE TRANSACTIONS ON IMAGE PROCESSING 26 (1) (2016) 355-368. [62] X. Lu, Y Sun, Y Yuan. Image reconstruction by an alternating minimization. Neurocomputing 74 (5) (2011) 661-670.
[63] X. Li, L. Mou, X. Lu. Scene Parsing From an MAP Perspective. IEEE TRANSACTIONS ON CYBERNETICS 45 (9) (2015) 1876-1886. [64] P. Jiang, X. Qin, Key frame-based video summary using visual attention clues, IEEE Trans. Multimedia17 (2) (2010)64–73.
[65] A. Garcia-Diaz, X.R. Fdez-Vidal, X.M. Pardo, R. Dosil, Decorrelation and distinctiveness provide with human-like saliency,” in Proc. Advanced Concepts for Intelligent Vision Systems (2009) 343–354.
[66] A. Hanjalic, L.Q. Xu, Affective video content representation and modeling, IEEE Trans. Multimedia 7 (1) (2005) 143-154.
[67] C. Maioli, I. Benaglio, S. Siri, K. Sosta, S. Cappa, The integration of parallel and serial processing mechanisms in visual search: evidence from eye movement recordings, Eur. J. Neurosci.13 (2)(2001) 364–372.
[68] J Ren, J Jiang, Hierarchical modeling and adaptive clustering for real-time summarization of rush videos, IEEE Trans. Multimedia11 (5)(2009) 906–917. [69] L. Itti, C. Koch, Computational modelling of visual attention, Nature Rev. Neuroscience2 (3) (2001) 194–204.
[70] Y. Ma, H. Zhang, Contrast-based image attention analysis by using fuzzy growing, in Proc. 11th ACM Int. Multimedia Conf. (2003) 374–381. [71] D. Walther, C. Koch, Modeling attention to salient proto objects, Neural Networks 19 (9) (2006) 1395–1407.
[72] N. Bruce, J. Tsotsos, Saliency based on information maximization, in Proc. Neural Information Processing Systems (2006) 155–162.
[73] O. Le Meur, P. Le Callet, D. Barba, D. Thoreau, A coherent computational approach to model bottom-up visual attention, IEEE Trans Pattern Anal. Mach. Intell.28 (5) (2006) 802–817.
[74] Y. LeCun, L. Bottou, Y. Bengio, P. Haffner, Gradient-based learning applied to document recognition, Proc. IEEE86(11) (1998) 2278–2324. [75] G.E. Hinton, R.R. Salakhutdinov, Reducing the dimensionality of data with neural networks, Science313 (5786) (2006) 504–507.
[76] G.E. Hinton, S. Osindero, Y. Teh, A fast learning algorithm for deep belief nets, Neural Computation18 (2006) 1527–1554. [77] Y. Bengio, Learning deep architectures for AI, Foundations and Trends in Machine Learning2 (1) (2009) 1–127.
[78] Y. Bengio, Y. LeCun, Scaling learning algorithms towards AI, Large-Scale Kernel Machines (2007) 321–359.
[79] S.Ji, W.Xu, M. Yang, K. Yu, 3D convolutional neural networks for human action recognition, IEEE Trans Pattern Anal. Mach. Intell. 35 (1) (2013)221–231. [80] M. Yang, S. Ji, W. Xu, J. Wang, F. Lv, K. Yu, Y. Gong, M. Dikmen, D.J. Lin, T.S. Huang, Detecting human actions in surveillance videos, in Proc. TREC
Video Retrieval Evaluation Workshop (2009).
[81] G.W. Taylor, R. Fergus, Y. LeCun, C. Bregler, Convolutional learning of spatio-temporal features, in Proc. 11th European Conf. Computer Vision (2010) 140–153.
[82] J. Fan, W. Xu, Y. Wu, Y. Gong, Human tracking using convolutional neural networks, IEEE Trans. Neural Networks 21 (10)(2010) 1610–1623.
[83] R. Collobert, J. Weston, A unified architecture for natural language processing: Deep neural networks with multitask learning, in Proc. 25th Int. Machine Learning Conf. (2008) 160–167.
[84] H. Lee, P. Pham, Y. Largman, A. Ng, Unsupervised feature learning for audio classification using convolutional deep belief networks, in Proc. Advances in Neural Inform. Proc. Systems (2009)1096–1104.
[85] S.C. Turaga, J.F. Murray, V. Jain, F. Roth, M. Helmstaedter, K. Briggman, W. Denk, H.S. Seung, Convolutional networks can learn to generate affinity graphs for image segmentation,Neural Computation 22(2) (2010) 511–538.
![Fig. 10. Results of saliency maps extracted from GBVS [16], OBJ [23], MLSN[111], MCDL[112], STAD[113], SAG[114], TMSR[45] and the proposed method in comparison of the ground truth](https://thumb-us.123doks.com/thumbv2/123dok_us/1424362.95123/12.612.52.565.50.352/results-saliency-extracted-proposed-method-comparison-ground-truth.webp)