City, University of London Institutional Repository
Citation:
Bloomfield, R. E., Popov, P. T., Salako, K., Stankovic, V. and Wright, D. (2017).
Preliminary Interdependency Analysis: An Approach to Support Critical Infrastructure Risk
Assessment. Reliability Engineering and System Safety, 167, pp. 198-217. doi:
10.1016/j.ress.2017.05.030
This is the published version of the paper.
This version of the publication may differ from the final published
version.
Permanent repository link:
http://openaccess.city.ac.uk/id/eprint/17456/
Link to published version:
http://dx.doi.org/10.1016/j.ress.2017.05.030
Copyright and reuse: City Research Online aims to make research
outputs of City, University of London available to a wider audience.
Copyright and Moral Rights remain with the author(s) and/or copyright
holders. URLs from City Research Online may be freely distributed and
linked to.
ContentslistsavailableatScienceDirect
Reliability
Engineering
and
System
Safety
journalhomepage:www.elsevier.com/locate/ress
Preliminary
interdependency
analysis:
An
approach
to
support
critical-infrastructure
risk-assessment
Robin E. Bloomfield
a ,b, Peter Popov
a, Kizito Salako
a ,∗, Vladimir Stankovic
a, David Wright
aaTheCentreforSoftwareReliability,City,UniversityofLondon,EC1V0HB,London,UK bAdelardLLP,24Waterside,44-48WharfRoad,LondonN17UX,London,UK
a
r
t
i
c
l
e
i
n
f
o
Keywords:
Interdependencyanalysis Riskassessment Cascadingfailure
Criticalinfrastructureresilience
a
b
s
t
r
a
c
t
Wepresentamethodology,PreliminaryInterdependencyAnalysis(PIA),foranalysinginterdependenciesbetween criticalinfrastructure(CI).Consistingoftwophases– qualitativeanalysisfollowedbyquantitativeanalysis– anapplicationofPIAprogressesfromarelativelyquickelicitationofCI-interdependenciestothebuildingof representativeCImodels,andthesubsequentestimationofanyresilience,riskorcriticalitymeasuresanassessor mightbeinterestedin.Bydesign,stagesinthemethodologyarebothflexibleanditerative,resultingininteracting CImodelsthatarescalableandmayvarysignificantlyincomplexityandfidelity,dependingontheneedsand requirementsofanassessor.Formodelparameterisation,onereliesonacombinationoffielddata,sensitivity analysisandexpertjudgement.Facilitatedbydedicatedsoftwaretoolsupport,weillustratePIAbyapplyingittoa complexcase-studyofinteractingPower(distributionandtransmission)andTelecommunicationsnetworksinthe Romearea.Anumberofstudiesarecarriedout,including:1)aninvestigationofhow“strengthofdependence” betweentheCIs’ componentsaffectsvariousmeasuresofriskanduncertainty,2)forresourceallocation,an explorationofdifferent,butrelated,notionsofCIcomponentimportance,and3)highlightingtheimpactof modelfidelityontheestimatedriskofcascades.
CrownCopyright© 2017PublishedbyElsevierLtd. ThisisanopenaccessarticleundertheCCBYlicense.(http://creativecommons.org/licenses/by/4.0/)
1. Introduction
Itisrecognisedthatoneofthechallengesinenhancingtheprotection ofCriticalInfrastructures1(CIs)againstaccidents,naturaldisasters,and
actsofterrorism(includingcyberterrorism)isestablishingand main-taininganunderstandingoftheinterdependenciesbetween infrastruc-tures.Governmentalagenciesresponsibleforprotectingnationalcritical infrastructureneedmethodsandtoolstoassessrisks(includingthose relatedtointerdependencies)andevaluate thealternativesavailable formitigatingthese.Theownersandoperatorsof critical infrastruc-tureneedtoknowthelikelyimpact,ontheirservices,ofdisruptions fromotherinfrastructures,sotheycandevelopmitigations(e.g.intheir emergencyplanning)andmakeconsideredinvestmentsinresilience[1] . Onceonerecognisestheimportance– intermsofrisks– of interde-pendenciesbetweencriticalinfrastructures,oneisthenfacedwiththe feasibilityandcostofarisk-assessment[2–5] ,sincecritical infrastruc-turesaretypicallylargeandverycomplexsystems.Model-based risk-assessmentcanofferafeasibleandcost-effectiveassessmentapproach foranassessor,iftheassessorcangainenoughconfidencethather
mod-∗Correspondingauthor.
E-mailaddresses:reb@csr.city.ac.uk,reb@adelard.com(R.E.Bloomfield),ptp@csr.city.ac.uk(P.Popov),k.o.salako@city.ac.uk(K.Salako),Vladimir.Stankovic.1@city.ac.uk(V. Stankovic),d.r.wright@city.ac.uk(D.Wright).
1AsdefinedbytheU.S.DepartmentofHomelandsecurity(seehttps://www.dhs.gov/ what-critical-infrastructure).
els arerepresentative of thesystem’sbehaviour,capturingwhat she judgestobeessentialinterdependencies.Facedwithnumerouschoices aboutmodelstructure,fidelityandparameters,ourassessorcan gain confidencein amodelbya successionof modelrefinements,each re-finementresultingfromverifyingandvalidatinganearlierversionof amodelandmakingjudgementsaboutwhatchangestothemodelare neededforanimprovementwhile,atthesametime,notputtinginmore detailthanshejudgestobenecessaryforherneeds.So,forinstance,if anassessorhascertainrisk-measures2inmind(e.g.thedistributionof
lossin network-connectivityresulting fromcomponentfailureor the distributionoflossinsuppliedelectricalpowerduetoline-outagesina snowstorm)which,tobecomputed,requirethemodeltoexplicitlyhave dynamicsofacertainkind(e.g.packet-routingalgorithmsorelectrical powerflowmodels),thenthesedynamicswillneedtobeincorporated inarevisionofthemodel.
Clearly,withsomanychoicestomake,thetaskofmodelbuilding andrefinementcanbeadauntingone,withseriousramificationsforthe
2Inthispaper,foreaseofpresentationandwithout-loss-of-generality,arisk-measureis
aprobabilitydistributionofunwantedeventsarisingfromrandomchangesinaCI’sstate.
http://dx.doi.org/10.1016/j.ress.2017.05.030
Received8July2015;Receivedinrevisedform21March2017;Accepted18May2017 Availableonline22May2017
risk-assessmenttobe carriedout.Anymethodology/toolswhich sup-portanassessorinthisendeavourshouldaffordtheassessorthe flex-ibilityto(1)createmodelsatanydesiredlevelofabstraction,(2) al-ter/add/removestochasticanddeterministicprocesses,and(3)define anyrisk-measureofinterest.Tothisend,weproposePreliminary Inter-dependencyAnalysis(PIA)– asystematicmethodtosupportbuilding, refiningandanalysingmodelsof interdependentLargeComplex Criti-calInfrastructures(LCCI).PIAstarts off atahigh-levelof abstraction, supportingacyclic,systematicthoughtprocess,directedtowards iden-tifyingdependenciesbetweencomponentsofCIs.Eventually,(hybrid) probabilisticmodelsaredeployed,oncetheyhavebeenjudgedtobe appropriateforrisk-assessment; theseareusedtoconductstudies fo-cussedoncomputingdifferentmeasuresofinterests,e.g.thelikelihood ofcascadefailureunderagivensetofassumptions,orthe identifica-tionoftheweakestlinkinthemodelledsystem.And,ifmodellingwith evengreaterdetailisrequired,PIAcanassistinthisprocesstoo,e.g.by addingmodelsoftheconsequencesofLCCIoperatoractions,orby intro-ducingvariousconstraintsonsuchactions,suchaslimitingthe main-tenanceresourcesavailableinthecaseofamajordisaster,oradding deterministicmodelsspecifictoaparticularLCCI(e.g.powerflowsfor powersystems).
ThePIAmethodisapplicableasboth:
1. alightweightmethodusedtoprovideaninitialidentificationof in-terdependenciesandtoscopetheoptionsformoredetailedstudies. Theapproachshouldbeaccessibletoarangeofstakeholders, partic-ularlySmall-to-MediumEnterprises(SMEs)insupportoftheirbusiness continuityplanning
2. amoreheavyweightmethodofstudying,withanincreasinglevel ofdetail,complexregionalandnationwideCIsbycombining prob-abilisticanddeterministicmodelsoftheCIs.
TherearenumerousstudiesaboutCIinterdependencies,including somewhichrelyoncomplexdynamicmodels.Aspointedoutinarecent survey[6] summarisingresearchoninterdependenciesinpowersystems forthelast5years,manystudiesanalyseinterdependencieswithout de-tailinghowtheseinterdependencieswereidentifiedinthefirstplace, givingtheimpressionthattheinterdependenciesareallknowntothe analyst.Systematicmethodswhich canbe followedtoidentify inter-dependenciesarelackingintheliterature.Theauthorsofthesurvey, therefore,recommendthatmethodsforinterdependencyidentification begivenhighpriority.Weagree,andPIAprovidessignificantsupport inthisdirection.
WeillustratetheuseofPIAonarealisticcasestudy:aregional sys-temoftwoCIs,namelythepowergridandthetelecommunication net-workaroundRome,Italy(i.e.Romecase-study).Inthestudy,weused asetoftools– thePIAToolkit– whichconsistsoftwosoftware appli-cationswedeveloped:
• UsingthePIADesigner,amodellercanconstructandparameterize avisualrepresentationofinterdependentCIs.ThePIADesigner con-vertsthisvisualmodelintoaprobabilisticmodelreadytobesolved viaMonteCarlosimulation.TheDesignerusesthirdparty propri-etarysoftwarecalledASCE[7] .
• TheExecutionEngineallowsforMonteCarlosimulationusing mod-elscreatedwiththePIADesigner.TheExecutionengineusesMöbius
[8] ,whichwecustomisedextensivelyto1)allowforvariousforms ofdependenciesbetweenthemodelledelements,and2)for integra-tionofthirdpartysoftwareinsimulation(e.g.variousdeterministic flowmodels,typicallyusedwiththeCIs).
Therestofthepaperisorganisedasfollows.Section 2 presents re-latedresearch,whileanoverviewofthePIAmethod– bothits qualita-tiveandquantitativeaspects– isgiveninSection 3 .Section 4 detailsthe mathematicalfamilyofmodelsunderlyingquantitativePIA,including modelsofinterdependentCIsandtheirdependentconstituent compo-nents.InSection 5 we describethecasestudyused toillustrateour approach.Thisisfollowedbyapresentationofresultsobtained,anda
discussionoftheirplausibility,inSection 6 .InSection 7 ,wediscussour findings,andopenissuesforfutureresearch,whilefinallyconcluding thepaperinSection 8 .Appendix A containsadetailedillustrationof modeldevelopmentovervariousstagesofPIA,usingPIAstoolsupport intheaforementionedcase-study.
2. Relatedresearch
TheauthoritativepaperbyRinaldietal.[9] established interdepen-dencyrelatedterminologyandconcentratesonhighleveldependencies betweeninfrastructures.Itwasnoticed,however,thatsuchanapproach, althoughusefulataconceptuallevel,isinappropriateforrisk quantifi-cationasfurtherelaborationisneeded.Manyauthors,including our-selves,havesincearguedinfavourofservice-levelmodelsofadifferent flavour.
AnoverviewofCIinterdependencyresearchisprovidedinour ear-lierstudyon interdependenciesforUKagencies[10,11] .A more re-centsurveyis[12] ,inwhichanumberofmodellingandsimulation ap-proachesaregroupedintosixcategories:1)Empirical,2)Agent-based, 3) Economic-based, 4) Complex-Networkbased, 5) System-dynamics basedand6)“Others”,whichcoversallapproachesnotincludedinthe previouscategories.Accordingtothisclassification,ourworkbelongsto the“Others” category,partlybecauseourworkincorporatesapproaches frommorethanonecategory.WecomparetheseapproachestoPIA be-low.
PIAallowsonetoestimate riskusingalternative,consistent mod-els,therebyallowingrisk-measuresresultingfromthesemodelstobe directlycompared.Weseethiscapabilityasausefulstepinaddressing theresearchgapidentifiedattheendofsection4.1.2in[12] .Asan empiricalmodellingapproach,PIAcanbeusedfor1)identificationof frequentandsignificantfailurepatterns,aswellas2)quantificationof anyrisk-measureschosenbyanassessor.
Agent-based models, consisting of dynamically interacting rule-based agents,arebasedon theideathatcomplex behaviour or phe-nomena emergefrom manyindividual andrelatively simple interac-tionsofautonomousagents[13–15] .Intermsofemergentmodel prop-erties,therearesimilaritiesbetweenPIAandagent-basedmodelling ap-proaches.Thedeterministicrulesthatgovernthebehaviourofagents canbemodelledinPIAaswell,asthedeterministicresponsesof com-ponents toasystem’srandomchangesintime. But,PIAextendsthis conceptbyintroducingstochasticassociations,whichdefine determinis-ticrulesgoverninghowtheuncertaintyinthemodeldependsuponthe stateofthesystemanditscomponents.
Incontrastwiththe“bottom-up” approachofAgent-basedmodels,
System-dynamicsapproachestakea“top-down” view[16–18] by focus-ingonthenonlinearbehaviourofsystemsovertime,usingstocksand
flows,internalfeedbackloopsandtimedelays.Thisnonlinearbehaviour istypicallycharacterisedbyasetofdifferentialequationscapturingthe behaviour ofsystemswithfixednetworktopologies– some seethisas asignificantlimitation[12] .PIAisfullycompatiblewiththese tech-niques,butinadditionallowsanassessortoanalyseasystemwith un-certaintyinnetworktopology.
timedistributionthatcanbesampledfromefficientlycanbe usedin definingtheprocess.
Complex-Networkbased approaches [24,25] , broadlygroupedin
[12] intotopology-basedandflow-basedmethods,modelsingleCIsby networks(i.e.graphswithnodesandlinks)anddescribe interdependen-ciesbyinter-links,providingCIrepresentationswithdetailed descrip-tionsoftheirtopologiesandflowpatterns.Intermsofmodelfidelity, theseapproachesarepitchedatafairlyhighlevelofabstraction.Also, theuseofprobabilisticallyindependenteventsisquitecommonwiththese approachesandsimplifiestheanalysisofsuchmodels.PIAis,however, notrestrictedbylevelofabstraction,ortheuseofprobabilistically in-dependentevents.Onthecontrary,weencouragePIAuserstoexplore variouslevelsofabstractionandalternativeformsofstochastic depen-dencebetweenthemodelledentities.Bysuchexploration,anassessor isbetterequippedtomakeaninformeddecisionaboutmodelaccuracy andusefulness.
In[26] anapproachtomodellinginterdependenciesis developed thatconsidersbothstructuralproperties,usingtechniquesemployedin graphtheory,aswellasfunctionalproperties,toincreasethefidelity andusefulnessoftheapproach.Theapproachisappliedtoacomplex case-studythatincludesrailtransportation,powergridand telecommu-nication.Inessence,thisisusedtostudytheeffectsofremovingasingle componentfromtherespectivenetworkandhowsystemperformance variesasaresult.Thework,however,doesnottakeintoaccountthe likelihoodsofdifferentcomponentsbecominginoperable;thisis signif-icantlydifferentfromourmethodology.Also,theapproachisclearly limitedinitspotentialtoseetheeffectsofmultipleelementsbeing re-moved(e.g.whentheyfailsimultaneously).
Aninterestingobservationmadein[27] isthatservicesinsometypes ofinfrastructure,suchastelecommunicationsortheelectricgrid,are providedandconsumedinstantly.Others,notablyoil,gasand infras-tructurebuiltonphysicalresources,however,exhibitbuffering char-acteristics.Thisaspectisnotexplicitlymodelledinourapproach, al-thoughtakingthisintoaccountshouldnotposeaproblem-PIAoffers waysofmodellingcomplexstochasticbehaviourandbuffering(at cer-tainlevelofabstraction)seemsnomorethandeterministicdelays be-tween“cause” and“consequences”.Moredetailedmodelsofbuffering canbeaddedviaacustom-builtdeterministicmodel.
Anapproachsimilartooursispresentedin[28] inwhichtheauthors seemtorefertoascaled-downversionofthecase-studyusedinthis pa-per,andconcentrateonmodellingtheavailabilityoftheSCADAsystem. Thekeydifferenceisthatthefocusthereisonthetopologyofthe spe-cificsystemandonbuildingaspecialisedStochasticActivityNetworks
(SAN)modelofavailability,ratherthanpresentingagenericmethodof studyingCIinterdependencyscenarios.Inaddition,basedonour experi-ence,buildingSANmodelsfromscratchforeverynewcase-study’does notscale’ up– forscenariosoftypicalcomplexityitistimeconsuming, errorproneandcanbedifficulttodebug.Weaddressedthisdifficulty bydevelopingatoolsupport,basedonSANformalismandASCEtool, whichcomplementsPIA,andwhichisbrieflysummarisedinthe intro-ductionanditsuseisdemonstratedintheappendix.Alargenumberof publicationsreviewtheconceptofriskwhenappliedtointerdependent CI.Thesurveyin[29] discussesanumberofapproaches,andproposes anapproacheasilyapplicableinpractice.Theseauthorsargueinfavour ofrankingtheincidentsaccordingtotheirfrequencyandimpactand demonstratetheapplicationtoacase-studyofcriticalinfrastructuresin Oslo.Theapproach,however,seemssimplistic,astheballparkfigures usedforrankingtheincidentsarenotconvincing.Insteadofadopting asimilar view– prescribing aparticularwayofdefiningcomponent criticality– inthispaperwedemonstratethatcriticalitymayvary sig-nificantlywiththedefinitionofcriticality.Acomponentseenashighly criticalusingone definitionof criticality,e.g.theoneused bythose authors,maywellturnouttobealowcriticalitycomponentusinga differentdefinitionofcriticality,e.g.thelikelihoodofacomponent be-ingapartofalargecascade.Wediscussthepracticalimplicationofour observation.
ItisalsointerestingtorelatePIAtoothermethodsusedinsafetyand dependabilityanalysis.Methodsforsafetyanalysiscanbeunderstoodin termsofhowtheysupportthediscoveryoftherightsystemmodel(even ifimplicitly)andtheexplorationoftheimplicationsofthatmodele.g. byexploringitsstatespace.Techniquessuchasfault-treeanalysis(FTA) orfailure-mode,effectsandcriticalityanalysis(FMECA)largelyconcern exploringanexistingmodel(e.g.onegivenbyplantdiagrams,a cir-cuitboarddesign).ConductingHazardOperabilitystudies(HAZOP)isan interestingtechnique, inthatitcombinesthediscoveryofthe appro-priatemodelwithanexplorationoftheimplicationsofthatmodel:in undertakingasecurity-informedHAZOP,theattacksorfailureof the systemmaycomefrom amuch lowerlevelof abstractionthan origi-nallychosen,ortheconnectivityinthesystemmightbedifferentfrom thatassumed.PIAissimilar inthis regard,combiningmodel discov-eryandanexplorationofmodelconsequences.PIAoffersmore, how-ever.For,whilesomeinterdependenciesareobviousoncethemodelis scopedcorrectly,manyotherbehavioursarecomplex,requiringa de-tailedsimulation-basedapproachtoexplorenotjusttheconsequences ofthemodelbutalsotheimpactofuncertaintyinmodelstructure.
3. Method:preliminaryinterdependencyanalysis(PIA)
PreliminaryInterdependency Analysis(PIA)isananalysisactivity thatseekstounderstandtherangeof possibleinterdependenciesand provideajustifiedbasisforfurthermodellingandanalysis.Givena col-lectionofCIs,theobjectivesofPIAaretodevelopandanalyse,through aprocessofiterativerefinement,anappropriatemodelforthe infras-tructures,andtodocumentassumptionsaboutresources,environmental impact,threatsandotherfactors.
ThecontextwithinwhichPIAmodelsaredeveloped,andanalysed, isdefinedbyascenarioandrelatedrequirements.Here,thenarrative aspectofascenarioisenormouslyimportant,asitprovidesthebasis foraskingquestionsanddiscoveringinterdependencies;typically,this isthestartingpointfortheuseofmoreformalmodels.
Fig. 1 illustrateshowone mightstartconstructing,say,a service model, andidentifyinginterdependenciesbetween theservices.Each oftheservicesislikelytoconsistofvariouscomponents.InFig. 1 we showtwoserviceswiththeirrespectiveInformationandCommunications Technology(ICT),components,networks,andinformationassets.Some
reasonswhyinterdependenciesmayexistbetweenservicesinclude:
• Functionaldependencies,i.e.aserviceconsumestheoutputofanother serviceaseitherinput(e.g.oilisusedasarawmaterialinachemical plantandissubjectedtotransformation)orresourceused(e.g.fuel forheating,orpowerforcommunicationequipment);
• Similarcomponents,e.g.ICTcomponentsusedinmultipleservices, viawhichcommoncause/modefailuresmayleadtosimultaneousor relatedfailuresoftheservices(e.g.avirusmayaffectthecomputers runningthesamestandardconfigurationofOS/applicationsusedby differentservicesproviders);
• Commonenvironment.Stressfulconditions in theenvironment are likelytoincreasethelikelihoodoffailureorcauseafailureof com-ponentsindifferentservices.Spatialdependenciesareatypical ex-amplehere,butonecaneasilyenvisageotherformstoo,e.g. ser-vicesusethesamecloudproviderfortheirIToperationwhichwill leadtosimultaneousimpactonbothservicesifthecloudprovideris stressed.
Fig.1.PIAsourcesofdependenciesbetweenresources.
PIAisbothqualitativeandquantitative:
• Qualitativeanalysis.Themodellingexercisebeginswithadefinition oftheboundariesofthesystemtobestudiedanditscomponents. Startingoff atahighlevel,theanalystmaygothroughacyclical processofrefinements,butmayalsobefocusedonaparticular ser-vice,sothelevelofdetailmayvarybetweenthedifferentpartsofthe overallmodel.Theidentificationofdependencies(e.g.functionalor duetosharedenvironment)willstartatthispoint.
• Quantitativeanalysis.ThemodelscreatedduringthequalitativePIA arenowusedtoconstructanexecutable,i.e.asimulatorofthemodel behaviourinthepresenceoffailures/disruptionsofthemodelled enti-ties– hereafterreferredtoasMEs– forthechosenmodel parameter-isation.Themodelparameterisationmaybebasedeitheronexpert judgementoron analysisof incidentdata.Examplesofsuchdata analysesandfittingtheavailabledatatoplausibleprobabilisticdata modelsarediscussedin[30] .
3.1. PIAmodelarchitecture:twolevelsofabstraction
PIAmodelsbroadlyoperateattwodistinctlevelsofabstraction:
• High Level Service Model (HLSM). At this level the CIs are mod-elledasaset ofinterdependent services andthe environmentin whichtheyoperate.Here,theviewispurposefullyabstract,sothat wecanreasonaboutdependenciesbetweentheservices(e.g.data
centreXdependsonpowerplantY),orbetweentheservicesand theenvironment(e.g.thepowersystemdependsontheweatheror theICTsystemmaybeaffectedbycyber-attacks).Now,each ser-viceis,itself,acomplexcollectionofinteracting,dependent com-ponents.Althoughtheconstituentelementsofservicesarenot ex-plicitlymodelledat thislevel (forsuchdetail,see DSBM below), theinter-servicedependenciesare,andtheyarededucedfrom de-finedlower-leveldependencies/relationshipsamongsttheservices’ constituententities(physicalcomponents,resourcesetc.).Werefer tosuch“cross-service” associationsbetweencomponentsascoupling points.Thecouplingpointsincomingtoaservicecanberelatedto theresourcesthattheservicerequires(e.g.,atelecommunication serviceconsumes"commodities"suppliedbyapowerservice).The resourcesconsumedbyaservicecanbeobtainedfromthe organi-sation’sreserves(internalresources)orprovidedbyanother organ-isation(externalresources).Theoutgoingcouplingpoints,instead, definehowtheoutputsfromaservicegetconsumedbyother ser-vices(aseitherinputsorresources). Similarly,thedependenceof theservicesontheenvironmentcanbedefinedintermsofcoupling pointsbetweentheenvironmentandtheservices(e.g.“cyber-attack perimeter” canbedefinedintermsofpointsviawhichanadversary canattackanICTservice).
[image:5.595.133.465.57.456.2]includesitsunderlyingprocesses,constituentcomponentsandtheir relationshipswithone-another,relationshipsamongstcomponents fromdifferentbutdependentnetworks.Forinstance,aGlobal Sys-temforMobile(GSM)telecommunicationoperatortypicallyrelieson anetworkofdevicesdeployedtocoveraparticulararea(e.g.masts, etc.).ViaDSBM wecan choosethelevelof detailusedtomodel thesenetworks.IntheexampleaboveDSBMmayrangefroma con-nectivitygraph– representinghowthecomponentsofthenetwork areconnectedtoeachother– toahighfidelitymodelofthe proto-colsusedintheGSMnetwork.WetendtothinkthatDSBMmodels thenetworksowned(atleastpartially)and/ormaintainedbythe re-spectiveserviceoperator,i.e.anorganisation.Althoughsuchaview isnotnecessary,itallowsonetomodelseveralimportantaspectsvia DSBM.Forinstance,thelevelofinvestmentandtheculturewithin theorganisation(e.g.strongemphasisonengineeringvs. outsourc-ingthemaintenance)willaffecthowwellthenetworkismaintained, whichinturnwillaffectthefrequencyofoutagesandthespeedof recovery.Thus,thespeed/rateofrecovery(aparameterthatcanbe usedinaDSBM)canbeausefulproxyofthelevelofinvestmentby theoperator.Inotherwords,throughDSBMonecandescribeand studyinterestingscenarioswhichatfirstmayseemoutsidethescope ofPIA.Anexampleofsuchascenariowouldbeastudyofthe im-pactofderegulationinaparticularcriticalCIgiventhecurrentor projectedinterdependencieswithotherCIs.
3.2. ThePIAprocess
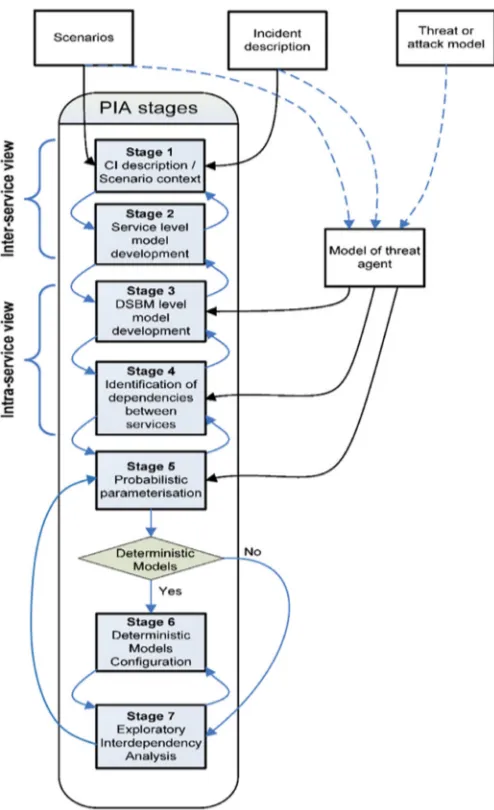
OurexperiencewithPIA[31–33] indicatesthatitcanbeappliedin thefollowingstages(forinstance,seeAppendix A foradetailedaccount ofhowweappliedeachofthesestages.Fig. 2 givesapictorialoverview):
1. CIdescriptionandscenariocontext.ACIdescriptionprovidesa con-cretecontextandconceptofoperation.Thisisthefirstlevelof scop-ingfortheanalysistask;theCIdescriptiongivesthefirstindications ofanalysisboundaries.DSBMentitiesareidentifiedandrecorded andtheoverallCIservicesdefined.Forexample,thecontextofthe case-studyusedtodemonstratePIAinthispaperwasprovidedbythe reallifefloodingofatelecommunicationsnodeintheRomearea
[28] .Thefloodingultimatelyresultedinalossofcommunication betweentwoSCADAcontrolcentresinthelocalpowernetwork.In total,theincidentinvolvedcomponentsfrom5interdependentCI: 2powernetworksand3telecommunicationnetworks.Tobetter un-derstandtheinterdependenciesinvolvedinthisincident,and inter-dependenciesinvolvedinincidentsnotyetseen,these5CIprovide anaturalscopeforthestudy.Infact,theideaofscenarioisstillkey here:onceawell-scopedmodelofinteractingCIhasbeenbuilt,one canseekfurtherinsightbyaskingquestionsofthismodel– ques-tionsphrasedinnewscenarios/contexts.Forinstance,inotherwork usingPIA,weaugmentawell-knownpowernetworkmodel(called NORDIC-32)– createdforothercontexts/scenarios– andusethis augmentedmodelincyber-securityresearch[31,32] .
2. HLSM Modeldevelopment. Amodel of theservices (resources, in-puts,outputs,systemstates),theoperationalenvironmentand sys-temboundariesaredeveloped,basedontheCIdescription.Model boundarydefinitions areusedat thisstage tofurther restrictthe scopeoftheanalysis.Aninitialidentificationismadeof dependen-ciesbetweentheservicesviathecouplingpointsasdefinedinthe
Section 3.1 above.
3. DSBMmodeldevelopment.DSBMsaredefinedbyselectingtheright levelofabstractionfortheservices:allservicesaremodelledas state-machineswhich,asaminimum,consistof“failed” and“Ok” states. Inthiscase,theirrepresentationintheDSBMwillrequirenofurther refinement.Forthoseservices,however,whicharemodelledinmore detail,thestate-machinesmodellingtheirbehaviourmaybe signif-icantlymorecomplex.Westartbydefining,explicitly,their com-ponentsandassets,andmayresorttousingexistingmodelsofthe
Fig.2.PIAmethodstages.
underlyingphysicalnetworksusedbytheservices.Thesenetworks mayincludeanumberofcomponents,whichwecallmodelled enti-ties(MEs).Similarly,theenvironmentmodelisdetailedtoaccount fortheparticularthreatstobeincludedinthestudy.Forinstance, astate-basedadversarymodelcanbedefinedtoincludeanumber ofmodelledentities[31,32] .Alevelofconsistencyisachieved be-tweentheservicemodel(Stage2)andDSBM:thecouplingpoints appearinbothviews.
4. Initialdependencyandinterdependencyidentification.Whilesomeof theservicedependencieshavealreadybeenidentifiedandrecorded inStage2(viainput/output/resourceidentification),atthisstage themodellerlooksforadditionalsourcesofdependence(e.g. com-moncomponents/assets),whichmaymakeseveralservices vulnera-bletocommonfaultsorthreats.Thesecanbederivedbyexamining theservice-levelmodel,takingintoaccountothercontextual infor-mation(e.g.scenarios,threatmodels,attackerprofile).Thecaptured dependenciesaremodelledasstochasticassociationsbetweenthe ser-vicesorcomponentsthereof.ThisisdetailedinSection 4 below. 5. Probabilistic-model development and parameterisation. Since we are
dealingwithriskwetaketheviewthat,giventhestatespaceformed bytheMEs,astochasticprocess[34,35] mustbeconstructedthat capturesthestate-changesandinteractionsoftheMEsovertime. Then,viasimulation,riskisquantifiedasasuitablerandomvariable
[image:6.595.308.555.54.459.2]processdefinedtoestimatetheriskofsomeunwantedevents.We shallrefertoboththeserandomvariablesandtheirrelated prob-abilitydistributionsasrisk-measures. Now,inprinciple,any3
risk-measureofinterestmaybedefinedbyanassessor.And,depending onanassessor’srequirementsandpreferences,shemaydefine mul-tiplerisk-measuresforthesamemodeltoaddressdifferentaspects ofrisk(e.g.risksassociatedwithcomponentunavailability,thesize ofcascadeswhentheyoccur,etc.)Tothisend,atthisstageofPIA, astochasticprocessisdefinedintermsoftheStochasticActivity Net-works(SANs)formalism[36] andthetheoryofCompetingRisks[37] , aswellasanyrisk-measuresofinterest.Examplesofsuchdefinitions aregiveninSections 4 and5 .
6. Deterministicmodelsconfiguration(optionallyaddingdeterministic mod-elsofbehaviour).Ourearlierworkestablishedthatpurely probabilis-ticmodelscan beinadequate in capturingessentialsystem prop-erties,otherwisecapturedbyhybrid models[38] .So, amodeller mightchoosetoextendthebehaviourofaprobabilisticPIAmodel byaddingtoitdeterministic modelsof behaviour.Such astep is usefulwhenseekingtoextendthefidelityofthesimulationbeyond standardmechanismspossible with apurely probabilistic model. Furthermore,suchextensionscan beused tostudytheimpactof thelevelofabstraction/fidelityonthemodellingresults,an impor-tantaspectofmodelvalidation.Examplesofdeterministicmodels includevariousflowmodels(e.g.ACpower-flow,modelsoffluid flow,networktrafficandtransport flowmodels), state-estimation schemes(e.g.Newton-Gaussbasedmethodsusedinpowersystem analysis),networkconnectivitymodels,etc.
7. Quantitative interdependency analysis. A Monte Carlo simulation
[39] isusedtoquantifytheimpactoftheinterdependenciesonthe behaviourofthesystemunderstudyanddrawconclusionsaboutthe interdependency-relatedrisks.
Duringthesestageswefoundthatnarrativeinformationisvery rel-evantanduseful.Itusuallycomesfromthefollowingsources:
• Scenarios:PIAisascenario-drivenapproach.Oncethesystemhas beenmodelled,“what-if” questionswillbeusedtoexplore vulnera-bilitiesandfailurecascadepossibilities.Scenarioscanbedeveloped fromavarietyofassumptionsorexperiences.Forinstance,onecan beginbyaskingaquestionasabstractas“whathappensifthereis aflood”,or“ifpowerplantXfails”.Such questionsform the ba-sisforscenarios,whichfocustheanalysisonparticularconditions, exploringpotentialvulnerabilities.
• Incidentdescription:PIAcanbeusedtomodelanincidentthathas alreadyoccurred.Thiscanbeusedasabaselineforgeneratingand exploringvariationsofthesamescenarioorsimplyfurtherexploring asystemthathasbeencompromised,orhasfailed,astheincident revealedunknownvulnerabilitiesandfailures.
• Threatorattackmodel:here,weareconsideringmodelling assump-tionsbasedonaccidentalfailuresormaliciousattacks.
• Modelofthreatagent:Theabove(scenarios,incidentdescription, threatorattackmodel)areelementsthatwillshapetheprofileofa threatthatismodelledinoursystem.Thiscanbeasourceofnatural disaster(e.g.flood)oramaliciousagent(e.g.aterrorist).
4. Quantitativedependencymodelling
Inthissection,wedescribePIA’squantitativemodellingapproach (underlying stages5–7 of the methodology)which captures various waysinwhich networkcomponentsmightbe dependenton one an-other.Sourcesofdependencebetweennetworkcomponentscaninclude thefollowing:
3Limitationstothisprimarilystemfromwhetherenoughstate-informationcanbe
in-cludedinamodelandsimulated.
1) ThePhysical NetworkTopology: Componentsaresometimesreliant onbeingphysicallyconnectedtoeachotherinordertoreceivea resourceor perform somefunction. Therefore,via these physical connections,thefailureofonecomponentcanimpacttheoperation ofanothercomponent.So,forexample,medium-voltage-trunksare usedtoprovide electricalpowerfromthePowerdistribution net-worktoTelecommunicationnetworksites:damagetothetrunkcan resultinservicedisruptionfromTelecommunicationsnetwork.Also, physicallyco-locatednetworkcomponents,suchasthosepower net-workcomponentssituatedatapowersubstation,mightcollectively beaffectedbythesamedisturbance/event,forinstancelocal flood-ingorforestfires.
2) FunctionalRelationships between components: Network components canberelatedbecausetheyare“coupled” inthefunctionthey per-form.So,forinstance,whenapowerline istripped inthePower TransmissionNetworkthereisaredistributionofpowerflowacross thenetwork.Thisinevitablyaffectsthequalityofserviceprovided atvariouspointsinthenetwork,suchasthelocalamountofload re-quiredatagivenpoint.Anotherexamplecanbeseeninthe Telecom-municationsnetwork,wherebackuppowergeneratorssupply mul-tipleTelecomscomponentswithpowerintheeventofapowercut fromthePowerdistributionnetwork.Potentially,ifthegenerators becomeunavailable,multipleTelecomscomponentsstop function-ing.
3) StochasticCorrelation:Thestatechangesofcomponentsmaybe ob-served tobe correlatedin termsof,both, what new statesthese componentsenterinto,and,whenthesestatechangesoccur.Here, wenotethatsuchcorrelationcouldbeexhibitedbyscenariossuch asthosepointedoutinbulletpoints1and2above.However,we alsoacknowledgeotherpossibilities,suchascomponents experienc-ingsynchronisedfallsandpeaksinthequalityofservicethey pro-videduetophenomenaknowntooccurintechnicalsystems,e.g.
common-modefailures,andcommonstressonnetworkelements re-sultingfromextremeweather, naturaldisastersor newcomputer viruses.
Themodelwedescribehereadequatelycaptureseachofthese ex-amples.Ourexpositiononhowwemodeldependenceiscarriedoutin twosteps:firstly,wegivethedefinitionofanindividualisolatedME’s behaviour(therebyeffectivelyignoringotherMEs)and,secondly,we extend thisbehaviour totakeintoaccount howchangesin thestate oftheMEaffect,andareaffectedby,thestatechangesofotherMEs. Formally,theresultingmodelisageneralisation4ofaContinuous–time Semi–Markovprocess[34,35] which,inordertosimulate,weimplement asaSANintheMöbiusmodellingenvironment[8,36] .
We begin with an individual ME; it experiences a state change withprobability,accordingtoanappropriatelydefinedCompetingRisks
[37] model. Toillustrate, given that theithME can be in any one of the Mi possiblestates ∶={𝑠𝑖1,…,𝑠𝑖𝑀
𝑖} ata givenpointin time,
suppose thattheME entersintoastate𝑠𝑖
𝑗𝑖(𝑡0)∈at timet0 (where 𝑗𝑖=1,…, 𝑀𝑖).Competing Risksthenrequiresthateach statetheME couldpotentiallyenterintonexthasanassociatedprobability distribu-tionforhowlongitcouldtaketoenterintothatstate.Todetermine whichstatewillactuallybeenteredintonext,eachofthesepotential timelengthsisrandomlygeneratedaccordingtothesedistributions,and theminimumofthesegeneratedtimesisdefinedtobehowlongitwill actuallytakefortheMEtochangestate(thisistheMEssojourntimein thestate𝑠𝑖𝑗
𝑖(𝑡0)).Sinceeachofthegeneratedtimesisassociatedwith
auniquenextstate,thisminimumalsodetermineswhatthenextstate willbe.5
4Ageneralisation,inthattheprocesshasbothinstantaneousandtime-consuming
so-journsinsystemstates.
5Forourpurposes,inorderforthenextstatetobeuniquelydefined,werequirethat
Fig.3.Usingacompetingrisksalgorithm,anMEtransits,withprobability,fromastate
𝑠𝑖
𝑗𝑖(𝑡0)attimet0tosomeotherstateatsomefuturepointintime.Inthisexample,each
transition’sassociatedprobabilityofoccurrenceisaquotient(suchas𝜆
𝑖 𝑗𝑖(𝑡0)→1
Λ(𝑡0) )oftransition
ratesforexponentialdistributions.
Fig.4.Theevolutionoftheithmodelledentity’sstateintimeisaccomplishedbyapplying thecompetingrisksalgorithmtotheentityatsometimet0,resultingintheMEchanging
statefrom𝑠𝑖
𝑗𝑖(𝑡0)tostate𝑠𝑖𝑗𝑖(𝑡1)attimet1(thatis,theMEremainsinthestate𝑠𝑖𝑗𝑖(𝑡0)fora
time𝑇(𝑠𝑖
𝑗𝑖(𝑡0))=𝑡1−𝑡0),atwhichpointthecompetingrisksalgorithmisappliedagainto
determinethenextstatechange.
Pictorially,anexampleofthisprocessisshowninFig. 3 fortheith MEattimet0.Here,eachofthepotentialtransitionsfromtheinitial state𝑠𝑖
𝑗𝑖(𝑡0)toanotherstateinisrepresentedasanarrowconnecting
apairof states.Intheparticularcasewhereeach transitionstarting attimet0hasanexponentiallydistributedpotentiallengthoftime,as depictedinFig. 3 ,ourmodelbecomesequivalenttoanappropriately definedContinuous-timeMarkovChain[34,35] .Moregenerally,anyclass ofsojourn-timedistributionmaybeusedin PIA,aslongasitcan be efficientlysampledfrom.
So,CompetingRisksdetermineboththenextstatefortheMEand howlongitwilltake(fromtimet0) forthisstatetobeenteredinto.
Thisprocedureisthenrepeatedeachtimethecomponententersintoa newstate,resultingintheMEevolving,overtime,fromstatetostateas depictedinFig. 4 .
minimumvalue.Thislimitationisnotseriousinpractice.Shouldtheneedtoresolveit explicitlyoccurthenextstatecanbechosenatrandomfromthosewhichproducedthe sameshortestsojourntime.
Fig.5.Anetworkofmodelledentitiessubjecttostochasticassociations.ME1isachild
ofME2,itselfachildofME3.Consequently,uponenteringthestate𝑠1𝑗1(𝑡1)attimet1,the
randomvariablethatisthetimeuntilME1experiencesitsnextstatechangeisdefined
byboththestateofME1andthestateofitsparent,ME2,attimet1.Weemphasizethis
dependencebywritingtherandomvariableas𝑇(𝑠1
𝑗1(𝑡1),𝑠 2
𝑗2(𝑡1)).ThedependenceofME2’s
sojourn-timeonME3’sstateissimilarlyillustrated.
ThedynamicalMEmodeloutlinedthusfarcanbeextendedto cap-ture interdependenciesbetween MEs.Intuitively, theevolutionofan ME’sstateatagivenpointintimeisdependentonthecurrentstateof theME,howitgotintothatstate,thecurrentstateofotherMEsand theirrespectiveevolutionaryhistories.Inparticular,adependentME– hereaftercalleda“child” – probabilisticallychangesstateinawaythat dependsonanotherME– hereaftercalleda“parent” .Forbrevity,we shalluse“StochasticAssociation” torefertothetripletofagivenME,the parentsoftheME,andadefinitionofhowtheseparentMEs’ statesand historydeterminetheprobabilisticlaw(i.e.determineamemberofa familyofprobabilitydistributions)thatgovernsthestochasticbehaviour ofthechildME.6Inthisway,eachMEcanpotentiallyhaveseveral
par-entsandseveralchildren,andtheMEsaremadeprobabilistically depen-dentoneachother(so,anMEcanbebothparentandchildofanother ME).Thisallowsonetomodelrathercomplexfailureandrecovery be-haviours,forinstance.AsimpleexampleofanetworkconsistingofMEs withstochasticassociationsdefinedbetweenthemisdepictedinFig. 5 . Inthefigure,theMEs’ statesevolveastimeflowsfromlefttoright.Solid circlesindicatepointsinsimulatedtimewhenstatechangesoccurand, asaconsequence,nextstatesand/ornewsojourn-timesarecomputed asrequiredforsomeMEs.Dashedcirclesindicateasyetunrealised po-tentialstatechange events.So,ME1entersintostate𝑠1
𝑗1(𝑡1)attimet1
and,therefore,anewnextstateandsojourn-time(ofduration𝑡′′′−𝑡 1)
arecomputedforME1atthattime.However,indeterminingthese,the
stateofitsparent,ME2,isused.Thatis,𝑇(𝑠1𝑗1(𝑡1),𝑠
2
𝑗2(𝑡1))– the
sojourn-timeforME1– isafunctionofbothME1andME2’sstatesattimet1.And, whenME3changesstateattimet2it,alongwithitschildME2,requires
newnext-stateandsojourn-timecomputations,resultinginthemodel experiencingitsnextstatechangeeventattimet.Note,however,that
ME1isnotaffectedsinceME2didnotexperienceastatechange,in
ac-cordancewiththestochasticassociationdefinedbetweenME1andME2.
During simulation,thisparticularbehaviourisachievedbyusingthe SANmechanismof“reactivation”[36] .
Thespecificationofacollectionofstochasticassociationsis equiv-alenttodefining,foreachpointinsimulatedtime,ajointprobability distributionovertheModel’sstate-space,wherethisstate-spaceisthe so-calledcartesianproductoftheindividualMEstate-spaces.Withthis inmind,definingstochasticassociationsisquiteconvenientwhen com-paredwiththealternativeofexplicitlydefiningtherelatedjoint distri-bution.FormodelswithasufficientlylargenumberofMEs,theexplicit specificationofsuchajointdistribution– say,asasuitablemarkovchain
– wouldbebothdauntingandtedious,andmayrequireunfeasiblylarge
6Ageneralisationofthiswouldbetodefine,explicitly,stochasticassociationsbetween
[image:8.595.49.278.55.225.2] [image:8.595.312.552.58.170.2] [image:8.595.41.288.289.474.2]state-transitiondiagrams.And,evenifaccomplishedwithouterrors,it islikelythatsuchanexplicitrepresentationwillnotbeusablewhen attemptingtosimulatethemodel:suchamodel,evenofmodestsizein termsofthenumberofmodelledelements,couldhaveastate-spacethat istoolargetofitinanyavailablecomputermemory.7
EachMEsevolutionis,therefore,determinedbymarginalisingthe aforementionedjointdistributions.Ingeneral,differentformsofthese marginalprobabilitydistributionscanbespecified,dependingonwhat issuitableinagivenmodellingsituation.Forinstance,forour experi-ments,MEssuchasfibre-opticcableshadthedistributionoftheirnext statecompletelydefined byconditionallyindependent,exponentially distributedrandomvariables,conditionalonthestatesandhistoryof theMEsparents(inaccordancewiththegeneraldepictionsinFigs. 3 and
5 ).MoredetailonthisisgiveninSection 5 .
ThecollectiveevolutionofallMEsisitselfgovernedbyaCompeting Risksalgorithm.Ateachpointinsimulatedtime,eachMEhasa poten-tialsojourn-timeatwhichitcouldexperienceitsnextstatechange.So, wheneveranMEchangesstate,thetimeatwhichthenextstatechange occursinthemodelisdeterminedbytheminimumofthesepotential sojourn-timesacrossallMEs.Recall,wheneveraparententersintoa newstate,thepotentialsojourn-timebeforetheparentnextexperiences astatechangeiscomputed.Inaddition,thepotentialsojourn-times be-foreeachoftheparent’schildrennextexperiencestatechangesarealso recomputed,inamannerdependentonthenewstateoftheparent.All ofthesesojourn-timesarecomparedwiththesojourn-timesassociated withtheotherMEs,inorder todeterminethetimeof thenextstate changeinthemodel.Forexample,inFig. 5 where,uponME3entering
intostate𝑠3
𝑗3(𝑡2)attime𝑡2,thepotentialsojourn-timesforboththeparent ME3anditschildME2arecomputedandcomparedwiththepotential
sojourn-time(previouslycomputedattime𝑡1)forME1.Theminimum
ofthesesojourn-timesisassociatedwith𝑀𝐸3,implyingthatthenext
statechangewillbeexperiencedbyME3attimet.
ModellingMEsasbeingprobabilisticallydependentmaybejustified byidentifyingfunctionalrelationshipsbetweenthecomponents. Exam-plesof theseabound.Forinstance,inapowertransmissionnetwork, thosecomponentsthatfacilitatethesupervisionandcontrolofpower flowacrossthenetwork(suchasRemoteMeasurementUnitsorIntelligent ElectronicDevices8)relyonICTfortheiroperation:lackofcontrolmay
leadtoanincreasedlikelihoodofthecontrolledcomponentsfailing.Or, inaTelecommunicationsnetwork,thereisarelianceofICTcomponents (suchasroutersandadd-dropmultiplexers)onastablesourceofpower providedbyothercomponents:lossofpowerresultsinthecomponents beinginoperable.
Note,however,thatthemodellingrequirementhereisoneof prob-abilisticdependencebetweentheMEs,andnotnecessarilyoneofan ob-servedcausalrelationship.Thisisconvenientfromamodelling perspec-tive,sinceitisquite possiblethatin practicethere mightnotbe an immediatelyobservablecausallinkbetweencertainrealworldentities, andyetsuchentitiesmaystillbeobservedtoexhibitsomeformof corre-lationbetweentheirstatechanges.While,uponextensiveinvestigation, suchcorrelationmaybe determined asbeingdue tosome common-cause,adeterminationofthiskindisnotneededtojustifymodelling theseentitiesasdependentMEs.
Dependingonthetime-scalesoverwhichtypicaleventsofinterest occurinthemodel,anextremecaseofastochasticassociationwouldbe aninstantaneous(i.e.aparticularformofdeterministic)statechangeof achildMEasaresultofaparentME’sstatechange.Thiscanbemodelled eitherstochastically(withinstantaneoustransitions)orbyusing deter-ministicmodels.Anexampleofthelattermightbeusingapower-flow modelwithMEswhichareelementsofapowergrid.Inthiscase,the
ran-7Forillustration,amodelwitha1000MEs,whereeachMEhasanassociated
state-spacesizeof2,willresultinamodelstate-spacewith21000states– anumberthatiseasily
greaterthan1082whichistheestimatednumberofatomsintheobservableuniverse. 8HereweusetheterminologyestablishedbyIEC61850.
domfailureofsomeMEs,e.g.apowergenerator,maydeterministically leadtoinsufficientsupplyofenergyand,asaresult,toloadshedding, i.e.fromtherandomfailureofanME,thestatechangeofsomelineswill followdeterministically(withadurationthatiseitherinstantaneousor hassomedelay).Anotherexamplefromapowergridmightbethe ran-domfailureofsomepowerline(e.g.duetoelectricalshortinginextreme weather)resultinginanimmediateanddeterministicredistributionof powerflow(accordingtoapower-flowmodel)andtheoverloadingof otherpowerlines.Asaconsequence,theseoverloadedlinesmight be-comedisconnected.Ofcourse,whenthesecomponentschangestate,the probabilitiesofwhenandhowtheirstochasticchildrenwillnext experi-encechangearealteredaswell.Inthisway,thereisacontinual“dance” betweenstochasticanddeterministiceventsinourmodels.
Tofinishthissectionwenote,inpassing,thatanimportantaspectof model-buildingismodelparameterisation;aproblemwhichweaddress inSections 5 ,6.3 andAppendix A .
5. AMulti-infrastructurecasestudy:theRomesystem
ThePIAmethodwasappliedtoacomplexcasestudyofaregional systemoftwocriticalinfrastructuresintheRomearea:thepowergrid andthetelecommunications.PleaseseeAppendix A fordetailsofhow thePIAprocesswasapplied.Thepowergridinfrastructureincludestwo services:thehighvoltagetransmission(150kV)andthemedium volt-agedistribution(20kV),eachwiththeirownnetworks;the telecom-municationinfrastructureincludesthe3serviceswiththeirrespective networks:thefibre-opticsbackbone,thefixedlinesservice/networkand theGSMmobileservice/networkandtheirinterconnection.
Thecase-studywasoriginallydevelopedwithintheEuropean Inte-gratedProjectIRRIIS[40] withthehelpoftheactualnetworkoperators ofthetwomodelledinfrastructures,andthiswasfurtherdevelopedin theUnitedKingdomTechnologyStrategyBoard(TSB)fundedPIA-FARA project[41] .Themodelincludessome829MEs(119inthepower infras-tructureand710inthetelecommunicationsinfrastructure)andclosely representsthetopologyoftherealinfrastructuresintheareaofRome, Italy[40] .DetailsofhowthePIAmethodwasappliedtotheRomecase studyareprovidedintheAppendix A .
EachMEismodelledasbeinginoneoftwopossiblestates–Failedor
Ok– atanygivenpointintime.9AsweindicatedinSection 4 ,a
stochas-ticassociationrequiresthesuitabledefinitionofacollectionofmarginal probabilitydistributionsthatdetermineachildMEsnextstateduring simulation. Inourexperiments,wechosemost oftheMEs totransit fromstatetostateaccordingtoexponentiallydistributedsojourn-times betweenstatechanges.Theratesusedinthecomputationofthesetimes aredeterminedasfollows:suppose𝜆isthefailurerateofanMEwhen allofitsparentsareinanOkstate.If,instead,nparentsareinaFailed
state,thenthefailureratebecomes𝛼n𝜆,where𝛼≥1.Thescalingfactor 𝛼isamodelparameterthatindicatesthe“strength” ofthestochastic de-pendencebetweentheMEs10;varyingthevalueofthisparameterresults
inchangestotheprobabilisticbehaviouroftheMEs,inparticular,and themodelasawhole.Thisideahassomesimilaritiestotheapproach tomodellingdependentcomponentspresentedin[42] .Theuseof𝛼to modelstochasticdependenceinthiswayismerelyoneexampleofthe manykindsofstochasticassociationPIAaffordsus– anexamplethatis, ofcourse,lesschallengingtocalibratethanonewithsignificantlymany moreparameters.WeencourageusersofPIAtocomeupwithstochastic associationssuitablefortheirparticularneeds.
9Thisstatespaceissufficientforourpreliminaryanalysesasthisisthesimplestsetof
MEstatesthatmaybeusedtocapturephenomenasuchascascadingfailureandsystem recovery.
10Variousgeneralisationsofthisconceptarepossible,suchasrequiringpossiblyunique
Fig.6. Thisillustratestheevolutionoftwocascades.Eachcascadehasadurationand sizethatarerandomvariables;onlybyobservingacascadetoitsconclusioncanoneknow whatitssizeanddurationis.Eachoftheserandomvariablescanbeusedtodefine risk-measuresrelatedtocascades:thatis,theydefineprobabilitydistributions(e.g.of cascade-sizeorcascade-duration)associatedwiththecostofacascade’soccurrence.
Theuseof𝛼allowsustointroducenonlinearityinthemodelsof fail-ure(consistentwithobservationsmadeinpreviousstudiese.g.[43] ). Indeed,asmallnumberoffailedmodellingelementsmayleadtoa dra-maticincreaseinthepropensityofmanyotherelementstofail,hence increasingthechancesoflargeoutages.
Thevaluesof𝛼maydifferacrossthe“parent-child” elementpairsin themodel.Elicitingthe𝛼valuesisdifficult;possiblyinfeasible. There-fore,wedealtwiththisproblembysystematicallyapplyingsensitivity analysisundertheassumptionthatthestrengthofdependenceisthe sameforall“parent-child” pairs.Weconducted5simulationcampaigns usingthe𝛼values1,10,100,150,250and500,whichareonlyasample fromtheplausiblerangeof𝛼valuesstudied.Wechosenottoinvestigate themodelbehaviourforvaluesof𝛼outsidethisrangebecause,for val-uesof500andabove,thenumberofsimultaneouscomponentfailures wastoohighand,clearly,unrealistic.
Theparameterisationofthemodel(i.e.boththefailureandrepair rates,aswellasthecharacteristicsofeachME)wasprovidedbythe in-dustrialpartnersintheIRRIISproject[40] :dataonthepowergridwas providedbyengineers fromSiemens,thetelecomdatawas provided byengineersfromTelecomItalia.Whendatawasneededwemade in-formedestimatesandcheckedtheirplausibilitywiththesesubject mat-terexperts.11
Asexplainedearlierinstage6ofSection 3.2 ,inadditiontothe prob-abilisticbehaviouroftheMEs,deterministiceffectsmaybeincludedin themodel.IntheRomestudy,weuseddc-loadflowcomputationsto de-terminetheredistributionofpowerwhencomponentsfailinthepower network.Also,intheeventofanoutageofthemainpowersupply,the Telconetworkusesbackuppowersupplyunits,suchasbatteriesor gen-erators.
ThemodelwasusedtosimulatetheCIsoperatingoveran11year and4monthperiod.12DuringoperationtheMEsthatmakeuptheCIs
experiencedfailuresandrepairs.Toillustratethesortofanalysesthatis possible,wechosetofocusontheoccurrenceoffailurecascades,how longtheselastfor(i.e.theirdurations),andthemaximumnumberof si-multaneouslyfailedMEsinvolved(i.e.theirsizes)asshowninFig. 6 .A
11Examplesofunavailabledatathatrequiredestimatesvalidatedbyexpertjudgement
includethefailureandrepairratesofvariouspowerlinesconnectingtelecommunication nodestosecondarypowersources(dieselgeneratorsandbatteries)
12Thisisadurationequalto100000hours(approximately11yearsand4months).
Fig.7.Thisrisk-measureisthedistributionofcascade-sizesacrossthecombinednetwork consistingofboththePowerCriticalInfrastructureandtheTelecommunicationsCritical Infrastructure.Thevalueofthestochasticdependencescalingfactoris𝛼=1.
differentfocusmerelyrequiresthedefinitionofsomeotherrisk-measure ofone’schoosing.Thefigureillustratestwocascadesseparatedbya pe-riodofnormaloperationofallMEs.N(t)isthenumberofsimultaneously failedcomponentsattimet.Acascadeisdefinedasanycontinuous pe-riodoftimeforwhichatleastoneMEisinafailedstate.13Twomeasures
of interestrelatedtocascades arecascade-size andcascade-duration, bothdepictedhere.Thecascade-sizeisthemaximumnumberof simul-taneouslyfailedMEsduringacascade(e.g. thesizesofthedepicted cascadesareN(t1)andN(t3))whilethecascade-durationisthelength
oftimeforwhichacascadeoccurs(e.g.thedurationsofthedepicted cascadesare𝑡2−𝑡1and𝑡4−𝑡3).
6. Results:illustrativeinsightsfromthecase-study
UsingthePIAtoolkitdescribedin Section 1 above andthestages detailedinAppendix A ,theRomescenariomodelwasdevelopedand usedtoexploresystemicrisks14ofcascades.
6.1. Networkresilience
Typically,powernetworksareoperatedwiththeresilience require-mentthattheyshouldtoleratesinglefaults15[44,45] .Weobservethis
behaviourwiththemodelledpowernetwork(seeFig. 7 ),withmostof theobservedfailuresinthenetworkbeingsingle,isolatedfailuresthat donotresultincascades.Therisk-measureusedhereisthedistribution ofcascade-sizes.
ThereappearstobeacriticalnumberofMEs(approximately36) be-yondwhichalmostallcascadesizesarespectacular– thecollapseofthe entirepowernetwork.Thispropertyofthemodelisaconsequenceof boththeleveloffunctionalredundancyinthemodelandthemodel pa-rameterisation,bothchosenbytheIRRIISconsortium[40] tosimulate thepowernetworkoperatingatclosetoitsoperationalcapacity. How-ever,thismodelbehaviourisconsistentwiththefindingsof[46] who reportanonlinearrelationshipbetweenhowmuchofthetransmission
13Whilethisdefinitionofcascadedoesincludetrivialcases,suchasthefailureand
recoveryofasingleME,itsrealusefulnessliesinthefactthatitalsoencompassesso manyinterestingdynamicsequencesofthefailureandrecoveryofgroupsofMEs.For instance,acascadecanconsistofasequencethatbeginswith5MEfailures,followedby 4recoveries(so,atthispoint,only1componentis“failed”),followedby1newfailure, followedby…andsoon,tilltherearenofailedMEs.Thisdefinitionalsohastheadvantage thatitappearstobereadilyapplicabletodescribing“cascading” phenomenabothwithin andacrossverydifferentCI,partlybecauseitdoesnotrelyoncausalitytoexplainthese failureandrecoverysequences.Ofcourse,wherePIAisconcerned,thisismerelyone
choiceofrisk-measure–anymoresuitablerisk-measureshouldbeusedwhenrequired.
14Bythis,wemeantheriskimposedbyinterdependenciesinasystem,wherethefailure
ofasingleentityoragroupofentitiescancausecascadingfailure.
[image:10.595.58.272.57.252.2] [image:10.595.309.555.61.215.2]lines’ capacityisusedandtheresultantdistributionofcascadesizein theirmodel:whentransmissionnetworksutiliseabove80%ofthelines’ capacity,theriskoflargecascadesissignificantlygreaterthanwhen lessthan80%isused.
Note,fromthedistributionofcascade-sizesassociatedwith𝛼=1in
Fig. 7 ,thatwhiletheprobabilityofspectacularcascades(e.g. approx-imately10−2forcascadesofsize119)issignificantlysmallerthanthe
probabilityofsinglefailures(approximately0.95)itis,however,ofthe sameorderofmagnitudeastheprobabilityofsignificantlysmaller cas-cades(e.g.cascadesofsize10).Thishintsatthepossibilitythatthe fail-ureofonlyafewMEsissufficientforspectacularcascades;behaviour thatisevidencedbythecircumstancesunderwhichspectacular black-outshaveoccurredinpractice[47] .
Maintaininganetworkatadesirablelevelofresilienceofteninvolves decisionsabouthowbesttoallocatefiniteresources.Itseemsreasonable thatsomerankingoftheMEsinorderofimportancemightbeauseful firststep16inmakingsuchadecision.Usingappropriaterisk-measures,
thereareanumberofalternativeapproachestosucharanking.For in-stance,shouldcomponentsberankedaccordingtotheirreliabilityor, instead,shouldtheyrankedaccordingtohowlikelytheyaretobe in-volvedinalargecascade?And,arealternativerankingsrelatedinsome identifiableway?Perhapsthereisasenseinwhichsomemeasuresare indicativeofothermeasures,butaresignificantlyeasiertocompute.We chosetostudythefollowingthreemeasures,eachcapturingadifferent senseof“neighbourhood” or“locality”:
1) Component(un)availability:theunavailabilityofeachME,which fo-cusesonthebehaviourofindividualMEsalone,
2) Componentconnectivity:thenumberofimmediateneighboursanME hasand,inthissense,isslightlylesslocalthanMEunavailability, and
3) Cascademembership:theprobability thatanME iscontainedin a cascadeofatleastsize17117,arelativelyglobalmeasurethatcan
takeintoaccountMEslocatedacrosstheentirenetwork.
Werankthecomponentsaccordingtotheir associatedvalues for thechosenmeasures.Sucharankinggivesanotionofcriticality:from sucharankingwecanidentifywhichMEsarethemostimportantand deservingofourattention.
TheresultsofourinvestigationareshowninFig. 8 .Thisconsistsof 3plots– oneforeachcriticalitytype.TheMEsareassigneduniqueIDs (all829ofthem)and,foreachnotionofcriticality,theMEsareranked accordingtotheircomputedcriticalities.UsingtheseIDs,wedepictthe MEscriticalityrankings,whereeachMEhasthreeassociatedcriticality valuesplotted– oneineachoftherespectiveplots.TheuniqueIDsofthe MEsareshownoneachhorizontalaxis,witheachverticalaxisshowing thepossiblecriticalityvalues.ThemostcriticalMEshavethehighest criticalityvalues.
Weseesignificantdisagreementbetweenthesethreenotionsof crit-icality,withsomeMEsbeingimportantintermsofbeingverylikelyto beinvolvedinlargecascades,butunimportantinthattheyhave rela-tivelysmalldowntime– thatis,theyarenoticeablymoreavailable– thanmanyotherMEs.
Thisobservationseemsimportantasitemphasiseshowtheranking cansignificantlydependuponthechosenrisk-measure.Ourown expe-riencewithcriticalinfrastructureanalysissuggeststhatresearchersand practitionersoftenuseagivenrisk-measuretoidentifycriticalnodes withoutdemonstratinganawarenessthattherankingobtainedthereby coulddependsignificantlyonthechosenmeasure.Asaresult,inmany ofthesecases,theselectionofasuitablemeasureappearstobeamatter
16Furtherinvestigationmayberequired.Forinstance,givenastatisticalidentification
ofasubsetofMEsasbeingcriticalandworthyofattention,furtherinvestigationmight revealimportantcausalrelationshipsbetweentheseMEs,suggestingthatlimitedresources canbetargetedtoanevensmallersubsetoftheseMEs.
17Inparticular,forwhenthepowernetworkwasoperatingclosetoitsoperationallimits,
117isthesizeofthelargestcascadeconsistingofpowernetworkcomponentsalone.
[image:11.595.307.558.57.360.2]Fig.8.Acomparisonofthreenotionsofcriticality(with𝛼=1).Eachcriticalitynotion resultsinarankingofthe829modelledcomponents.Manyofthecomponentsineach plotsharethesamecriticalityvalue,18 resultinginawidevertical“gap”,ineachplot, withinwhichnocomponentsassumeanycriticalityvalues.Thesizeandlocationofthis “gap” differsacrossthecriticalitynotions.
ofconvenience,lackinginproperjustificationforitsuseotherthan“this measurehasbeenusedelsewhere” .Here,weshowthatthechoiceof measuredoesmatter.Byexploringalternativemeasures,anassessorcan gainanappreciationofhowtherankingchangesand,thereby,choose thosemeasureswhicharejudgedtobestcapturetheobjectivessought viasuitablerankings.Forinstance,itseemsquiteclearthatinvestingto improvecomponents’ individualavailability(see“component unavail-ability” inFig. 8 )isnotnecessarilyawiseinvestment,iftheactualeffect soughtisresilienceimprovementoftheentirecriticalinfrastructure.
6.2. Theimpactofmodelfidelityonmodelledrisk
Westudiedhowchangingamodel’slevelofdetailand sophistica-tionaffectstheriskofcascadesoccurringinthemodelbycomparing twoscenarios:onewithrelativelydetailedpowerand telecommunica-tionnetworkmodels(referredtoasthefullmodel),andanotherinwhich thefidelityofthetelecommunicationnetworkwasunchangedbutonly thosepower networkMEs whichweredirectlyphysically coupledto telecommunicationMEsweremodelled(referredtoasapartialmodel). Inbothscenariosavalueof𝛼=1wasused.Weibulldistributionswere usedasthefailuredistributionsforeachpowernetworkMEinthe par-tialmodel,theparametersofwhichwereobtainedbyfirstestimatingthe marginalfailuredistributionsfortherespectiveMEsinthefullmodel, andthenfittingthesedistributionstoWeibulldistributions.A compari-sonofthecascade-sizedistributionsforthetelecommunicationnetwork inbothexperimentsisshowninFig. 9 .
In particular,the partialmodel lacks correlatedfailureof power networkMEs;aproperty whichexistsinthefullmodelasaresultof
18Forexample,theMEshavethesamenumberofneighboursorareinvolvedinthe
Fig.9. Acomparisonofthedistributionofcascade-sizesintheTelecommunications Net-workundertwolevelsofabstraction:1)whenthetelecommunicationsnetworkiscoupled withadetailedmodelofthepowernetwork(fullmodel),and2)whenonlyasimplemodel ofthepowernetworkisusedwitheverythingelseremainingthesame(partialmodel). Thevalueofthescalingfactorforbothmodelsis𝛼=1.
overloadingpowerlines.Thatis,thepartialmodelhasindependently failingpowerMEs.Thismeansthatgeographicallyseparated telecom-munication sites experiencepower blackouts independently. We ob-servedthatthecascade-sizedistributioninthepartialmodel underesti-matestheprobabilityoflargecascades,withnocascadesgreaterthan size11occurring.19So,detailsabouthowcascadesariseinthepower
networkareclearlyimportantforriskestimationintheTelconetwork. Thisresulthighlightsachallengeforanyinterdependencyanalysisthat seekstoestimateriskinagivenCIwithoutsufficientlycharacterisingthe jointuncertaintyintheservicedeliveredatthecouplingpoints.Insuch cases,aprioritymustbethedevelopmentandapplicationofstatistical techniquesforinferringsuchuncertaintyfromlimited(coupling-point) observationaldata.
6.3. Stochasticdependencestrength
Thestrengthofstochasticdependence,𝛼,isausefulmodellingdevice forintroducingnonlinearityinsystembehaviour.Here,wegivedetails ofthesensitivityanalysisweconducted– studyingthebehaviourofthe modeloverplausiblerangesof𝛼values,usingdifferentmeasures.So far,thereportedresultsofouranalyseswereallbasedonexperiments whichset𝛼=1.Here,weshowhowvaryingthevalueof𝛼affectsthree risk-measuresofinterestinthefullmodel:
1. Thedistributionofcascadesize; 2. Thedistributionofcascadeduration;
3. Thedistributionofthe“loss” duetocascade.Forourpurposes,we definethe“loss” duetoacascadeastheproductofthecascadesize andcascadeduration.
It turns out that the model changes resulting from varying the stochasticstrengthshowdifferentpatternsastheparameter𝛼takes dif-ferentvalues.
Changesin𝛼resultinchangesinthedistributionofcascadesize(as definedearlierinFig. 6 ),butonlyoveraverysmallrangeof probabil-ities(seeFig. 10 ):theonlydifferencesoccurabovethe95percentile foreachofthedistributions.Thisisbecauseineachexperimentthe fre-quencyofsinglecomponentfailures(about100,000)issomuchlarger thanthefrequencyofthelargercascadesfoundinthetailofthecascade sizedistribution.
19Thisisbecausethefullmodel,takingintoaccountboththeTelcoandPowerMEs,
ex-hibitsapowerlawtrendforitscascade-sizedistribution,𝑃(Cascadesize=𝑥)≈𝑥−2.3,with
largercascadesbeingmorefrequentthanispredictedbytheexponentiallydistributed cascadesinthepartialmodel.
Fig.10. Cascade-sizedistributionsfor𝛼values1,10,150and500.Theupper95%of eachdistributionisdepictedabove,andtheentiredistributionsaredepictedbelow.
UponexaminingFig. 10 inthissmallrangeofprobabilitieswesee thatastochasticordering20existsbetweentherespectivedistributions
for𝛼=500and,say,𝛼=1.Thereisnoordering,however,betweenthe
𝛼=150and𝛼=250distributions(“250″isnotincludedintheplot). And,infact,withintherangeof𝛼-valuesfrom1to150,theobserved distributionsofcascadesizeareverysimilar.So,somewhereintherange of𝛼-values[150,500]thereisanoticeableglobal21changeinthemodel
behaviour.
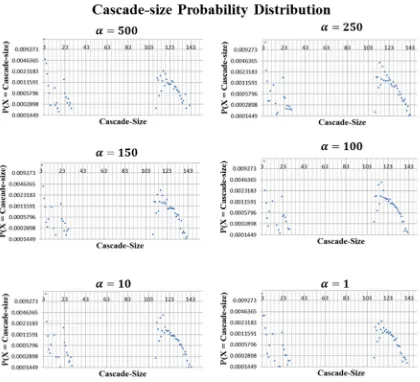
Inaddition,thedifferentcascadesizeprobabilitymassfunctions(pmf) resultingfromdifferent𝛼valuesallpossessthesamegeneralshape,as showninFig. 11 .Depictedare6differentcascadesizepmfsresulting fromexperimentsconductedusing6differentvaluesof𝛼;thereislittle differencebetweenthem.FortheRomestudy,thissimilarityisa conse-quenceoftheinterplaybetweenthefollowingtwotypesofcoupling:
1. Functionalcouplingvianetworktopology:duetothefunctional couplingsbetweenthemodellednetworks,itonlytakesafew partic-ularMEstofailforacascadeofagivensizetooccur. Telecommunica-tioncentresinthemodelprovideexamplesoffunctionalcoupling. EachsuchcentrecontainsmultipletelecommunicationMEs(suchas Add-dropmultiplexers),andalloftheseMEsrelyonthesame pri-maryandsecondarypowersources.Thatis,viaasinglepower net-workME(suchasamediumvoltagepowercable)thepowernetwork providespowertoagiventelecommunicationcentre,andwhenthe powernetworkfailsabackupgeneratorsuppliespowertothe cen-treforsome50hoursonaverage.22Consequently,wheneverboth
20Inthisrange,onedistributionliesaboveanother. 21Thatis,overtheentireprobabilitydistribution.
22Consequently,inourmodel,thefailureofaPowernetworkMEthatisacoupling
[image:12.595.307.558.58.358.2] [image:12.595.39.289.58.211.2]Fig.11. Cascade-sizeprobabilitymassfunctionsfor𝛼values1,10,100,150,250and500.
ofthesepowersourcesareunavailablealloftheMEsattheaffected telecommunicationscentrebecomeinoperable.
2. Stochasticassociation:Therelationshipbetweenastochasticchild anditsparentsissuchthatthevalueof𝛼– thestrengthofthe stochas-ticdependence– onlybeginstotakeeffectafteratleastoneofthe parentshasexperiencedfailure.Prior tosuchaninitial failure,if therearenoMEsanywhereinthemodelinafailedstate,the exper-imentshaveidenticalstochasticbehaviourregardlessof𝛼’svalue.
Consequently,formostoftheexperimentsreportedhere(apartfrom the𝛼=500),therelativefrequencywithwhichacouplingpointthatis apowerMEfails, followedbythefailureofabackup generatorand alloftherelianttelecommunicationMEsatagivencentre, isalmost unchangedbyvarying𝛼.
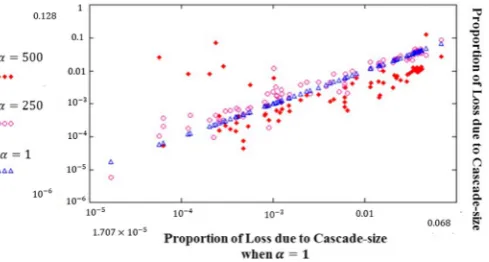
ComparethiswithFig. 12 whichdepictscascadeduration distribu-tions.Thereisalinearportionofthegraphindicatingexponential distri-butionsofcascadedurations.Wesee,however,thatthetailsofsomeof thedistributionsdeviatefromthis(theprobabilityoflongdurationsare greaterthanwhatwouldbeexpectedunderanexponentialprobability law),beginningatsomevalueof𝛼greaterthan150andlessthan250. Similartothedurationdistributions,nonlinearityalsooccursinthe tailsof“loss” distributions(seeFig. 13 ),howeverthesearenow notice-ableatsome𝛼valuegreaterthan250andlessthan500.
Analternativewayofseeingthisnonlinearityinthe“loss” distribu-tionisbycomparingtheproportionoflossduetoeachcascadesizein eachoftheexperiments.Foragivenvalueof𝛼theproportionofloss duetoacascadeofsizekiscomputedasfollows.LetL(i)betheloss
associatedwithcascadei.Then,theproportionis
∑
𝑖∈
⎧ ⎪ ⎨ ⎪ ⎩
𝑐𝑎𝑠𝑐𝑎𝑑𝑒𝑠𝑜𝑓 𝑠𝑖𝑧𝑒𝑘
⎫ ⎪ ⎬ ⎪ ⎭
𝐿(𝑖)
∑
𝑗∈{𝑎𝑙𝑙𝑐𝑎𝑠𝑐𝑎𝑑𝑒𝑠}𝐿(𝑗)
.
Theseproportionstakevaluesintheunitinterval[0,1]andare plot-tedinFig. 14 .Thehorizontalaxisdepictstheproportionsforcascade sizesinthe𝛼=1experimentwhiletheverticalaxisdepictsthe propor-tionsforcascadesizesinthe𝛼=1,250and500experiments.Thatis, eachdatapointisapairofproportionsrelatedtothesamecascadesize, atleastoneofwhichistheproportionfromthe𝛼=1experiment.Note thatthecascadesizerelatedtoeachpointisnotexplicitlyshowninthe figure.Intheplot,theproportionsfromthe𝛼=1experimentare repre-sentedastrianglesonthediagonalline.Datapointsthatdonotfallon thisdiagonal(theunitslope)lineindicatedeviationsbetweenthe𝛼=1
experimentandtheotherexperiments.
[image:13.595.90.510.54.436.2]Fig.12. Cascade-durationdistributionsresultingfrom𝛼values1,10,100,150,250and500.
Fig.13. Distributionsof“Loss” duetocascadesunderdifferentvaluesof𝛼,wherethe“Loss” duetoacascadeisdefinedascascadesize×cascadeduration.
Fig.14. Theproportionoflossduetoacascadeofagivensizecandifferwithdifferent valuesof𝛼.
reached.And,theresultsofthissectionhighlighthowchangesin𝛼over certainrangesleadtonoticeablechangeforsome risk-measures,but notothers(comparethecascade-size,cascade-durationandcascade-loss distributions).Therangeof𝛼valueswehaveinvestigatedsuggestthat preciselywhich𝛼valuestriggernoticeablechangescanvaryfrom mea-suretomeasure.Anoteofcautionisinorder,therefore:itisprudent thatadiversecollectionof risk-measuresbeusedwhenapplyingPIA (asinanyrisk-modellingofsufficientcomplexity),studyingmodel be-haviouroverarangeofplausibleparametervalues,tofullyunderstand thepropertiesandlimitationsoftheresultingmodels.
7. Discussion
Thispaperdemonstrates,onarealisticexample,anapproachtothe evaluationofsystemicrisk andthesignificanceof interdependencies betweencriticalinfrastructures.
Thispaperpresentsasystematicmethodofbuilding, viaan itera-tiveprocessofmodelrefinement,modelstosupporttheanalysisofCI
resilience.Themethodallowsonetooperateatdifferentlevelsof ab-straction, rangingfrompurelyprobabilisticstudy,atoneextreme,to high-fidelityanalysisusinganumberofdeterministicmodelswhich cap-ture,explicitly,the“physics” oftheunderlyingCIs,attheotherextreme. In-betweentheseextremesliesamultitudeofhybridmodelswithboth stochasticanddeterministicphenomena.Onceahybridmodelof inter-dependentCIshasbeendeveloped,suitablerisk-measurescanbedefined tostudythesystempropertiesofinterest(suchassystemresilience). Whilethesemeasuresaredependentonthelevelofdetailusedinthe model(e.g.thecomponentrelatedrisk-measures,suchasthoseinFig. 8 , cannotbeusedunlessthemodelisdefinedatthecomponentlevel),the measures,themselves,donothavetobepartofthemodeldefinition.In fact,manyoftherisk-measuressummarizedinthispaperweredefined
after thesimulationswerecompleted,andcomputed usingthetraces ofthesystemstaterecordedduringthesimulations.Thisallowedusto runthesimulationcampaignsonlyonce,andsubsequentlyusethetraces tocomputedifferentrisk-measuresofinterestwhenevertheneedfora newoneoccurred.Thiswasimportantasthelengthofsimulationcan besignificant,sometimesrequiringanumberofdaystoobtainsufficient statisticalconfidenceintheresults.
WedemonstratethePIAmethodintheappendixandnotethatthe methodwasalsosuccessfullyappliedtobuildamodelofanothersystem ofsimilarcomplexity,inwhichthefocuswasonmodellingtheresilience ofpowersystemsagainstcyber-attacks[31,32] .Thisisanexampleof modelling, indetail,theeffectof anadverseenvironmenton critical infrastructure.
[image:14.595.137.460.60.188.2] [image:14.595.141.455.215.345.2] [image:14.595.45.290.382.513.2]