City, University of London Institutional Repository
Citation
:
Agrawal, A. and Cabrera-Espana, F. (2016). Hut-like pillar array Si Solar Cells. Solar Energy, 132, pp. 357-362. doi: 10.1016/j.solener.2016.03.026This is the accepted version of the paper.
This version of the publication may differ from the final published
version.
Permanent repository link:
http://openaccess.city.ac.uk/13962/Link to published version
:
http://dx.doi.org/10.1016/j.solener.2016.03.026Copyright and reuse:
City Research Online aims to make research
outputs of City, University of London available to a wider audience.
Copyright and Moral Rights remain with the author(s) and/or copyright
holders. URLs from City Research Online may be freely distributed and
linked to.
Hut-like pillar array Si Solar Cells
Francisco J. Cabrera-España and Arti Agrawal*
School of Mathematics, Computer Science and Engineering, City University London, Northampton Square, London, EC1V 0HB, United Kingdom
Abstract
A good texturing pattern for solar cells needs to combine low Reflectance over a large wavelength range and low surface recombination to maximise the output. Nanowire and pyramid patterns offer low Reflectance in the longer and shorter wavelength regions respectively. This paper introduces an exciting new “hut” like texturing pattern with excellent performance, improving that of nanowires and pyramids; over the long and short wavelength ranges respectively. Furthermore, we analyse the effect of different structural parameters such as height, diameter, Surface Coverage (SC) and ϑ, on the solar cell performance.
2015 Elsevier Ltd. All rights reserved
Keywords:Photovoltaic; Texturing; Silicon; Optical properties.
*
Corresponding author: [email protected] 1. Introduction
The incident light reflected at an interface between two media with different refractive indices has been studied for various applications (Flowers, 1975). Some examples of these applications are: Fabry-Perot lasers (Hodgson and Weber, 2003), Bragg gratings (Hill and Meltz, 1997), optical couplers (Biswas, 2003) and solar cells (Luque and Hegedus, 2011; Hamakawa, 2010), etc. In particular, solar cells have drawn a lot of their attention due to environmental benefits (Luque and Hegedus, 2011). Some of the techniques that scientists have developed to reduce the Reflectance from the solar cell surface are: deposition of anti-reflection coatings (Yan et al., 2013), exploiting plasmonic properties (Spinelli et al., 2012), texturing of various patterns on the solar cell surface (Baker-Finch and McIntosh, 2011; Mavrokefalos, 2012), etc.
These techniques attempt to improve the transmission at the air-silicon interface by different means. In the case of anti reflection coating technique, the transmission can improve up to 8% (Yan et al., 2013). However, it requires a very precise layer deposition. In addition, the frequency dependant nature of refractive indices makes it less attractive to developers (Yan et al., 2013). In the case of plasmonics, the transmission can increase up to 9%. The operation at the resonance frequency of the metal enables the re-emission of incident light into the substrate (Spinelli et al., 2012). However, the large solar spectrum is not efficiently utilized due to the very narrow bandwidth of the plasmonic behaviour (Spinelli et al., 2012).
2010; Kim et al., 2013; Sinton et al., 1996) is caused by certain factors. One factor is the refractive index averaging between the air and the cell material. A second factor is the light trapping by multiple reflections of the incoming light (Mavrokefalos et al., 2012; Garnett and Yang, 2010; Madaria et al., 2012; Shin et al., 2012; Logeeswaran et al., 2010).
A common issue between texturing patterns is the high level of surface recombination due to a high surface recombination velocity enhanced by defects. In combination with the dominance of the surface effects due to the high surface-to-volume ratio (Dan et al., 2011; Chang et al., 1993). This may worsen the electrical performance of the solar cell regardless how good the optical performance is (Dan et al., 2011; Green, 1982; Toor et al., 2011; Li et al., 2011; Shir et al., 2010). Furthermore, high levels of surface recombination can lead to a short life span for the material. A way to reduce it is called “surface passivation” (Dan et al., 2011). It consists on oxidizing the Silicon at high temperatures which reduces the carrier lifetime (Schmidt et al., 2001). Furthermore, surface passivation is challenging to achieve due to the high precision required at this small dimension (Dan et al., 2011). This shows the importance of finding ways to reduce Reflectance with low surface-to-volume ratio.
In the case of the “hut” like structure, it is possible to optimize light trapping further than other patterns. This is due to strong E field intensity near the substrate in-between pillars. In addition, the light trapped in-between the huts, by multiple reflections, is incident on the hut at angles that improve absorption. Furthermore, it shows good optical performance for small dimensions which is an advantage regarding surface recombination. In the following sections, we discuss in detail the effect of structural parameters of this “hut” like pattern. In section 2 we discuss the structure of the “hut” like pattern and the methodology, section 3 compares the performance of the hut-like and other available patterns, section 4 analyses in detail the effect on the performance of surface coverage, , overlapped pattern, height, cap and we identify an appropriate set of parameters and our conclusions are presented in section 5.
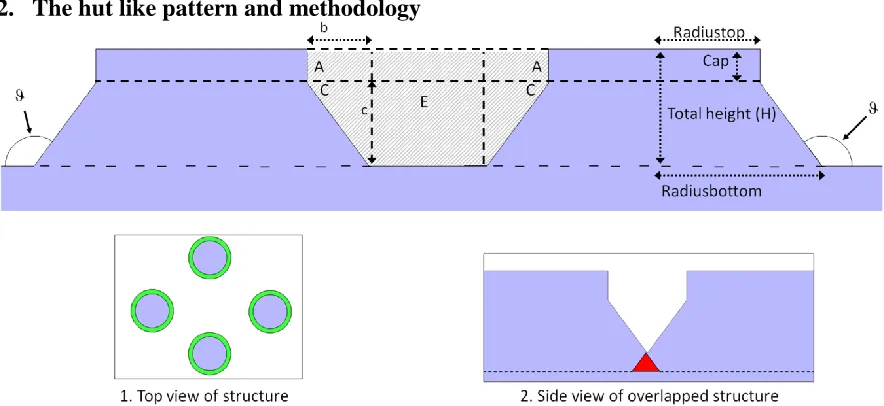
[image:3.612.87.529.489.692.2]2. The hut like pattern and methodology
A schematic diagram of the “hut” like pattern is presented in Fig.1. The purpose of this pattern is to enhance light trapping in-between huts by multiple reflections. This is achieved by an optimization of the air volume between the huts. This is a similar concept to other patterns such as nanowires or micro pillars. Further benefits of the hut like pattern are discussed in later sections.
Inset 1 in Fig. 1 has a top view of the pattern where we can see the hexagonal configuration of the pattern. The inner circle (i.e. purple) corresponds to the vertical section of the pillar and outer circle (i.e. green) corresponds to the sloped part of the huts. This sloped part is important for improved light trapping of the pattern enabling higher absorption of the incident light as well as improved trapping due to multiple reflections. We will discuss this in more detail in section 4.1.
There are some critical factors to be considered: Surface Coverage (SC), the angle , Cap and the area between the huts (see Fig. 1). The SC is defined as follows:
2
2 radiustop 100 SC
simulation window
(1)
where radiustop is the radius corresponding to the top of the hut. The simulation window is the finite area of solar cell being simulated (we apply Periodic Boundary Conditions (PCB) in the x and y directions). Furthermore, the angle (in degrees ()) is calculated as follows:
1 H 180 tan radiusbottom radiustop
(2)
where total height is the length measured from the substrate to the top of the hut and
radiusbottom is the radius corresponding to the bottom of the hut. The area in-between huts can be easily calculated as the sum of the areas A, C and E which are shaded in Fig. 1:
ACap b (3)
C 1 2 c b (4)
Edistance between huts H (5)
Area2A 2C E E 2 A C (6) Substituting Eq. 3, 4 and 5 into Eq. 6 we obtain the following expression:
1 Area distance between huts H 2 b Cap c
2
(7)
By rearranging the equation it is also possible to express the area in-between huts in terms
of H, Cap, , SC, radiustop and radiusbottom as follows:
2 2
H Cap 3 2 radiustop 100
Area H 1 12 radiusbottom
H SC tan 180 (8)
source launches a plane wave with the 1.5 AM solar spectrum. Above the source we record any reflected waves from the pattern. Throughout the paper we use the Reflectance
integrated over all wavelengths to compare performances for different parametric set up. Reflectance is defined as:
AM1.5
AM1.5
AM1.5 I
AM1.5 I
T I d
R
I d
(9)where R, T, IAM1.5 andare the Reflectance, the transmission air-silicon interface, the reference solar spectrum and the wavelength respectively. In the next section we compare the performance of the hut-like with the performance of other patterns.
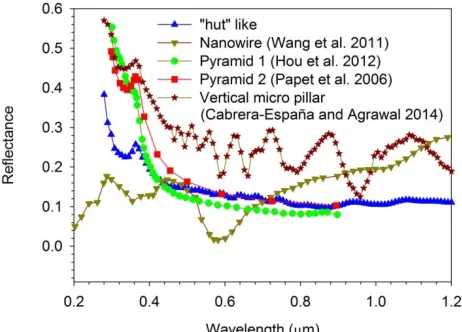
3. Comparison with other patterns
The hut-like texturing pattern offers the possibility of an optical performance with a low R. This attractive benefit is complemented by dimensions offering a low surface
[image:5.612.190.421.346.512.2]recombination. In Fig. 2 we compare the R of the optimized hut-like pattern with that of some other available texturing patterns such as: vertical micro pillars (Cabrera-Espana et al., 2014), nanowires (Wang et al., 2011) and pyramids (Hou et al., 2012; Papet et al., 2006).
Fig. 2. Performance comparison of hut-like structure with other texturing patterns.
From this figure we can see the wavelength dependent performance of the hut-like pattern. Low R is achieved by maximizing the effect of the multiple reflections as well as
The excellent performance of the pattern compared to the others proves the potential of this structure to lower R. In the next section we introduce and analyse the effect on the R of different structural parameters.
4. Results
In this section we discuss in detail the effect of different parameters on R beginning with the effect of the area in-between huts.
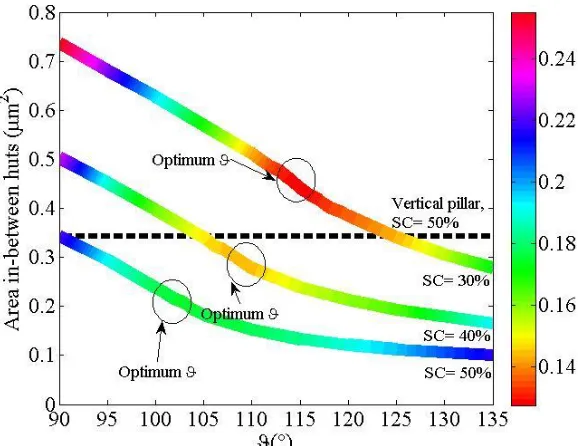
4.1Effect of area in-between huts on Reflectance, SC and
Light trapping takes place in the area in-between huts hence an appropriate choice of SC and ϑ is important for the best performance. An intuitive way of varying this area is to change the distance between huts (i.e. SC). This is in line with our findings on vertical micro pillar arrays (Cabrera-Espana et al., 2014) where we have discussed in detail the impact of varying SC.
The hut-like pattern offers an alternative way to vary the area in-between huts: by changing
(see Fig. 1). As we increase from vertical micro pillar (i.e. =90), keeping the rest of the parameters constant, we change the area in-between huts and also the angle of incidence of light on the sloped part. As a consequence, R changes. In addition, the Fresnel reflection at low angle of incidence is high and as the angle of incidence increases, it reaches a
[image:6.612.158.447.403.626.2]minimum. Further increase in the angle of incidence will lead R to increase. Therefore there is a range of optimizing the absorption on the slope part of the huts.
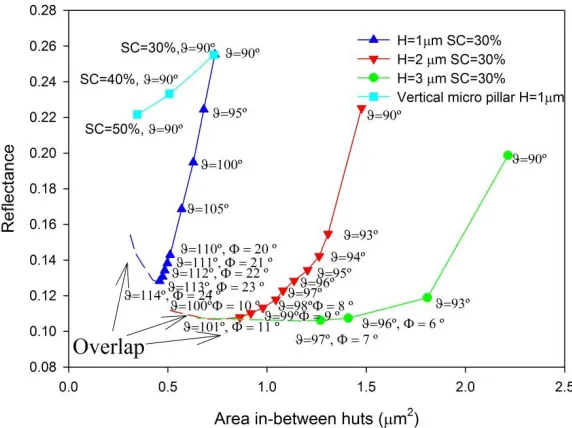
Fig. 3. Angular performance, Area in-between the huts vs for H= 1 µm, Radiustop = 0.5 µm and Cap= 0.2 µm where the line colour represents the R.
Consequently, we need to take into account both ways of changing the area (i.e. varying SC and ). Figure 3 shows the R dependence (see colour bar) with variation of the area
respectively and have indicated the optimum for each. For reference we have included a dashed line for vertical micro pillars (=90) with H=1µm and SC=50%.
There is a similar trend in all three cases: area in-between huts effectively determines the light concentration. For any given SC, when increases from 90, first there is a decrease in R. This is identified by the colour of the lines changing towards green (SC= 50%), yellow (SC=40%) and red (SC=30%), reaching a minimum at optimum .
[image:7.612.118.494.303.435.2]Further increase in , leads to an increase in R, identified by the change in colour towards blue (SC=50%), green (SC=40%) and yellow (SC=30%) end of the spectrum. This increase is consequence of overlap in the pattern (inset 2, Fig. 1): there is an effective decrease in H. Furthermore, this decrease is dependent on . As we vary ϑ, there is a change in the area in-between huts. This change affects the amount of light penetrating in the area in-in-between huts as well as the multiple reflections. Therefore, we conclude that there is a range of optimizing both the absorption and multiple reflections in-between huts; enhancing absorption further.
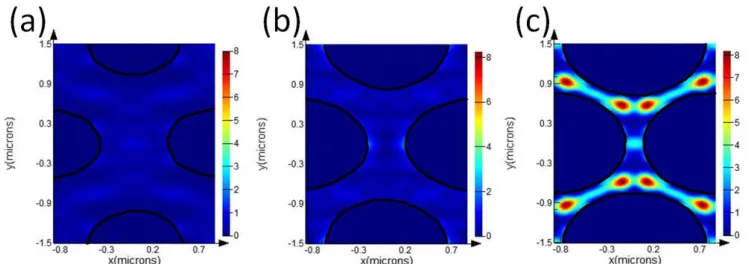
Fig. 4. Cross section showing E field intensity at 0.2 m above the substrate for structure with H= 1 m, Cap = 0.2 m and SC = 30 % at 0.373 m for (a): =90. (b): =105. (c): =115.
In Figs. 4 a, b and c we show the E field intensity at 0.2 m above the substrate for different values of (=90, =115and =105) for constant SC=30%. The black lines indicate the edge of the hut circumference. There is a clear increase in the E field intensity when ϑ increases from 90 to optimum (ϑ= 115) due to the optimization of absorption at the slope and the multiple reflections simultaneously. As a consequence, we can see a higher E field intensity near the substrate for the optimum . These results clearly indicate the value of moving from vertical pillar to the hut-like structure. However, the trend of reducing R, as we reduce H when the pattern is overlapped seems to collapse. In the following section we explain the impact of H on R in detail.
4.2Effect of Height on Reflectance
Nevertheless, increasing H to very large values would not provide a significant benefit. This is due to the impact of the height softening as H increases. For example, from Fig. 5 we can see that the difference in R between H= 2 and 3 µm is smaller than the difference between H= 1 and 2 µm. Furthermore, patterns with large H may suffer high levels of surface recombination.
Fig. 5. Variation in R as the area in-between huts changes, for different H.
Another parameter related to H is the Cap which we discuss in the following section.
4.3Effect of Cap on the Reflectance
Fig. 6. Reflectance vs ϑ at SC=30 % varying Cap size for H=1 m.
[image:8.612.173.435.463.661.2]As we increase Cap, while keeping constant, there is an increase in R. This is because the hut has a bigger vertical component and more of the incoming light hits this portion at larger angle of incidence, leading to an increase in R. Therefore, in order to have a good performance a lower value of Cap is better.
We have shown the impact of each of the strucutural parameters on R. The number of paramenters is large and there is a complex inter-play between them. Therefore, it can be difficult to appreciate how best to choose an optimal set of , H, Cap and SC values. We present in the next section a study on optimum set of parameters.
4.4Identifying an optimum set of parameters
Figure 7 displays R as a function of , SC and Cap. We record the value giving the lowest R for different SC and H values. Then, we plot it against its corresponding R value. The different symbols and colours stand for different H and SC respectively.
[image:9.612.163.446.431.634.2]It is possible to see from Fig. 7 the optimum value of reducing as SC increases. Further to this, for all SC the difference in the optimum between different heights reduces as H increases. This is in line with our discussion in section 4.2. Moreover, for any given height, the optimum reduces as SC increases. This is in line with our discussion on section 4.1. A useful insight, for fabrication, is the flexibility of the pattern to achieve optimisation for a given H and Cap. It can be achieved by finding the optimum for a specific SC that can be fabricated or by finding the optimum SC for a given that can be etched.
Fig. 7. Reflectance vs Optimum ϑ for different values of H and SC with Cap = 0.2 m.
5. Conclusions
We have investigated a new hut-like texturing pattern with excellent Reflectance
wavelength ranges respectively. The biggest advantage of hut-like is more efficient light trapping. Furthermore, it enables patterns with low SC to have an excellent performance when is optimized. It offers the possibility of low surface recombination.
References
Baker-Finch, S., McIntosh, K., 2011. Reflection of normally incident light from silicon solar cells with pyramidal texture, Prog. Photovoltaics 19, 406–416.
Biswas, A., 2003. Theory of optical couplers,” Opt. Quant. Electron. 35, 221-235. Cabrera-Espana, F. J., Rahman, B. M. A., and Agrawal, A., 2014. Study of optical
properties of textured Si solar cell with micro pillars, In Proceedings of Optical wave and waveguide theory and numerical modeling workshop (OWTNM, 2014), pp. 13.
Chang, Y-L., Tan, I-H., Mirin, R., and Zhang, Y-H., 1993. Excitation energy dependence of luminescence intensity from the near-surface quantum well, In Proceedings of the Institute of Physics conference series, 129, pp. 281.
Dan, Y., Seo, K., Takei, K., Meza, J. H., Javey, A., and Crozier, K. B., 2011. Dramatic Reduction of Surface Recombination by in Situ Surface Passivation of Silicon Nanowires, Nano Lett. 11, 2527-2532.
Flowers, G., 1975. Introduction to Modern Optics, Rinehart and Winston, Inc., New York. Garnett, E., Yang, E., 2010. Light trapping in silicon nanowire solar cells, Nano Lett. 10,
1082-1087.
Green, M. A., 1982. Solar cells: operating principles, technology, and system applications, Prentice-Hall, Englewood Cliffs, New Jersey.
Hamakawa, Y., 2010. Eds. Thin-Film Solar Cell Next Generation Photovoltaics and its Applications, Springer, New York.
Hill, K. O., Meltz, G., 1997. Fiber bragg grating technology fundamentals and overview, J. Lightwave Technol. 15, 1263-1276.
Hodgson, N., Weber, H., 2003. Laser Resonators and Beam Propagation Fundamentals, Advanced and Applications, Springer, Washington.
Hou, Y., Abrams, B. L., Vesborg, P. C. K., Bjorketunm, M. E., Herbst, K., Bech, L., Seger, B., Pedersen, T., Hansen, O., Rossmeisl, J., Dahl, S., Norskov, J. K., Chorkendorff, I., 2012. Photoelectrocatalysis and electrocatalysis on silicon electrodes decorated with cubane-like clusters, J. of Photonics for Energy, 2, 026001.
Kim, H., Kim, J., Lee, E., Kim, D-W., Yun, J-H., Yin, J., 2013. Effect of the short collection length in silicon microscal wire solar cells, Appl. Phys. Lett. 102, 193904.
Li, H., Chen, R. J. C., Xing, X., Ding, W., Meng, Y., Wu, D., Liu, X., Ye, T., 2011.
Influence of nanowires length on performance of crystalline silicon solar cell, Appl. Phys. Lett. 98, 151116.
Logeeswaran, V., Katzenmeyer, A. M., Islam, M. S., 2010. Harvesting and transferring vertical pillar arrays of single-crystal semiconductor devices to arbitrary substrates, IEEE Trans. Electron Devices 57, 1856-1864.
Luque, A., Hegedus, S., 2011. Handbook of Photovoltaic Science and Engineering, John Wiley & Sons, Ltd., Chichester.
Madaria, A., Yao, M., Chi, C., Huang, N., Lin, C., Li, R., Povinelli, M. L., Dapkus, P. D., Zhou, C., 2012. Toward optimized light utilization in nanowire arrays using scalable nanosphere lithography and selected area growth, Nano Lett. 12, 2839-2845.
Mavrokefalos, A., Han, S. E., Yerci, S., Branham, M. S., Chen, G., 2012. Efficient light trapping in inverted Nanopyramid thin Crystalline silicon membranes for solar cell applications, Nano Lett. 12, 2792-2796.
Papet, P., Nichiporuk, O., Kaminski, A., Rozier, Y., Kraiem, J., Lelievre, J. F., Chaumartin, A., Fave, A., Lemiti, M., 2006. Pyramidal texturing of silicon solar cell with TMAH chemical anisotropic etching, Solar Energy Materials and Solar Cells, 90, 2319-2338.
Schmidt, J., Kerr, M., Cuevas, A., 2001. Surface passivation of silicon solar cells using plasma-enhanced chemical-vapour-deposited SiN films and thin termal
SiO2/plasma SiN stacks, Semicond. Sci. Technol. 16, 164-170.
Shin, J., Chanda, D., Chern, W., Yu, K. J., Rogers, J. A., Li, X., 2012. Experimental study of design parameters in silicon micropillar array solar cells produced by soft lithography and metal-assisted chemical etching, IEEE J. Photovolt. 2, 129-133. Shir, D., Yoon, J., Chanda, D., Ryu, J., Rogers, J., 2010. Performance of Ultrathin Silicon
Microcells with Nanostructures of Relief Formed by Soft Imprint Lithography for Board Band Absorption Enhancement, Nano Lett. 10, 3041-3046.
Sinton, R. A., Cuevas, A., Stuckings, M., 1996. Quasi-steady-state photoconductance, a new method for solar cell material and device characterisatio, In Proceedings of the 25th IEEE photovoltaic specialists conference (PVSC, 1996), pp. 457-460.
Spinelli, P., Ferry, V. E., Van de Groep, J., Van Lare, M., Verschuuren, M. A., Atwater, H. A., Polman, A.,2012. Plasmonic light trapping in thin-film Si solar cells, J. Opt. 14, 024002 (2012).
Toor, F., Branz, H. M., Page, M. R., Jones, K. M., Yuan, H-C., 2011. Multi-scale surface texture to improve blue response of nanoporous black silicon solar cells, Appl. Phys. Lett. 99, 103501.
Wang, J., Li, Z., Singh, N., Lee, S., 2011. Highly-ordered vertical Si nanowire/nanowall decorated solar cells, Opt. Express 19, 23078-23084.
Yan, X., Poxson, D. X., Cho, J., Welser, R. E., Sood, A. K., Kim, J. K., Schubert, E. F., 2013. Enhanced omnidirectional photovoltaic performance of solar cells using multiple-discrete-layer tailored-and low-refractive index anti-reflection coatings, Adv. Funct. Mater. 23, 583-590.
Yee, K., 1966. Numerical solution of initial boundary value problems involving Maxwell's equations in isotropic media, IEEE Trans. Antennas Propag. 14, 302-307.
Figure captions
Fig. 1. Schematic of proposed hut-like micro pillar array.
Fig. 2. Performance comparison of hut-like structure with other texturing patterns. Fig. 3. Angular performance, Area in-between the huts vs for H= 1 µm, Radiustop = 0.5 µm and Cap= 0.2 µm where the line colour represents the R.
Fig. 4. Cross section showing E field intensity at 0.2 m above the substrate for structure with H= 1 m, Cap = 0.2 m and SC = 30 % at 0.373 m for (a): =90. (b): =105. (c): =115.
Fig. 5. Variation in R as the area in-between huts changes, for different H. Fig. 6. Reflectance vs ϑ at SC=30 % varying Cap size for H=1 m.