Rochester Institute of Technology
RIT Scholar Works
Theses Thesis/Dissertation Collections
11-2017
A Power Efficient Server-to-Server Wireless Data
Center Network Architecture Using 60 GHz Links
Sree Gowrishankar Umamaheswaran
[email protected]Follow this and additional works at:https://scholarworks.rit.edu/theses
This Thesis is brought to you for free and open access by the Thesis/Dissertation Collections at RIT Scholar Works. It has been accepted for inclusion in Theses by an authorized administrator of RIT Scholar Works. For more information, please [email protected].
Recommended Citation
A Power Efficient Server-to-Server Wireless Data Center Network
Architecture Using 60 GHz Links
by
Sree Gowrishankar Umamaheswaran
A Thesis Submitted in Partial Fulfillment of the Requirements for the Degree of Master of Science in Computer Engineering
Supervised by
Dr. Amlan Ganguly
Department of Computer Engineering Kate Gleason College of Engineering
Rochester Institute of Technology Rochester, NY
November 2017
Approved By:
_____________________________________________________________________________
Dr. Amlan Ganguly
Primary Advisor – R.I.T. Dept. of Computer Engineering
_____________________________________________________________________________
Dr. Andres Kwasinski
Secondary Advisor – R.I.T. Dept. of Computer Engineering
_____________________________________________________________________________
Dr. Mineosk Kwon
ii
Acknowledgements
I would like to acknowledge my thesis advisor, Dr. Amlan Ganguly for guiding me
throughout my thesis. I would like to extend my gratitude to Dr. Andres kwasinski
and Dr. Mineosk kwon for serving on my thesis committee and providing their
iii
Abstract
Data Centers have become the digital backbone of the modern society with the
ad-vent of cloud computing, social networking, Big data analytics etc. They play a
vital role in processing the large amount of information generated. The number
of Data Centers and the servers present in them has been on the rise over the last
decade which has eventually led to the increase in the power consumption of the
Data Center due to the power-hungry interconnect fabric which consists of switches
and routers. The Significant portion of the power consumption is due to the
power-hungry switching fabric necessary for communication in the datacenter.
Addition-ally, the complex cabling in traditional datacenters pose design and maintenance
challenges and increase the energy cost of the cooling infrastructure by obstructing
the flow of chilled air. In this work, we address these problems of traditional
dat-acenters by designing a unique new server-to-server wireless datacenter network
(DCN) architecture.
The proposed design methodology uses 60GHz unlicensed millimeter-wave bands
to establish direct communication links between servers in a DCN without the need
for a conventional fabric. This will reduce the power consumption of the DCN
sig-nificantly and increase the in-dependency of servers from switching fabric.
In our work, the previous traffic models of a data center network are studied and
a new traffic model very similar to the actual traffic in data center is modeled and
used for simulating the DCN environment. We first demonstrate that such a
iv
data rates that are comparable to traditional DCNs. Having established the
feasibil-ity of a server-to-server wireless DCN in terms of performance, we estimate that its
power consumption is lowered by six to eighteen times in comparison to a
conven-tional DCN fabric. We have also compared the efficiency, performance, scalability
of our DCN architecture with some of the other practically used architectures like
v
Contents
Acknowledgements ii
Abstract iii
1 Introduction 1
1.1 Thesis Contributions . . . 3
1.2 Thesis Layout . . . 4
2 Background & Related work 5 2.1 Motivation . . . 5
2.1.1 Power Consumption . . . 6
2.1.2 Cabling Complexity . . . 6
2.1.3 Traffic Congestion . . . 8
2.2 Related Work . . . 9
2.2.1 Data Center Networks . . . 9
Fat-Tree . . . 10
Dcell . . . 10
Bcube . . . 11
2.2.2 Wireless Data Centers . . . 11
2.2.3 The 60 GHz band . . . 12
vi
IEEE 802.11ay Standard . . . 14
2.2.5 Channel Characteristics . . . 14
2.2.6 Antenna Characteristics . . . 16
2.2.7 Spatial Reuse . . . 17
2.2.8 Significance . . . 18
3 Traffic Modeling 19 3.1 General Characteristics . . . 19
3.2 Flow Transmission Rate . . . 20
3.3 Duration . . . 21
3.4 Traffic Size . . . 22
3.5 Significance . . . 23
4 Server-to-Server Wireless Data Center Network (S2S-WiDCN) Design 25 4.1 Architecture . . . 25
4.1.1 Topology . . . 26
Horizontal Plane Communication . . . 28
Vertical Plane communication. . . 29
4.1.2 Antenna Technology . . . 30
4.1.3 Establishment of Wireless Links . . . 31
4.2 Routing Protocol . . . 33
4.2.1 Server ID . . . 33
4.2.2 Inter and Intra Rack Communication . . . 34
Horizontal Plane Inter Rack Communication . . . 35
Vertical Plane Inter Rack Communication . . . 36
4.3 Power Consumption . . . 38
vii
4.4 Simulation Platform . . . 42
4.5 Performance Analysis . . . 43
4.5.1 Traffic Flow Completion Duration . . . 44
4.5.2 Throughput . . . 45
4.6 Conclusions . . . 46
viii
List of Figures
2.1 Cabling Complexity. . . 7
2.2 60 GHz . . . 13
3.1 Transmission Rate in small data center . . . 20
3.2 Transmission Rate in large data center . . . 21
3.3 Flow Duration in small data center . . . 22
3.4 Flow Duration in large data center . . . 23
3.5 Flow Size in small data center . . . 24
3.6 Flow Size in large data center . . . 24
4.1 Server picture . . . 26
4.2 DC Layout . . . 27
4.3 HP Communication . . . 28
4.4 VP Communication . . . 29
4.5 Algorithm Flowchart . . . 32
4.6 Intra Rack . . . 34
4.7 HP-Inter Rack . . . 35
4.8 VP-Inter Rack . . . 36
4.9 Two hop-Inter Rack . . . 37
4.10 Power Consumption comparison . . . 42
ix
List of Tables
4.1 Power Consumption of different DCN components . . . 39
4.2 Packet latency in different devices . . . 46
x
List of Abbreviations
DCN Data Center Network
RF Radio Frequency
ToR Top of Rack
LoS Line of Sight
MAC Medium Access Control
UHF Ultra-High Frequencies
OFDM Orthogonal Frequency Division Multiplexing
SC Single Channel
NS-3 Network Simulator 3
BER Bit Error Rate
TCP Transmission Control Protocol
xi
1
Chapter 1
Introduction
Datacenters play a vital role in modern day as they provide processing power and
storage required by billions of connected devices. One of the major challenges is,
however, the enormous power consumption of datacenters. A census conducted by
Natural Resources Defense Council (NRDC) shows that the energy consumption by
datacenters reached 91 billion kWh energy in 2013, and will increase to 140 billion
kWh by 2020 [1]. As the number of servers within a datacenter grows, the role of
the interconnection infrastructure becomes paramount in terms of both energy or
power efficiency and performance. Traditionally, datacenter networks (DCNs) are
interconnected in tree-based topologies using wired links and multiple hierarchical
levels of aggregation. These tree-based networks and other recent alternative
tech-nologies exhibit inherent limitations in scalability and oversubscription as they rely
on copper and optical cable-based links [2].
The DCN consumes a significant portion of the total power consumption of a
dat-acenter. The proportion of IT power dissipated by the network equipment varies
between 10-50% depending upon server utilization [3]. The wired or cabled
net-work technologies require power-hungry switches and create large bundles of
Chapter 1. Introduction 2
flow of chilled air for cooling [4]. Inefficient cooling only exacerbates the energy
efficiency problems that plague the current datacenters. These problems are
of-ten worse in small and mid-size datacenters with hundred to a few thousands of
individual servers in educational institutions and private enterprises as these are
designed and deployed in an ad-hoc manner often leading to structural and
func-tional heterogeneity making regular systematic design impossible. To address these
common design issues faced by wired or cabled datacenters wireless datacenter
ar-chitectures are being investigated as a promising alternative. The capability of the
unlicensed 60GHz wireless band to deliver very high communication rates has led
to the development and approval of the IEEE 802.11ad wireless local area network
(WLAN) standard [5]. Therefore, recently proposed designs leverage newly
devel-oped technologies in the unlicensed 60GHz wireless band for wireless DCNs [6] [7].
Advancements in the 60GHz technologies enable the transceivers to consume low
power, some even in the milliwatt range [8] [9], and establish multi-gigabit
com-munication channels [10]. Directional horn antennas [11] as well as more recently
developed phased arrays of antennas in the 60GHz bands [12] can provide high
directional gains and beam steering capability between wireless transceivers.
Us-ing such antennas, the 60GHz channels can exhibit spatial re-usability, allowUs-ing
multiple concurrent links reusing frequency bands to be formed within the same
datacenter. The low power consumption combined with the ability to form
concur-rent multi-gigabit channels makes these transceivers ideal for use in power-efficient
wireless DCNs.
In this article, we propose a server-to-server wireless DCN (S2S-WiDCN)
Chapter 1. Introduction 3
mid-size datacenter running typical query-response type of applications like
map-reduce and index lookup. Through direct server-to-server wireless links using
direc-tional antenna arrays, we propose to eliminate the power-hungry switching fabric
of traditional DCNs, resulting in significant power savings in data transfer. The
communication between servers in the wireless DCN are achieved along
horizon-tal lines and vertical planes as shown in Fig. 1. We compare the performance as
well as power savings of the proposed server-to-server wireless DCN to that of
con-ventional hierarchical DCNs. In this way, we demonstrate that the S2S-WiDCN is
able to sustain and provide performance comparable to the conventional
counter-part at significantly lower power consumption. To the best of our knowledge, this
is the first attempt to measure the network-level characteristics of a server-to-server
wireless DCN.
1.1
Thesis Contributions
In this work we propose a new wireless datacenter architecture. The performance
of the proposed datacenter architecture is evaluated with that of the traditional
wired datacenter architectures like Fat-tree, Dcell, Bcube. Conventional DCNs are
arranged in a tree based topology, bringing about significant congestion and
over-subscription along wired links as the number of aggregation levels increase. Several
solutions have emerged in an attempt to limit the amount of resources used to
con-struct large DCNs, including server centric wired approaches like Dcell, Bcube and
wireless ToR-ToR architecture with the use of 60 GHz links.
Many contemporary works studying wireless data centers using 60 GHz links have
Chapter 1. Introduction 4
approach. This proposed work attempts to replace a data center’s wired links
en-tirely in order to maximize the energy savings obtained using wireless technology,
while maintaining or improving the bandwidth provided by these links in
compar-ison to a wired network. In addition to the evaluation of an entirely wireless data
center, this work will improve upon existing 60 GHz medium access control (MAC)
mechanisms to further the wireless data center approach. A primary objective of
this proposed work is to demonstrate that a completely wireless data center has the
capability to satisfy bandwidth demands of a typical data center while yielding
sig-nificant energy savings. Furthermore, this work will provide a foundation for future
wireless data center investigations using 60 GHz links.
1.2
Thesis Layout
In this research work, first the related work are discussed in detail followed by the
explanation on how the traffic is modeled. The proposed wireless architecture is
introduced with the routing protocol pertaining to it. Then the power consumption
of the proposed is investigated and presented. Finally, the performance is evaluated
with respect to throughput, completion duration and in future work’s section other
5
Chapter 2
Background & Related work
This section will begin with the motivation for this work and will address the
cen-tral problems afflicting modern data center designs. Mainly, we will discuss about
different wired data center architectures likes Dcell, Bcube, Fat-tree. All background
and related work will then be introduced and discussed. This section will conclude
with the significance this work provides.
2.1
Motivation
Research concerning data center design and efficiency has become more prevalent in
both industry and academia due to the increasing reliance on data centers to
man-age complex services. With the advent of cloud computing, data center resources
are scaling rapidly and will require new and innovative solutions to meet that
de-mand. Several factors however, limit the scalability and efficiency of modern data
centers and have proved challenging to overcome. Some of the most prominent
is-sues needing solution are the increasing power consumption, cabling complexity
and traffic handling in data centers. These are discussed in detail to provide a clear
Chapter 2. Background & Related work 6
2.1.1
Power Consumption
The amount of power consumption by data center are in the rise ever since the
ad-vent of cloud computing. data centers consume an enormous amount of electricity
for their operation. When considered as a whole, they make up a significant portion
of overall worldwide electricity usage[13].
Furthermore, authors in [13] indicate that networking equipment already accounts
for around 15% of a data centers infrastructure energy budget. This percentage is
expected to increase in the future and is projected to grow by up to 50% in the
com-ing years. Due to the fact that servers and coolcom-ing equipment represent the majority
of a data centers electricity usage, they have received more research and attention
[13]. While new technologies make cooling equipment and servers more energy
efficient within a data center, the networking infrastructure must receive attention
to prevent its energy consumption from growing unchecked. The energy efficiency
problems associated with data centers are reinforced by a recent change in focus
from the initial capital costs of setting up a new data center, to the cost in
electric-ity of maintaining new data centers. The growth in data center infrastructure has
driven down the cost of the initial equipment, however the cost of electricity recurs
and adds up over time. The cost of powering a data center can quickly surpass the
initial data centers total equipment cost.
2.1.2
Cabling Complexity
A major portion of power consumption in data center is used for cooling the data
center facility. Due to the working of IT equipment heat is produced which gets
Chapter 2. Background & Related work 7
flow in data center is obstructed by complex cabling. Inefficient cooling, resulting
from networking and cabling complexities, only exacerbates energy efficiency
prob-lems [14]. While structured cabling and raised floor techniques mitigate the cabling
complexity challenge, these cables still result in airflow blockage which leads to
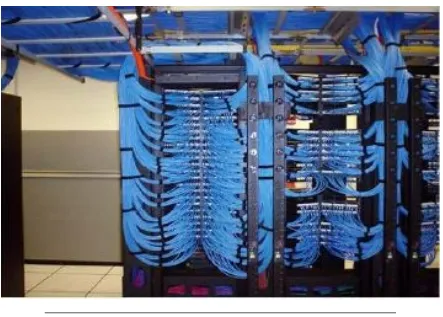
in-efficient cooling [15]. The large bundles of cables and the complexity of cabling can
be seen in Figure 2.1. Even with structured cabling approaches, these wires hinder
FIGURE2.1: Cabling Complexity
the ability of chilled air to move around the data center. These cabling overheads
result in airflow blockages, additional maintenance costs, and can cost a great deal
as a data center scales out. The physical cables within a data center represent a
sig-nificant portion of the initial data center infrastructure costs. Thus improvements in
[image:19.595.87.530.257.574.2]Chapter 2. Background & Related work 8
2.1.3
Traffic Congestion
This is the most predominant problem till date. As the servers are aggregated up the
level for interconnection, traffic congestion becomes unavoidable. IT equipments
such as switches and routers thus come in play. Not to mention, these switches and
routers are the power hungry equipments in IT infrastructure.
It is estimated that roughly 70% of data center traffic will flow within a data
cen-ter between servers, placing a large demand on the structure of a data cencen-ter’s
internal network [16]. As the number of servers scales up into the thousands, it
becomes impractical and costly to provide full link bandwidth from all servers to
every other server. This gives to the rise of importance in data center architecture.
There have traditional topologies like Fat-tree, Dcell, Bcube with wired
intercon-nections, switches and routers that either consumes or reason for consumption of
large amount of power in data center. Two popular networks known as Fat-Tree
and Three-Tier are shown below.
When links become aggregated, the amount of bandwidth on upstream links is
of-ten less than the bandwidth of the downstream links. This difference in bandwidth
leads to a concept known as oversubscription. Oversubscription is defined as the
ratio of maximal aggregate bandwidth among end hosts in the worst case to the
total bisection bandwidth [17]. Oversubscription saves network resources at the
ex-pense of possible contention for access to those network resources. As the amount
of oversubscription increases, the impact to performance is an undesirable
conse-quence and poses a potential problem if left unaddressed. Thus addressing the
traf-fic congestion with sustain our primary aim of reducing power consumption is a
challenging task to solve on. Our work is basically tries to solve this challenge in
Chapter 2. Background & Related work 9
2.2
Related Work
2.2.1
Data Center Networks
The design of data center architecture plays a vital role in interconnection between
servers. Most of the architectures aim to have at least one possible way of traffic
flow between any two servers in a data center.The main challenging in
architec-tures is how independent a server is to connect with any other server in the data
center. The lesser the intermediate hops or connecting equipments the more
in-dependent the network is. Many approaches have been proposed to address data
center design issues such as energy consumption, cabling complexity, scalability,
and oversubscription. The authors in [2] classify data center networking
architec-tures into four categories, electronic switching technologies, all optical switching,
hybrid (optical and electronic switching), and wireless data center technologies. Let
us discuss about Fat-Tree, Dcell, Bcube architectures in detail in this section and
compare the efficiency with proposed S2S-WiDCN architecture in the next chapter.
Each of these research categories seeks to improve the underlying networking
ar-chitecture to solve various network challenges outlined in [2]. The wireless network
approaches in [11] and [18] keep the switching advantages offered by wired
net-works and employ wireless technologies on top of existing wired approaches. This
provides several solutions to unbalanced bursty traffic and oversubscription issues,
however these approaches still maintain a large energy consumption due to the
un-derlying wired network. Addressing the energy consumption of wireless DCNs is
necessary to allow these networks to compete with emerging alternative network
Chapter 2. Background & Related work 10
Fat-Tree
Hierarchical DCNs are a fat-tree based architecture popularly adopted in the
indus-try. Its three hierarchical layers consist of 160 access, 2 aggregate, and 2 core layer
switches similar to the architecture evaluated in [22]. In the architecture, each
tra-ditional DCN link from servers to access layer switches has a channel capacity of
1.0Gbps. The links between access layer to aggregate layer are assumed to have a
capacity of 1.0Gbps and those between aggregate layer and core layers are
consid-ered to be 10.0Gbps.
Dcell
DCell [21][17] is a type of recursive datacenter network topology. The most basic
element, which is called DCell0, consists of n servers and one n-port switch. Each
server in a DCell0 is connected to the switch in the same DCell0. The number of
servers in DCell grows double-exponentially, and the number of levels in DCell is
limited by the number of NICs on the servers in it. The next level of DCell is DCell1
which is constructed with n+1 DCell0s where n is the number of servers in DCell0.
As a result, the DCell0s are connected to each other, with exactly one link between
every pair of DCell0s. Following the same trend, the upper levels of DCells are
constructed. For constructing the small-scale DCN network, we constructed a DCell
with n=5 and k=2, which can support up to 930 servers. Here, k is number of levels
for DCell. So, it is sufficient for supporting the required 800 servers. For the medium
scale datacenter, DCell with n=6 and k=2 was constructed which can support up to
1806 servers. We used 1600 servers among these. All links are assumed to have a
Chapter 2. Background & Related work 11
Bcube
BCube [14][16] is also a recursive topology specially designed for shipping container
based modular datacenters. The most basic element of a BCube is BCube0. In this,
n servers are connected to one n-port switch. The main difference between BCube
and DCell is how they scale up. BCube makes use of more switches when
con-structing higher-level architecture. When concon-structing a BCube1, n extra switches
are used, connecting to exactly one server in each BCube0. Therefore, a BCube1
con-tains n BCube0s and n extra switches. There are total 2n switches in a BCube1. We
constructed the BCube network with n=10 and k=2 for small-scale DCN and n=12
and k=2 for medium scale DCN. Here, k is number of levels for BCube. Just like
the DCell, the number of levels in a BCube depends on the number of ports on the
servers. The number of servers in BCube grows exponentially with the levels, much
slower than DCell. In the DCell and BCube network designs, the servers not only
serve as end nodes but also act as relay nodes and take part in traffic forwarding
through multiple parallel short paths. All links are assumed to have a capacity of
1.0Gbps.
2.2.2
Wireless Data Centers
Wireless data centers concepts have emerged from advancements in wireless
tech-nologies. Wireless frequencies at 60 GHz are capable of providing high data rates
over distances of up to 10 meters. Highly directional antennas such as horned
an-tennas or phased array anan-tennas are used to establish wireless links only in one
particular direction. These directional antennas enable spatial reusability due to
fa-vorable 60 GHz characteristics, however Line-of-Sight (LoS) communication is
Chapter 2. Background & Related work 12
and cooling equipment all represent obstacles that could increase channel losses and
prevent links from being established. Several works have addressed these issues
us-ing 3D beamformus-ing techniques to reflect 60 GHz signals off of metallic mirrors or
through repeaters to achieve reliable communication [20] [18] [22]. The feasibility of
establishing wireless 60 GHz links has been studied extensively, however using this
technology within a data center environment remains an active area of study.
2.2.3
The 60 GHz band
A part of Millimeter band from 57 GHz to 64 GHz referred to as the 60 GHz band
in the United States. This Millimeter band constitutes all frequencies between 30
GHz and 300 GHz. This range of frequencies is known as the millimeter wave
band due to the fact that the wavelengths for these frequencies are between roughly
1 mm to 10 mm in length. The 60 GHz portion of the frequency spectrum was
made unlicensed by the Federal Communications Commission (FCC) in an attempt
to stimulate growth and innovation in order to facilitate the commercialization of 60
GHz technologies [23]. This same portion of the frequency spectrum has been made
available worldwide, with small differences in the starting and ending frequencies
between various communications regulatory bodies. For example, in Europe the
European Telecommunications Standards Institute (ETSI) has made the frequencies
from 57 GHz to 66 GHz unlicensed. Due to the global acceptance in making the
60 GHz band open for unlicensed use, this frequency band has received much
re-search and attention. Figure 2.2 depicts the various allocations of the 60 GHz band
in different geographic regions.
A common range of bandwidth centers on the spectrum mask at the 60.48 GHz
Chapter 2. Background & Related work 13
FIGURE2.2: 60 GHz Frequency Allocation by region
within a data center environment due the large amount of bandwidth available and
also because of advantageous channel characteristics. The high carrier frequencies
at 60 GHz allows for transceivers to achieve multi-gigabit data rates. Moreover, the
limited interference at 60 GHz and potential for spatial reuse makes 60 GHz
tech-nologies ideal for use within a wireless data center.
2.2.4
60 GHz Standards
The standards for Wireless Communication are emerging day to day to meet the
data rate required. Standards such as WirelessHD [24], IEEE 802.15.3c [25], and
ECMA 387 [26], are designed for short ranged wireless personal area networking
Chapter 2. Background & Related work 14
multimedia scenarios. The WirelessHD standard for example, was designed for
high definition video streaming in consumer products. Wireless local area
network-ing (WLAN) standards addressnetwork-ing 60 GHz frequencies include the IEEE 802.11ad
standard first published in 2012 and the WiGig standard first published in 2010.
These standards address 60 GHz communications over larger distances and provide
the natural evolution of Wi-Fi into the 60 GHz spectrum.
IEEE 802.11ay Standard
One of the most recent developments is the emergence of IEEE 802.11ay standard
which has a larger bandwidth and data rates compared to the adopted 60GHz band.
It is proposed to suffice about 20-40 Gbps for the larger range of upto 500m. The
pro-posed architecture along with 802.11ay standard will prove very efficient or even
better than the current wired or optical or both topologies combined. We have
dis-cussed in detail about this standard in the future work section.
2.2.5
Channel Characteristics
Modeling of 60 GHz frequencies is vital to the development of an accurate wireless
data center design. In order to effectively model 60 GHz wireless links, the
char-acteristics of the wireless channel must first be established. Wireless frequencies in
lower frequency bands such as the ultra-high frequency (UHF) band (300MHz to
3 GHz) are able to propagate for miles and can penetrate solid obstacles without
significant loss. This is due to the relatively large wavelength these frequencies
ex-hibit. 60 GHz frequencies however, are operating at millimeter wavelengths, which
limits both the distance they can propagate and the materials they can propagate
Chapter 2. Background & Related work 15
of only a few millimeters will effectively block the propagation of a 60 GHz wave,
restricting wireless communication to LoS connections only. For reliable 60 GHz
communication to take place, a receiver antenna must receive a signal above a
min-imum receiver sensitivity level to accurately demodulate the wireless signal. This
relationship can be expressed through the following equation.
Received Power=Transmit Power + Gains - Losses
Where transmit power is the power that the transmitter module produces, gains
represents the directionality and efficiency of the antenna, and losses represent any
deterioration of the signal as it propagates from the transmitter to the receiver. This
transmission power is dictated by FCC regulations, limiting the maximum average
power level of 60 GHz signals to 40 dBmi [27]. The antenna gain is dependent on
the type of antenna used, such as an omni-directional antenna, a horn antenna, or
a phased antenna array. The last aspect of the equation is the losses incurred
dur-ing the transmission. By understanddur-ing and mitigatdur-ing the cause of loss in 60 GHz
communications, better data rates can ultimately be achieved. Several factors
con-tribute towards the propagation loss of 60 GHz signals and must be accounted for
in order to obtain an accurate representation of the communication channel. 60 GHz
signals operating at high data rates are around 55 dB worse than 2.4 GHz wireless
links in terms of the signal to noise ratio (SNR) of the channel [11]. This difference
can be attributed to two main factors, including free space path loss and the size of
the channel. Free space path loss is the main form of loss 60 GHz frequencies face in
LoS communication channels. The free space path loss can be expressed in terms of
frequency and the distance between any two isotropic antennas shown in Equation
2.1.
Chapter 2. Background & Related work 16
Where R is the distance between the transmitter and receiver antennas and lambda
is the wavelength of the operating frequency. When converting to units of frequency
and expressing Equation 1 in terms of dB it becomes:
F(FSL,dB) =92.4+20log(f) +20log(R) (2.2)
This free space path loss becomes significant at high frequencies and accounts for
the majority of loss in millimeter wave bands such as the 60 GHz RF band. In
ad-dition to the attenuation due to free space, 60 GHz signals also face transmission
losses through air due to atmospheric conditions. The 60 GHz frequency coincides
with an absorption peak of oxygen, meaning molecules of O2 absorb 60 GHz
fre-quencies. This absorption characteristic of oxygen along with absorption due to
water vapor in the air results the attenuation of RF signals. This attenuation results
in shorter propagation distances, however it also reduces the interference at other
transceivers caused by 60 GHz signals. While path loss accounts for the majority
of loss in the transmission of 60 GHz frequencies, the size of 60 GHz channels are
roughly 100 times wider than 2.4 GHz channels. This creates a channel that is over
20 dB noisier at high data rates [28]. Additional sources of loss such as multi-path
effects are largely mitigated through the use of highly directional antennas [29]. The
directionality of the antennas greatly reduces indoor multi-path signal variations.
2.2.6
Antenna Characteristics
The antenna technology used in a 60 GHz transmission dictates the radiation pattern
the signal produces. Omni-directional antennas propagate in all directions evenly,
Chapter 2. Background & Related work 17
which is vital to avoid interference. Directional antennas can be created by using
a “antenna array” to direct the propagation of the waveform in one direction
elec-tronically steered using phased array techniques. These radiation patterns are
typi-cally measured in decibels isotropic (dBi), where the forward gain of the directional
antenna is compared with a hypothetical isotropic antenna. The antenna array has
a very less latency for directionality with comparison to that of the physical
direc-tional antennas like horn antenna.
2.2.7
Spatial Reuse
The most important characteristics of our proposed architecture is the spatial reuse
of 60 GHz signals. Since these signals are generated using highly directional
anten-nas, multiple transceivers can operate on the same frequency at same time within
proximities greater than 24 inches [11]. Spatial reuse isn’t possible with wireless
communications in lower frequency ranges for the reason that their signals don’t
at-tenuate in free space as rapidly as 60 GHz signals. The ability to form simultaneous
communication channels on the same frequency at extremely high data rates is what
makes the 60 GHz band attractive to use within a data center environment. Along
with IEEE 802.11ay standard it is very likely to exceed the efficiency of traditional
wired data center in terms of both power consumption and performance.
In order to obtain high bandwidth links for use within a data center environment,
LoS must be maintained between transceivers [19]. Furthermore, within a data
cen-ter, when these wireless transceivers and antenna modules are used in a ToR
con-figuration, link blockage becomes a major problem. Dense rack deployments in
standard data center layouts presents limitations for the formation of LoS links at
Chapter 2. Background & Related work 18
[30]. This presents a challenge for ToR transceivers that necessitate communications
across multiple isles. On the other hand, a medium access challenge exists in
de-termining what non-interfering links can be established in the same channel at the
same time. Each of these challenges and considerations are addressed in the
pro-posed approach.
2.2.8
Significance
My work will contribute towards the investigation into wireless data centers
uti-lizing the Server-to-Server Wireless Data center Network(S2S-WiDCN) architecture
designed and the unlicensed 60 GHz frequency band.A completely wireless DCN
will be explored with the goal of not only achieving efficiency, reduced
oversub-scription, scalability but also reduced power consumption and increased in-dependency(
Less number of intermediate hops, maximum of two hops). My S2S-WiDCN
archi-tecture along with IEEE 802.11ay standard will prove to be very efficient and their
19
Chapter 3
Traffic Modeling
In order to evaluate the performance of a data center network architecture it is
nec-essary to study and model the traffic in a data center. The nature of traffic in a data
center is studied and the characteristics of it are generalized. The main attributes of
traffics are Injection time, Source Node. Destination node, Size of Data, Data Rate(
often considered as injection rate). The study of traffic in [31] is modeled and is
used to stimulate the data center traffic for comparison of proposed S2S-WiDCN
architecture with that of practically used architectures like Fat-tree. Some of the
characteristics of traffic are discussed in detail in this section.
3.1
General Characteristics
The main attributes of a data center traffic are Injection time, Source Node.
Destina-tion node, Size of Data, Data Rate( often considered as injecDestina-tion rate). InjecDestina-tion time
specifies traffic’s arrival time at data center. It is specified in seconds. Most of the
traffic needs to be surfed at least more than through a couple of server to reach the
required information. The source node is the first server of contact and Destination
Chapter 3. Traffic Modeling 20
the servers with an unique number for identification and is used for specifying the
Source and Destination in traffic modeling. The numbering of server is done in a
orderly manner to suffice the routing protocol designed in this work. The naming
of servers will be more lucid in the routing part the work. Size of data is the amount
of data in a single traffic. It can be specified in Bytes, bits. Data rate is the rate
at which traffic arrives data center, also known as Injection rate. It is specified in
GigabitsperSecond or in any standard form of notation like Gbps, Bps.
FIGURE 3.1: CDF of Flow Transmission rate in Data Center with 800 Servers
3.2
Flow Transmission Rate
Flow transmission rate provides us the rate at which the traffic arrives a data center.
It is studied that Injection rate follows a Gaussian distribution [31]. In [31] the traffic
is studied in a university data center and is modeled with respect to the
conclu-sion from the study. Injection rate plays an important role in deciding the duration
Chapter 3. Traffic Modeling 21
FIGURE3.2: CDF of Flow Transmission rate in Data Center with 1600 Servers
threshold in determining the characteristics of traffic duration is Injection rate. The
effect of Injection rate on duration, latency will be discussed on detail in the results
of simulation in next chapter. Since the traffic is modeled with respect to [31], the
mean of Gaussian injection rate is 4303.69 Bps and variance is 69936.37 Bps2. The
value stated above is taken as base case and further investigation on higher rates are
explored in this work.
3.3
Duration
The time required for the traffic from the start at source server till completion is
regarded as the duration of that traffic. It is explored that the duration of traffics in a
data center follows s Pareto distribution. It is observed that almost about 80% of the
traffics duration is less than 11 Seconds each and duration of rest of traffic is higher
Chapter 3. Traffic Modeling 22
FIGURE3.3: CDF of Flow Duration in Data Center with 800 Servers
observed from the university data center is designed by adjusting the shape and
scale parameter and used for simulation.
3.4
Traffic Size
The size of the traffic is the amount of data needed to be transmitted. It can be
expressed as a product of Duration and Injection rate. Thus, Size of traffic helps to
determine the duration to which the traffic sustains in a data center.
Size o f Tra f f ic(Bytes) = Duration(s)∗Injectionrate(B/s)
From the expression it can be learned that characteristics of size depends on
dura-tion and injecdura-tion rate. It is dependent of two different distribudura-tion and its
Chapter 3. Traffic Modeling 23
FIGURE3.4: CDF of Flow Duration in Data Center with 1600 Servers
3.5
Significance
It is very important to generate a traffic similar to real world. It helps us determine
the efficiency and other parameters required for staying in competition with the
existing architecture and interconnections. In our study we have designed traffic
similar to the characteristics of real university data center and evaluated the
effi-ciency of various traditional architectures and have compared it with out proposed
Chapter 3. Traffic Modeling 24
FIGURE3.5: CDF of Flow Size in Data Center with 800 Servers
25
Chapter 4
Server-to-Server Wireless Data Center
Network (S2S-WiDCN) Design
The architecture of S2S-WiDCN is organized in to several parts. First topology is
explained in depth, along with several important design considerations. Next, the
60 GHz antenna technology adopted in this work is examined. Then the routing
path establishment mechanisms are explained and supported. Following the route
selection is a description of the chosen network protocols used to realize the wireless
DCN approach. Finally, this chapter will conclude with a section devoted to the
method of power modeling used to evaluate the power consumption of the DCNs.
4.1
Architecture
The proposed S2S-WiDCN architecture mainly depends on the identifying server
location and then defining a routing path depending on the server’s location. Thus,
numbering of servers will be an important step in the proposed architecture. A
pat-terned numbering will help in locating the source and destination thereby, helping
Chapter 4. Server-to-Server Wireless Data Center Network (S2S-WiDCN) Design26
wireless architecture and the methodologies utilized in the development of this
ar-chitecture.
4.1.1
Topology
A completely wireless interconnection is adopted in the proposed S2S-WiDCN
ar-chitecture, meaning any two servers with LoS have the capability of
communicat-ing uscommunicat-ing 60 GHz wireless transceivers. In the proposed architecture, each server is
equipped with a wireless module to establish completely wireless communication.
In this work, communication is divided into horizontal and vertical plane
Chapter 4. Server-to-Server Wireless Data Center Network (S2S-WiDCN) Design27
nication. To establish communication between servers in the vertical plane, an
an-tenna array is placed at the back of the server but the establishment of a connection
between any two servers is at the discretion of availability of LoS. Similarly, another
antenna array is placed at the top of a server to enable communication in the
hor-izontal plane. Each wireless module contains a transceiver and two antenna array
capable of communicating with any other wireless module within the data center.
The wireless data center is physically bound by the distance that a 60 GHz wireless
signal can reliably transmit to any other module.
Data center racks are laid out in a traditional configuration, with aisles running
between rows of data center racks. Space of 1U or 2U is provided between the
servers in a rack to support horizontal plane communication.
Chapter 4. Server-to-Server Wireless Data Center Network (S2S-WiDCN) Design28
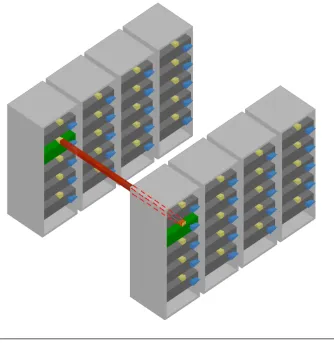
Horizontal Plane Communication
Antenna array at the top of a server is used to establish communication in the
hor-izontal plane. To avoid interference and obstructions from the rack frames,
com-munication in the horizontal plane are restricted only to a single line between
hor-izontally aligned servers. Horizontal plane communication enables LoS between
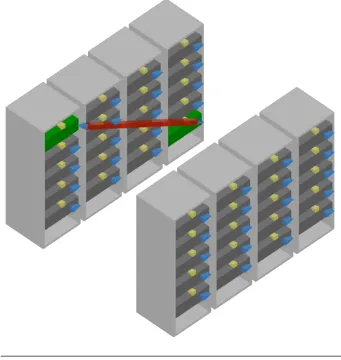
servers in different row and same column & height. Figure 4.3 shows an example
for horizontal communication.
[image:40.595.140.474.304.647.2]Chapter 4. Server-to-Server Wireless Data Center Network (S2S-WiDCN) Design29
Vertical Plane communication
Vertical plane communication helps in connecting servers in the same row. Distance
between two aisles helps to spatially reuse the 60 GHz band. This helps to maintain
large number of connections simultaneously while increasing the efficiency of
wire-less communication. The antenna array is arranged in such a manner to enable LoS
between all the servers in the same row. This is achieved by mounting the antenna
array in an elliptical manner with very less height change.
Chapter 4. Server-to-Server Wireless Data Center Network (S2S-WiDCN) Design30
4.1.2
Antenna Technology
3.1.2 Antenna Technology Each server of the datacenter will be equipped with a
wireless module consisting of a transceiver and two accompanying antenna arrays
[12]. This particular array [12] is fabricated using semiconductor lithography
tech-niques on a single wafer and is hence, extremely compact with a small size. As
the radiation pattern suggests, the array provides high directional gain of 9 dBi in
the forward and backward directions. Moreover, by adjusting the relative phase
of the antenna elements by activating various feed paths, beam-steering can be
ac-complished over an angle of 60 degrees in the plane of the array. As horizontal
communication happens in a single straight line, no steering is required in the
an-tenna arrays on top of the servers. However, as the range of steering angle is 60
degrees for this particular array, 6 antenna arrays are required to cover the entire
360 degree panorama in the vertical plane. Only one out of the 6 arrays will need to
be signaled at any given point of time to establish a single link involving that server.
Electronic beam-steering for the antenna array has negligible latency compared to
mechanically steered horn antennas used in earlier wireless DCNs [20]. Moreover,
the antenna array being extremely compact requires very tiny space on top of each
server to enable LoS communication in the horizontal direction. The effect of these
spaces on the vertical server density in the datacenter racks is discussed and
quan-tified in the results section.
The beam-steering of the transmitting and receiving antennas is achieved by using
a separate control interface using 2.4/5 GHz WiFi bands. Although the data rates
sustained by the WiFi bands are much lower than the 60GHz bands, it is sufficient
for the short control packets. Moreover, the isotropic antennas in the WiFi modules
Chapter 4. Server-to-Server Wireless Data Center Network (S2S-WiDCN) Design31
When a traffic flow between a pair of servers is created, a short control or header
packet for the flow will be sent over the WiFi band to enable communicating servers
to steer their antennas towards each other when required.
4.1.3
Establishment of Wireless Links
A wireless module will be able to connect to any other wireless ToR module within
the data center. This however, doesn’t mean that the servers are fully connected.
Whenever a wireless module connects to another wireless module, neither of these
modules can connect to any other wireless module on the same wireless channel.
Furthermore, although multiple wireless links can be formed at the same time, a
wireless link has the possibility of creating interference for other transmitting
wire-less modules. Intelligent link selection is necessary to prevent interference and to
optimize the establishment of links.
The link selection can be thought of as a type of scheduling problem. Given a list of
application demands over a period of time, wireless links must be established and
removed to satisfy bandwidth demands. These application demands can be
gen-erated through trace driven approaches or predictive mechanisms. Using this list
of known demands, wireless links are generated until an optimal state is achieved.
An optimal state can defined as a state in which the maximum amount of data is
transferred globally across the entire data center. Given the large number of
pos-sible combinations of links that can be established and the large set of application
demands, this scheduling problem becomes NP-Complete in computational
com-plexity. A simple greedy approach is taken to connect the wireless modules with
the largest demands on a first come first serve scheme. The greedy algorithm used
Chapter 4. Server-to-Server Wireless Data Center Network (S2S-WiDCN) Design32
FIGURE4.5: Greedy Algorithm Flowchart
The algorithm establishes as many non-interfering links as possible on a
first-come-first-serve basis until all demands are exhausted or the number of available channels
runs out. The list of unaddressed demands is ordered by the start time of each
demand. While this greedy approach may not reach an optimal state, it serves to
Chapter 4. Server-to-Server Wireless Data Center Network (S2S-WiDCN) Design33
4.2
Routing Protocol
In this section, we will discuss about the routing protocol designed to implement
wireless communication in the proposed S2S-WiDCN architecture in the previous
section. The topology helps in spatial re-usability of the frequency and the 60 GHz
band helps in attaining the data rates comparable to the existing wired or hybrid
architecture. Firstly, we will discuss about the allocating unique ID for servers and
then will explore the the steps involved in routing.
4.2.1
Server ID
An unique numbering pattern is followed throughout the data center to support the
proposed routing protocol. This step plays a vital role in sorting out the path to
be traversed in the data center. In this section, we will try to explain the server ID
allocating process with an example considering data center having about thousand
racks.
The rows are assumed to be in parallel with the X-axis of the 3D Cartesian coordinate
system. The servers are staked in racks along the Z-axis with spaces between them
to support HP Communication. The servers are alloted with a three digit number
with corresponding to the example considered. The hundred’s digit corresponds
to the Z-axis. The bottom severs in all racks are assumed to be at zero level and
increases by one moving upwards. Thus in our example, the servers on the top of
racks are at level 9. The ten’s place implies the row to which the server belongs and
Chapter 4. Server-to-Server Wireless Data Center Network (S2S-WiDCN) Design34
4.2.2
Inter and Intra Rack Communication
In our work, classification of communication between servers will help in
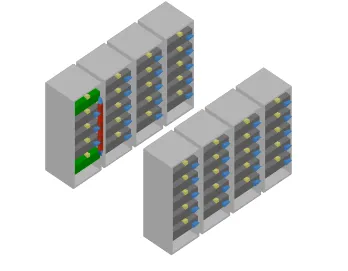
under-standing the proposed routing protocol. Communication in a data center can be
classified into Inter Rack and Intra Rack communication based on the servers
loca-tion. In a Data Center it is studied that almost eighty percent of the traffic is Intra
Rack. If servers communicating are present in the same Rack then such a
com-munication is known as Intra Rack comcom-munication. Intra Rack comcom-munication is
depicted in the Figure 4.6.
FIGURE4.6: Intra Rack Communication
Communication between servers in different racks at the data center is known as
Inter Rack communication. Inter Rack Communication can be further divided into
[image:46.595.134.482.331.602.2]Chapter 4. Server-to-Server Wireless Data Center Network (S2S-WiDCN) Design35
All Intra Rack Communications fall under Vertical Plane Communication as servers
participating are in the same rack. Let us briefly discuss Inter Rack Communication.
Horizontal Plane Inter Rack Communication
Communication between servers in same Z-axis & X-axis level and different Y-axis
falls under this category. The antenna array at the top of server is used for
commu-nication. Figure 4.7 shows an example for this type of commucommu-nication.
[image:47.595.132.472.314.665.2]Chapter 4. Server-to-Server Wireless Data Center Network (S2S-WiDCN) Design36
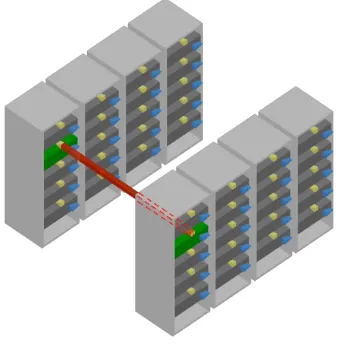
Vertical Plane Inter Rack Communication
Servers in the same row communicate using the Vertical Plane, such
communica-tions are classified as Vertical Plane Inter Rack Communication. An example for
Vertical Plane Inter Rack Communication is shown in Figure 4.8.
FIGURE4.8: Inter Rack Communication along Vertical Plane
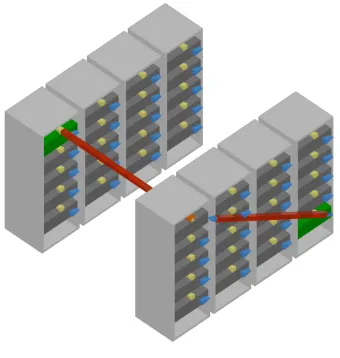
Apart from the cases discussed above, certain communication require both
Verti-cal plane and Horizontal plane communication. These communications require an
intermediate server for routing the traffic to the destination server. The maximum
[image:48.595.131.472.240.600.2]Chapter 4. Server-to-Server Wireless Data Center Network (S2S-WiDCN) Design37
model is two. Figure 4.9 depicts an example of communication requiring two hops.
FIGURE4.9: Inter Rack Communication with Two hops
The routing of traffics requiring two hops can be implemented either by
execut-ing Horizontal plane communication followed by Vertical plane communication or
by first implementing Vertical plane communication followed by Horizontal plane
communication. In our model, we have adopted the horizontal plane first method.
Thus communication between any two servers in a data center is made possible with
the proposed routing protocol. The worst case of the proposed routing protocol in
[image:49.595.132.472.167.525.2]Chapter 4. Server-to-Server Wireless Data Center Network (S2S-WiDCN) Design38
A control packet with instructions for intermediate and destination servers to
per-form beam-steering in the correct directions is sent over a separate IEEE 802.11 2.4/
5 GHz ISM band channel. Each server is equipped with a separate IEEE 802.11
transceiver. As the radiation pattern of the 60GHz antenna array has main lobes
in both forward and backward directions with zero phase difference, beam-steering
is not required for the horizontal linear communication (see Fig. 4.3). For
com-munications in the vertical planes, the server first sends a control packet to the
re-ceiver while simultaneously activating one of six antennas in the array and steering
its beam towards the receiver. Upon receipt of this control message, the receiver’s
wireless module chooses the antenna array in the correct sector out of the set of six
and steers that beam towards the sender though appropriate beamforming (setting
the antennas weights).
4.3
Power Consumption
Estimation of power consumed in a data center is a complex task. The power
consumption depends on several internal factors such as utilization of
comput-ing power, the coolcomput-ing mechanism, and datacenter networks. It is also affected by
external parameters like the geographical location, weather, temperature, and
hu-midity. In particular, the network contributes significantly to power consumption
in a datacenter [3]. Our focus is solely on networking, and we only analyze the
power consumption involved in networking. In that regard, we assume that the
power consumption other than networking is identical in all the cases. We
esti-mate power consumption for wired DCNs using commercially available data from
Cisco network switches [32][33][34]. Specifically, we use Cisco 7702 for the
Chapter 4. Server-to-Server Wireless Data Center Network (S2S-WiDCN) Design39
TABLE4.1: Power Consumption of different DCN components
Device Model Adapted in Power Consumption
(Watts) Typical Maximum
Access Layer Switch
Cisco 9372 Fat-Tree, Optical, ToR WiDCN 210 650 Cisco 3560CX-8PD DCell 24.20 24.40 Cisco 3560CX-12PD BCube 28.90 26.50
Aggregate Layer Switch Cisco 9508 Fat-Tree 2527 3324
Core Layer Switch Cisco 7702 All 837 1305
Network Interface Card
Silicom PE2G2135 Fat-Tree, Optical, ToR WiDCN 2.64 3.36 Silicom PE2G4135 DCell, BCube 3.60 5.04
Antenna and Wireless Transceiver and Antenna Power ToR WiDCN, S2S-WiDCN 0.50 1
WiFi Adapter D-Link DWA-171 S2S-WiDCN 0.22 0.24
switches. We also use the data from Silicom PE2G2135 for the power consumption
of the network interface cards (NIC) [35]. More formally, the power consumption of
each core and aggregate switches are as follows:
PCore =PI/O cards+PFanTray+Psv
PAgg =PI/O cards+PFanTray+Psv+PFabric+PSysCtrl
Where PI/Ocards, PFanTray, Psv, PFabric, PSysCtrlrepresent the power consumption of the
input/output card, fanout ports, supervisor controller, cables and system controller
respectively. Then the total power is calculated as follows:
Chapter 4. Server-to-Server Wireless Data Center Network (S2S-WiDCN) Design40
Where NCore, NAgg, NAcc, NS are the number of core, aggregation, access switches,
and the total number of servers respectively.
Unlike the fat-tree wired DCN, both DCell and BCube use low-power commodity
switches instead of power-hungry aggregate- and access-layer switches. For this,
we consider Cisco 3560CX-8PC-S [34] and Cisco 3560CX-12PD-S [34] for small and
medium-scale datacenters, respectively. For the NIC, we assume Silicom PE2G4I35
with multiple connecting ports essential for these architectures. We also consider
two core switches that act as gateways to the external network. We again use PCore
equation to estimate their power consumption but without aggregate-layer switches.
The fixed power dissipation of the infrastructure dominates the power consumption
of network devices. The power consumption is not affected by data rates much, and
therefore this dependency is largely ignored in the estimation.
In S2S-WiDCN, however, no core, aggregate or access layer switches are needed, but
only antennas, transceivers and NICs are required for wireless communication. The
power consumption of the wireless 60GHz transceiver is measured based upon the
assessment of emerging 60GHz transceivers such as [8]. The NICs of S2S-WiDCN
are equipped with two transceivers for horizontal and vertical communication. In
the traditional DCN, external connections are established via the two core switches.
To provide equivalent connectivity in S2S-WiDCN, we employ two servers to work
as gateways, and their power consumption is modeled as that of Cisco 7702. We
use the D-link DWA-171 WiFi adapter for the control channel. Now the power
con-sumption of communication per server in S2S-WiDCN is calculated as:
PWireless =P60 GHz Tran+PAntenna+PWifiControl
Chapter 4. Server-to-Server Wireless Data Center Network (S2S-WiDCN) Design41
the power consumption of the WiFi adapter for the control channel, and PAntenna is
the power transmitted through the antennas. We conservatively adopt P60Ghz Tran+PAntenna
to be 500mW for an average case, and 1W the for maximum case from [8]. We
con-sider PWifi Controlto be 220mW for the datasheet of D-link DWA-171. Finally, the total
power consumption in S2S-WiDCN becomes:
PTotal WiDCN =NCorePCore+NsPWireless
4.3.1
Analysis of Power Consumption
The primary advantage of S2S-WiDCN is lowered power consumption. To study
this more deeply, we show the total power consumption estimated for the typical
and maximum cases for all the DCNs in Figure 4.10. In the typical scenario, the
average power consumption of every device is used, while the maximum power
consumption is considered in the maximum cases. For small-sized and mid-sized
DCNs, the result shows at least 6-fold and 18-fold reduction in both maximum and
typical power consumption of S2S-WiDCN compared to the traditional DCN
topol-ogy respectively. The complete elimination of power-hungry aggregate and
access-layer switches contribute to this drastic reduction primarily. In comparison to both
DCell and BCube, roughly 6-fold power reduction is observed for S2S-WiDCN for
both small and medium-sized datacenters, DCell and BCube consume less power
compared to the fat-tree DCN due to the low power commodity switches that these
DCNs use. This power saving, however, comes at the cost of huge cabling
com-plexity. Unlike DCell and BCube, S2S-WiDCN can save power consumption
sig-nificantly, specifically at least 6-fold and 18-fold reduction. A media converter is
Chapter 4. Server-to-Server Wireless Data Center Network (S2S-WiDCN) Design42
FIGURE4.10: Power Consumption comparison of different DCNs
ones, and these converters use non-negligible power. Moreover, the signals are also
converted in switches and routers ultimately increasing the total power
consump-tion of the switches and routers. Since access-level switches are needed per rack in
the ToR-WiDCN, its reduction in power consumption not as significant as the
opti-cal network. These estimates indicate the potential reduction in power consumption
is up to 18-fold if wireless interconnections are used in DCNs. Next, we evaluate the
performance of S2S-WiDCN and its comparison with alternate DCNs.
4.4
Simulation Platform
We used the NS-3 network simulator [36] that supports testing the characteristics of
wireless propagation as well as network-level communications. It is critical to
simu-late the characteristics of both wireless propagation and network-level
communica-tion accurately to obtain realistic performance results. We used a modified version
Chapter 4. Server-to-Server Wireless Data Center Network (S2S-WiDCN) Design43
and the IEEE 802.11ad standard as discussed in [11]. This extension incorporates
in-terference modeling, bit error rates, and directional antenna modeling. The accuracy
of these parameters is verified with physical layer measurements from their
proto-type 60GHz hardware [11]. Additionally, we introduced criteria for wireless link
selection to enable many concurrent links, and modify the IEEE 802.11ad physical
layer channel to allow multiple OFDM channels to operate at gigabit speeds. The
latencies for the exchange of header packets via the WiFi channels and electronic
beam-steering are negligible as they are orders of magnitude smaller than the
aver-age flow transmission duration. The overall latency includes the transmission delay,
propagation delay, queuing delay, and the delay introduced by beam steering and
control packet exchange. We consider two datacenter sizes in the experiment. The
first one is a small-sized datacenter with a total of 800 servers representing those in
an educational institution. The second one is a mid-sized datacenter, and has 1600
servers representing those in private enterprises. In both cases, the servers are
ar-ranged in a 20 by 8 array of racks. There are 10 racks arar-ranged in a single row and
two columns of 8 rows, totaling 160 racks. Each rack occupies an area of 0.6m by
0.9m and is 2m high containing 5 servers. Adjacent rows are separated by 1m and
the width of the central aisle is 2m. This separation between rows coupled with
the directional radiation pattern of the antennas ensures that the vertical planes of
wireless communication are spatially isolated meaning that communications in one
plane do not interfere with those in the next
4.5
Performance Analysis
In this section, the simulation results of S2S-WiDCN along with a comparative
Chapter 4. Server-to-Server Wireless Data Center Network (S2S-WiDCN) Design44
4.5.1
Traffic Flow Completion Duration
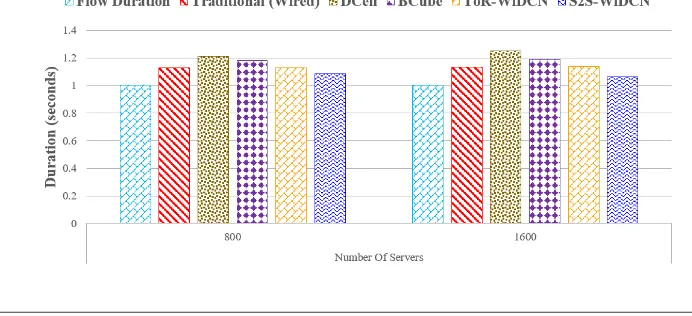
The flow completion durations for all the DCNs are shown in Figure 4.11. The
aver-age completion duration of S2S-WiDCN is lower than that of all the wired networks
for both 800 and 1,600 servers. S2S-WiDCN and the other DCNs considered in this
work were able to successfully complete routing of all the flows that were exchanged
between the servers over the duration of simulations. Fewer hops are involved in
data delivery in S2S-WiDCN, it results in lower time of flight and switching
over-heads. Table 4.2 shows the packet latencies of representative network devices for
various DCN architectures that are considered in this paper. As can be seen in table
each NIC has a packet delay of around 30s. Due to higher number of hops through
the NICs in BCube and DCell compared to S2S-WiDCN signified by higher
hop-counts, the flow control duration in them are higher. DCell shows the highest
aver-age flow completion durations because it requires a large number of hops ranging
from 2 to 10. BCube performs slightly better than DCell because of lower number
FIGURE4.11: Flow Completion duration
of hops involved in data delivery. This advantage mainly comes from more number
[image:56.595.136.482.491.649.2]Chapter 4. Server-to-Server Wireless Data Center Network (S2S-WiDCN) Design45
number of hops in BCube . In the traditional fat-tree wired network, two servers
even in a single rack need to go through their access layer ToR switch to
communi-cate, traversing at least 2 hops. Even intra-rack flows incur the access layer
switch-ing delay as shown in Table 4.2 in the fat-tree DCN. Inter-rack flows incur higher
delay through the other switching layers as well shown in Table 4.2. In S2S-WiDCN,
however, two intra-rack servers can communicate directly in a single hop incurring
only the packet delay from the NICs as shown in Table 4.2, transceiver delay and
time of flight. The transceiver delay in 60GHz wireless transceivers is 0.1 ns per bit
[8]. Therefore, the packet latency of the wireless links is 150 ns. The time of flight
is in the order of nanoseconds and is accounted for, by NS-3 based on the distance
between the communicating servers. Therefore, the direct server-to-server wireless
communication in S2S-WiDCN through the NICs and the wireless transceivers has
lower flow completion duration compared to the hierarchical Fat-Tree DCN where
the flows have to traverse through slower upper-layer switches in addition to the
NICs. The beam-steering latency is 266 microseconds and is considered while
com-puting the flow completion duration of S2S-WiDCN in Figure 4.11, The majority of
datacenter communication is known to be intra-rack [31], and this makes the
wire-less S2S-WiDCN reduce delays for most of the packets, which are intra-rack due to
single-hop wireless links along the vertical planes.
4.5.2
Throughput
Throughput is also measured for these different DCN architectures under the
traf-fic conditions described. We are interested in whether S2S-WiDCN imposes any
adverse impact on throughput. The results show that S2S-WiDCN provides
Chapter 4. Server-to-Server Wireless Data Center Network (S2S-WiDCN) Design46
TABLE4.2: Packet latency in different devices
Device Model Adapted in Average Packet Delay
Access Layer Switch
Cisco 9372 Fat-Tree, Optical, ToR WiDCN 1.5µs
Cisco 3560CX-8PD DCell 4.9µs
Cisco 3560CX-12PD BCube 4.9µs
Aggregated Layer Switch Cisco 9508 Fat-Tree 3.6µs
Core Layer Switch Cisco 7702 Fat-Tree 5µs
Network Interface Card
Silicom PE2G2135 Fat-Tree, Optical, ToR WiDCN ∼30µs
Silicom PE2G4135 DCell, BCube ∼30µs
Antenna and Wireless Transceiver ToR WiDCN, S2S-WiDCN ∼150µs
DCNs achieve throughput that closely matches the flow transmission rates.
The main reason to have a lower number of hops in S2S-WiDCN is to achieve fewer
intermediate nodes with the possibility of lesser network congestion. All these
re-sults and analysis indicate that S2S-WiDCN outperforms the fat-tree DCN as well
as other server-centric networks including DCell and BCube.
4.6
Conclusions
The challenges in current Data Center Network’s are high design and maintenance
cost, huge power consumption, high cabling complexity which are hard to keep
accurate per-cable information and inefficient cooling. Structured cabling bundle
incur significant initial effort and cost to setup and still may cause airflow blockage.
Chapter 4. Server-to-Server Wireless Data Center Network (S2S-WiDCN) Design47
TABLE4.3: Comparison between different data center architectures
No. of Servers Wired Fat-Tree DCell BCube ToR-WiDCN S2S-WiDCN
Average Flow Completion Duration (Seconds)
800 1.128 1.2108 1.1810 1.1283 1.0847 1600 1.134 1.2514 1.1914 1.136 1.063 Average Throughput
(KBps)
800 0.971 0.961 0.970 0.959 0.999 1600 0.964 0.949 0.964 0.951 0.989
Minimum No. of Hops
800 6 10 8 3 2
1600 6 10 8 3 2
Average No. of Hops
800 2.54 3.71 3.25 2.203 1.172 1600 2.60 3.77 3.29 2.214 1.182
server-to-server DCN architecture. We observe that the S2S-WiDCN improves the
flow completion duration and throughput compared to conventional fat-tree based
DCNs for typical query/response based applications, while reducing the power
consumption by six to eighteen times.
4.7
Future Work
The emergence of IEEE802.11ay provides high possibilities of extended
transmis-sion, resulting in increase in data center size. The proposed wireless server-to-server
architecture along with incorporation of other interconnect medium like optical can
contribute to inc