University of Southern Queensland
Faculty of Engineering and Surveying
Effect of Existing Cracks in Shear Strengthening of Concrete
Girders with External Post-tensioning
A dissertation submitted by
Todd Whittaker
in fulfilment of the requirements of Courses ENG4111 and 4112 Research Project
towards the degree of Bachelor of Engineering (Civil)
i
Abstract
There is a need to strengthen bridges structures due to increased traffic loading and aging of bridges. Full bridge replacement poses the problems of high cost and disruption to traffic, so a suitable method or repair and strengthening are required.
External post-tensioning is considered as one of the effective methods of to strengthen bridge structures. A common deterioration of bridges is shear cracking. Existing shear cracks can limit the effectiveness of external post-tensioning.
Epoxy injection is a method of structurally repairing cracks. The injection of epoxy resin could possibly repair the shear cracks. This paper is utilizes the rehabilitation technique of strengthening with external post-tension and crack repair with epoxy injection.
The effect of the existing shear crack in an externally post tensioned reinforced concrete beam is a complex function depends on a number of parameters including the nature of the crack, concrete strength, prestressing force and amount of shear reinforcement. The amount of shear reinforcement could significantly affect the amount of stress transfer across an existing shear crack.
ii
University of Southern Queensland
Faculty of Engineering and Surveying
ENG4111 Research Project Part 1 &
ENG4112 Research Project Part 2
Limitations of Use
The Council of the University of Southern Queensland, its Faculty of Engineering and Surveying, and the staff of the University of Southern Queensland, do not accept any responsibility for the truth, accuracy or completeness of material contained within or associated with this dissertation.
Persons using all or any part of this material do so at their own risk, and not at the risk of the Council of the University of Southern Queensland, its Faculty of Engineering and Surveying or the staff of the University of Southern Queensland.
This dissertation reports an educational exercise and has no purpose or validity beyond this exercise. The sole purpose of the course "Project and Dissertation" is to contribute to the overall education within the student’s chosen degree programme. This document, the associated hardware, software, drawings, and other material set out in the associated appendices should not be used for any other purpose: if they are so used, it is entirely at the risk of the user.
iii
Certification
I certify that the ideas, design and experimental work, results, analyses and conclusions set out in this dissertation are entirely my own effort, except where otherwise indicated and acknowledged.
I further certify that the work is original and has not been previously submitted for assessment in any other course or institution, except where specifically stated.
Todd Whittaker
Student Number: W0050025215
________________________________ Signature
iv
Acknowledgements
The author would like to express sincere gratitude to his supervisors Dr. Thiru Aravinthan for his guidance and support throughout the course of this project.
This research involved a large portion of experimental investigation, and so required a great deal of assistance throughout. Many thanks are directed to Dan Eising and Mohan Trada for their invaluable assistance during the construction and testing stages of this research.
The author would also like to thank his fellow peer, Kumaran Suntharavadivel for his kind assistance throughout the course of this project.
Mr Todd Whittaker
v
Abstract………...i
Acknowledgements………...iv
List of Figures………...viii
List of Tables……….…ix
Nomenclature……….x
1 INTRODUCTION 1.1 Project Aim 1
1.2 Background 2
1.3 Summary 3 2 LITERARURE REVIEW 2.1 Introduction 4
2.2 Need for Strengthening 4
2.3 Selection of Appropriate Strengthening Technique 5 2.4 External Post-tensioning 6
2.5 Epoxy injection 8
2.6 Epoxy Injection Combined with External Post-tensioning 8 2.7 Shear Capacity Predictions 8
2.8 Reinforced Concrete Beam 9
2.9 Externally Post-tensioned Concrete Beam 11 2.10 Summary 12 3 DESIGN METHODOLOGY 3.1 Introduction 13
3.2 Preliminary Design 15
3.2.1 Design of Reinforced Beam 15
3.2.2 Flexural Capacity 16
3.2.3 Shear Capacity 22
3.2.3 Shear Capacity 25
3.3.1 Selection of Post-tension Force 25
3.3.2 Flexural Capacity 26
3.3.3 Shear Capacity 32
vi
4.1 Introduction 36
4.2 Construction Methodology 36
4.2.1 Formwork 36
4.2.2 Reinforcement 37
4.2.3 Pouring the Concrete 38
4.2.4 Stripping, curing and movement 39
4.2.5 Post-tensioning 39
4.2.5.1 Prestressing Rods 39
4.2.5.2 End Anchorage 40
4.2.6 Epoxy Repairing 40
4.2.6.1 Lokfix E 41
4.2.6.2 Nitofill LV 42
4.3 Testing Methodology 43
4.3.1 Introduction 43
4.3.2 Test Configuration 43
4.4 Data logging 45
4.5 Loading 45
4.6 Concrete Compressive Strength Tests 45 5 RESULTS AND DUSSCUSSION
5.1. Introduction 46
5.2. Material Tests 46
5.2.1. Concrete Slump Analysis 46
5.2.2. Concrete Compressive Strengths 46
5.3 Crack Observation 48
5.3.1 Specimen B1 (control beam) 48
5.3.2 Specimen B2 48
5.3.3 Specimen B3 50
vii 5.4 Load – Deflection Characteristics 52
5.4.1. Specimen S1 53
5.4.2 Specimen S2 54
5.4.3 Specimen B3 55
5.4.4 Specimen B4 56
5.5 Comparison of Load – Deflection Characteristics 57 5.6 Increases in External Post-tension Force 58 5.7 Section Capacities Based on Actual Material Properties 59
5.7.1 Control Beam 59
5.7.2 Initial Cracking 60
5.7.3 After Repair 61
5.8 Comparison of Practical Results with AS3600 Predictions 62
5.9 Summary of Practical Results 63
5.10 Comparison of Results with Previous Research 64 66 CONCLUSIONS AND RECOMMENDATIONS
6.1 Summary 65
6.2 Achievement of Objectives 65
6.3 Conclusions 67
References 68
APPENDIX A Project Specification 69
viii Figure 3.1: Specimen Size and Loading Position 14
Figure 3.2: Cross Section of the Design Specimen 15 Figure 3.3: Doubly Reinforced Section at Ultimate Moment 16 Figure 3.4: Positioning of Post-tensioning Bars 26
Figure 3.5: Specimen Design 35
Figure 4.1: Beams after casting 38
Figure 4.2: Test cylinders 38
Figure 4.3: Stressing of Rods 40
Figure 4.4: Test Configuration 44
Figure 5.1 Crack pattern for B1 48
Figure 5.3 Initial shear crack pattern in B2 49
Figure 5.4 Crack pattern in specimen B2 49
ix
Table 3.1: Summary of Design Capacities 35
Table 4.1: Test Conditions for Specimens 43
x
Ag = gross cross-sectional area
Apt = cross-sectional area of prestressing steel
Asc = cross-sectional area of compressive reinforcement
Ast = cross-sectional area of tensile reinforcement
Asv = cross-sectional area of shear reinforcement
Asv-min = cross-sectional area of minimum shear reinforcement
Asv-max = cross-sectional area of maximum shear reinforcement
vα = distance from load point to nearest support
b = width of rectangular cross-section
bef = effective width of the compression face
bv = effective width of web for shear (equal to b for rectangular cross-sections)
Cc = compressive force in the concrete
Cs = compressive force in the compressive reinforcement
D = depth of section
d = depth to resultant force in tensile steel at Mu
dn = depth to neutral axis in a section
do = distance from the extreme compressive concrete fibre to the centroid of the outer most
layer of tensile reinforcement
dp = depth to the prestressing steel
dsc = depth to centre of compressive reinforcement
dst = depth to centre of tensile reinforcement
e = eccentricity of prestressing force from the centroidal axis of the section
Es = Young’s modulus of steel
ƒ’c = characteristic compressive cylinder strength of concrete at 28 days
ƒpy = yield strength of prestressing steel
ƒsy = yield strength of reinforcing steel
ƒsy.f = yield strength of shear reinforcement
Ig = second moment of area of the uncracked section
ku = ratio of neutral axis depth to outer most layer of tensile steel depth
xi
Mu = ultimate moment capacity 12
P = prestressing force
Pu = theoretical ultimate load capacity of a beam
Pu.f = theoretical ultimate flexural capacity load of a beam
Pu.s = theoretical ultimate shear capacity load of a beam
Pue = experimental ultimate load capacity of a beam
Pv = vertical component of prestressing force
s = spacing of shear reinforcement
Tp = tensile force in prestressing steel
Ts = tensile force in tensile reinforcement
Vdec = shear force at decompression moment
Vu = ultimate shear strength
Vuc = concrete component of ultimate shear strength
Vus = shear reinforcement contribution to ultimate shear strength
β1β2β3= multiplying factors for determining Vuc
γ= ratio of the depth of the assumed rectangular compressive stress block to dn at Mu
γxy = shear strain
εmax = maximum principal strain
εmin = minimum principal strain
εsc = strain in the compressive reinforcement
γst = strain in the tensile reinforcement
εu = extreme compressive fibre strain at ultimate strength in pure bending
θv = angle between the concrete compression strut and the longitudinal axis of the beam
σp.ef = effective stress in the prestressing steel
CHAPTER 1
INTRODUCTION
1.1 Project Aim
This project aims to investigate the effectiveness of a technique for the repair of shear cracks of reinforced concrete beams. To investigate the effect of how shear reinforcement ratio affects the behaviour of this repair technique. The aim is experimentally investigated.
Furthermore this project aims to investigate the effect of shear reinforcement ratio in the behaviour of shear strengthening of reinforcement concrete beams using epoxy injection and horizontal external post-tensioning. This is an ongoing project which is an extension of the research done by Steven Luther and Paul Bolger. This project will further the research done Steven Luther. This research “Effect of Existing Cracks in Shear Strengthening of Concrete Girders with External Post-tensioning” Luther, USQ, 2005 will form the base of which this project will be conducted.
This will be predominately done though experimental tests conducted on four design beams. Experimental results will be used to make a comparison of existing design models will also be made.
To achieve these aims, the following objectives had to be met:
1. Research and review background information on the shear strengthening of concrete girders using epoxy injection and external post-tensioning.
3. Prepare model beams, and arrange testing devices.
4. Conduct tests on the model beams, and record observed results.
5. Evaluate and analyse the test results of the different model beams.
6. Arrive at a conclusion for the project, which will better explain the shear behaviour of rehabilitated girders using epoxy injection and external post tensioning.
1.2 Background
Most of the bridges on the road and motorway network were constructed in the 1960s and 1970s, and some bridges on the road network are very much older. Most were built in reinforced or pre-stressed concrete and have steel embedded within them. A combination of natural weathering, chemical attack, low quality construction materials, can cause structural deterioration. Over the years, traffic flows and the maximum permitted weight of heavy goods vehicles have both increased, and required standards of safety have improved. A combination of these factors and the deterioration of elements of a bridge create the need for strengthening.
In response to the need for a simple, efficient method to strengthen existing bridges, the
use of external post-tensioning has gained wide acceptance. External post-tensioning is
considered as one of the effective methods of to strengthen bridge structures. A common deterioration of bridges is shear cracking. Existing shear cracks can limit the effectiveness of external post-tensioning.
A structural rehabilitation of reinforced concrete beams in shear was studied, with particular attention paid to the effect of shear reinforcement ratio. A series of model beams, reinforced with a high shear reinforcement ratio, were loaded in the laboratory until a major diagonal shear crack developed on both shear plans. Individual beams were unloaded, repaired, again loaded to failure. Scaled size beams were tested. A conclusion is drawn form surface-strain measurements, load deflection data and crack measurements.
A laboratory study was conducted on a four reinforced concrete beams concrete beams loaded in four point flexural loading to understand the behavior repaired by the rehabilitation method. The influence on final repair strength from the amount of shear reinforcement was emphasized.
This is an on-going project aimed to experimentally investigate the effect of shear reinforcement ratio in a reinforced concrete beam strengthened by external post tensioning. A comparison of existing design models for shear strength predictions will also be made.
1.3 Summary
CHAPTER 2
LITERARURE REVIEW
2.1 Introduction
Previous research has been done on “Horizontal post tensioning” by Luther (2005) and there was found to be a 58% increase in shear capacity when the “Horizontal post tensioning” technique was used in conjunction with the epoxy resin, while without the epoxy there was no effect of shear strengthening to be seen.
The research investigated by Luther (2005) was with minium shear reinforcement. Minium shear reinforcement has ligatures spacing of 250mm. This allowed 1 ligature in the shear zone of the experiment with 2 ligatures under the loading points. After pre loading this ligature may have significant failure. The ligature may have yielded or possibly broken proposing of a lower regain in shear strength.
This project will investigate the shear strength of the combined repair technique with an increase of shear reinforcement. The shear reinforcement will have a spacing of 180mm. This will allow 3 ligatures in the shear zone. The experiments will be conducted under the same conditions as Luther (2005) to allow a comparison in the regain in shear strength.
2.2 Need for Strengthening
Most of these bridges have either flexural or shear cracks that need to be repaired to protect the reinforcement from corrosion, and reduce deflections to below serviceable limits. There is a need to strengthen bridges structures due to increased traffic loading and aging of bridges. Full bridge replacement poses the problems of high cost and disruption to traffic, so a suitable method or repair and strengthening are required.
There has been extensive research into the flexural strengthening of concrete bridges using external post tensioning, but little on shear strengthening. The flexural behaviour of new and existing bridge members by external post-tensioning has been studied in detail by many researchers. However, there have been relatively limited investigations on the shear strengthening and the effect of shear in externally post-tensioned members (Tan & Ng 1998).
From the previous studies on flexural strengthen-ing (Aravinthan, Sabonchy & Heldt 2004; Harajli 1993), it is proven that the flexural cracks were al-most or completely closed by the application of external post-tensioning. Hence, they have no influence on the capacity of the concrete beams. While a number of experimental studies attempted to study the effect of existing shear cracks in the reinforced concrete members (Khaloo 2000; Teng et al. 1996), the effect of the existing shear cracks in externally post-tensioned member has not been investigated adequately.
2.3 Selection of Appropriate Strengthening Technique
costs of the strengthening project, but also the maintenance costs associated with the future in-service behaviour. The condition of the existing bridge is an important consideration. If the bridge is in bad condition, then future maintenance and safety problems might override the benefits of the reduced capital costs of strengthening and provide justification for bridge replacement. The strength and condition of the substructure must not be ignored and strengthening should not proceed without giving due consideration to the capacity of the bridge piers, abutments and foundations. The difficulties associated with traffic management and the costs arising from traffic delays should be considered in the economic justification. In some cases, this may limit the use of certain methods of strengthening.
Many strengthening techniques have general applicability, but some may be specific to particular bridge types and configurations. The decision to adopt a particular scheme is based on the consideration of a wide range of parameters. The remainder of this paper is concerned with external post-tensioning for bridge strengthening. The general principles, advantages and disadvantages are described in the following sections.
2.4 External Post-tensioning
The use of external prestressing as a means of strengthening or rehabilitating existing bridges has been used in many countries and has been found to provide an efficient and economic solution for a wide range of bridge types and conditions. The technique is growing in popularity because of the speed of installation and the minimal disruption to traffic flow which can, in many cases, be the critical factor in decisions regarding strengthening. In spite of its obvious advantages, there is a lack of general information on how it can be applied and there are no specific guidelines available on this method of strengthening.
post-tensioning requires access to the sides and sometimes the ends of the member. Tendons are connected to the structure at the anchor points, typically located at the member ends.
Pisani (1999) identifies that external post-tensioning appears to be the most promising form of rehabilitation or strengthening of statically determinant structures, particularly bridges. Pisani (1999) found that applying post tensioning to a beam without shear cracking, increases the shear capacity of the beam. This points towards post tensioning increasing a damaged member’s shear capacity, if the shear cracks are successfully repaired with epoxy.
AS3600 Clause 8.1.6 states that for a beam with a span-to-depth ratio of 35 or less, the stress in a tendon not yet bonded at ultimate strength, shall be determined from
400 . 100 . . ' 70 . . ⎟⎟≤ + ⎠ ⎞ ⎜ ⎜ ⎝ ⎛ + +
= pef
pt ef ef ef p pu A d b c f σ σ σ
and for a beam with a span-to-depth ratio of greater than 35
200 . 300 . . ' 70 . . ⎟⎟≤ + ⎠ ⎞ ⎜ ⎜ ⎝ ⎛ + +
= pef
pt ef ef ef p pu A d b c f σ σ σ Where, ef p.
σ = effective prestress
c
f' = 28 day compressive strength
ef
b = effective width of the compression face
p
d = depth to prestress tendons
pt
2.5 Epoxy injection
Epoxy injection can be used as means of restoring shear cracks. This repair method involves the process by which resins are injected in a controllable manner to fill or treat a crack, thereby restoring the structure to its original design capability.
It is good for structural repair, as it has tensile and compressive strengths greater than concrete. According to Epoxysystems (2001), epoxy used for bonding concrete cracks has a tensile strength of 34-55 MPa, and a compressive strength of 70-80 MPa. Due to the strong bond formed with concrete, and the high strength characteristics of epoxy, cracked members repaired with epoxy injection should regain their original strength.
2.6 Epoxy Injection Combined with External Post-tensioning
Woods (2004) conducted model testing of a bridge headstock repaired by epoxy injection and external post-tensioning. He found that by repairing the existing shear cracks with epoxy injection and post-tensioning, significant increases in ultimate capacity and stiffness were achieved. He also strengthened one of the cracked model headstocks with just post-tensioning, with a slight increase in capacity found.
2.7 Shear Capacity Predictions
AS3600 Clause 8.2.2 states the design shear strength of a beam shall be taken as _Vu
Where,
Vu = Vuc+Vus
ϕ = 0.7 ((strength reduction factor used for shear strength in limit state
design)
Here,
Vus = Shear resisted by ligatures
The shear force resisted by the ligatures is the same for both reinforced beams and post tensioned beams. For perpendicular shear reinforcement, Clause 8.2.10 of AS3600 states
v f sy sv us s d f A
V . . . 0⎟⎟cotθ
⎠ ⎞ ⎜⎜ ⎝ ⎛ = Where,
s = centre to centre spacing of shear reinforcement
v
θ = angle between the axis of the concrete compression strut and the longitudinal axis of the member, taken as varying linearly from 30o when * .min
u
V
V =ϕ to 45o when * .max u
V V =ϕ
sv
A = cross sectional area of shear reinforcement
f sy
f . = yield strength of shear reinforcement
2.8 Reinforced Concrete Beam
For a reinforced concrete beam, clause 8.2.7.1 of AS3600 states
3 1 3 2 1 . ' . . . . . . ⎟⎟ ⎠ ⎞ ⎜⎜ ⎝ ⎛ = o v st o v uc d b c f A d b V β β β
1 . 1 1000 6 . 1 1 . 1 0
1 ⎟≥
⎠ ⎞ ⎜ ⎝ ⎛ − × = d β 2
β = 1, generally for members without significant axial force; or
= 0
5 . 3 1 * ≥ ⎟ ⎟ ⎠ ⎞ ⎜ ⎜ ⎝ ⎛ − g A
N , for members subject to significant axial tension;
or = ⎟⎟ ⎠ ⎞ ⎜ ⎜ ⎝ ⎛ − g A N 14 *
1 for members subject to significant axial compression.
This factor illustrates the effect of axial force on the propagation of shear cracks. A compressive force reduces crack propagation, and therefore increases the shear resisted by the concrete. Conversely, axial tension encourages the shear cracks to form.
3
β = 1; or may be taken as –
= v o d α ×
2 but not greater than 2, provided that the applied loads and the support are orientated so as to create diagonal compression over the length αv
v
b = width of the section
o
d = distance from top edge to centre of bottom longitudinal reinforcement
c
f' = 28 day concrete compressive strength
st
A = cross sectional area of longitudinal reinforcement
g
A = gross cross sectional area
*
N = design axial force
v
2.9 Externally Post-tensioned Concrete Beam
For a post tensioned beam, clause 8.2.7.2 (a) of AS3600 states that for flexure-shear cracking v o o v pt st o v
uc V P
d b c f A A d b
V ⎟⎟ + +
⎠ ⎞ ⎜⎜ ⎝ ⎛ + = 3 1 3 2 1 . ' ) ( . . . . .β β
β
Where,
c f d bv, o ' ,
, , 2 3
1 β β
β and Apt are the same as for the reinforced beam
Pv= 0, as the post-tensioning rods are horizontal
Vo = the shear force which would occur at the section when the bending moment at the
section was equal to the decompression moment (Mo)
⎟⎟ ⎠ ⎞ ⎜⎜ ⎝ ⎛ = * * 0 V M M
for simply supported conditions, where M* and V* are the
bending moment and shear force respectively, due to the same design loading
b g g b g o y I I y e P A P
M ⎟⎟
⎠ ⎞ ⎜ ⎜ ⎝ ⎛ + = . . Where,
P = post-tensioning force = 150kN
Ag= gross cross-sectional area
= 45000mm2
e = eccentricity from the centroid of the section = 50mm
yb= distance from the centroid to bottom edge
= 150mm
Ig= Second moment of area of the uncracked section
For web-shear cracking, AS3600 clause 8.2.7.2 (b) states:
v t
uc V P
V = +
Where,
Vt =the shear force, which in combination with the prestressing force and other action effects at the section, would produce a principle tensile stress of 0.33 f' at either the centroidal axis or the intersection of flange and web, c
whichever is more critical.
Pv = vertical component of prestress force
2.10 Summary
CHAPTER 3
DESIGN METHODOLOGY
3.1 Introduction
The effect of shear reinforcement in the technique described in Chapter 2 will be investigated experimentally on 4 model beams. The follow is a description of what each beam will be used for in this research.
Specimen B1– This will be used to determine the strength of a new reinforced concrete beam with no external post tensioning
Specimen B2- The beam will be preloaded to induce shear cracks, the beam will be strengthened with external post tensioning.
Specimen B3 - The beam will be preloaded to induce shear cracks, the beam will have it cracks repaired with epoxy injection it will also be strengthened with external post tensioning.
Specimen B4- This will be used to determine the strength of a new reinforced concrete beam with external post tensioning.
Specimen B1 will be loaded to it ultimate shear capacity. Specimen B2 and B3 will be loaded to approximately 90% of Specimens B1 ultimate shear capacity in the preloading to induce shear cracks. Specimen B1 and B4 will be used as control beam to make comparisons of the repaired beams against new beams.
span were made to ensure shear failure over flexural failure. Four point loading was chosen to cause shear failure in both ends of the beam. This type of loading also causes a lower design moment compared to midspan loading, which will encourage shear failure over flexural failure (Luther, 2005, p. 17). The specimen size and loading points are shown in Figure 3.1
Figure 3.1: Specimen Size and Loading Position (Figure adopted form Luther, 2005)
3.2 Preliminary Design
Figure 3.3: Cross Section of the Design Specimen (Figure adopted form Luther, 2005)
Reinforcement details are shown in Figure 3.3. R6 bars were used for the ligatures, with a spacing of 180 mm. Three shear ligatures were present in the within the shear spans tested
For this testing, the model beams needed to be designed as both a reinforced beam, and a post-tensioned beam. AS 3600 prediction equations have been used in determining the flexural and shear strength of both the reinforced and post-tensioned concrete beam.
3.2.1 Design of Reinforced Beam
3.2.2 Flexural Capacity
The flexural capacity of the specimens is calculated to ensure the mode is shear failure rather than flexural. The calculations below were used to determine the flexural capacity of the member.
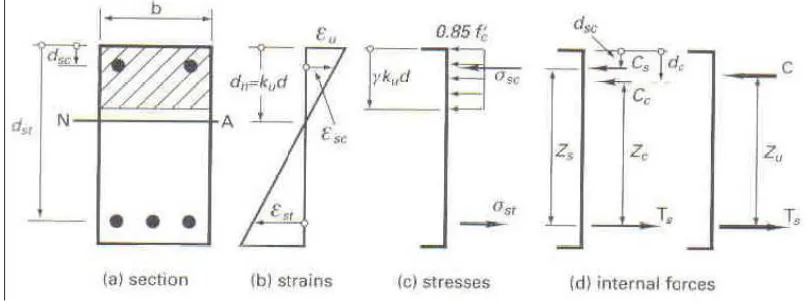
[image:28.595.94.499.393.545.2]In a doubly reinforced section at ultimate moment capacity, the resultant tensile force in the bottom steel, Ts, is equal to the compressive force in the concrete, Cc, plus the compressive force in the top steel, Cs (Luther 2005, p 20). Once the forces and their points of action are known, the moment capacity can be found by taking moments about the bottom tensile steel (Luther 2005, p 20). The internal strains, stresses, and forces in the section are shown in Figure 4.4, and the calculations to find the specimen’s flexural capacity are shown below.
Figure 3.3: Doubly Reinforced Section at Ultimate Moment (Source: Warner et al, 1998)
Section Properties
) 28 ' ( 007 . 0 85 .
0 − −
= f c
γ
=0.85−0.007(32−28) = 0.822
Reinforcing Properties
fsy = 500MPa
Depth to compression steel:
dsc= + + =
2 16 6
25 39mm
Depth to tensile steel:
d= − − − =
2 24 6 25
300 257mm
Area of compression steel:
Asc = 400mm2
Area of tensile steel:
Ast = 900mm2
Initially assume all reinforcement yields before Mu, therefore; Tensile steel force:
T s= fsy.Ast
Compression steel force:
Cs = fsy.Ast =500×400 =200×103
Concrete compressive force:
Cc =0.85.f'c.b.do.γ
= 0.85×32×0.822×do
= 3353.76do
As the sum of the forces equals zero:
3353.76 +200×103 =450×103 n
d
mm dn =74.5
Checking the compressive reinforcement has yielded:
⎟⎟ ⎠ ⎞ ⎜⎜ ⎝ ⎛ − = n sc n c st d d d ε ε = ⎟ ⎠ ⎞ ⎜ ⎝ ⎛ − × 5 . 74 39 5 . 74 003 . 0 =0.0014
sc st u dc st u u s
s k d A
d d k E C ⎟⎟ ⎠ ⎞ ⎜⎜ ⎝ ⎛ − = . . .ε
By equating the sum of the forces to zero, the neutral axis depth is found using a quadratic equation to find ku:
0
. 2
1
2 + − =
u k u ku u
Where, st st sy sc s n d b c f A f A E u . . . ' 85 . 0 . . . 1 γ ε − = 2 2 . . . ' 85 . 0 . . . st st s dc n d b c f A E d u γ ε = Therefore, 257 150 822 . 0 32 85 . 0 900 500 400 10 200 003 . 0 3
1 × × × ×
× − × × × = u = -0.245 2 3 2 257 150 822 . 0 32 85 . 0 400 10 200 39 003 . 0 × × × × × × × × = u = 0.0425
0 0425 . 0 245 . 0
2 − × − =
u
u k
k
Solving the quadratic equation:
a ac b b ku 2 4 2− ± − = 1 2 0425 . 0 1 4 ) 245 . 0 ( 245 . 0 2 × × × − − ± u k 362 . 0
= or -0.117
Taking the positive value:
ku = 0.362
Therefore, the neutral axis depth:
d k dn = u.
257 362 . 0 × = n d mm dn =93.1
The force in the tensile steel is the same as previously, but the compressive forces in the concrete and compressive reinforcement need to be recalculated.
Tensile steel force:
Compression steel force: 400 257 362 . 0 39 257 362 . 0 003 . 0 10
200 3 ⎟
⎠ ⎞ ⎜ ⎝ ⎛ × − × × × = s C
= 140191 N
Concrete compressive force:
o
c d
C =3353.76 = 312498 N
Therefore, the ultimate moment capacity of the beam:
(
st sc)
c(
st u st)
s
u C d d C d k d
M = − + −0.5γ. .
(
257 39)
312198(
257 0.5 0.822 0.362 257)
140191× − + × − × × ×
=
=98.85 kN.m
The force required to produce the ultimate moment, Mu, is found from:
v M P u α = 1 Where,
P1 = Distance between the support and loading point
α = Load from one loading point
75 . 0 85 . 98 = P = 131.8kN
As four point loading is used, the ultimate flexural load capacity of the beam, Pu.f, is calculated as:
1
. 2 P
Pu f = ×
= 2*131.8 = 263.8kN
3.2.3 Shear Capacity
The ultimate shear capacity, Vu, of the reinforced concrete beam is determined in this section.
Vu = Vuc +V s
The ultimate shear strength of the concrete, Vuc, is:
3 1 3 2 1 . ' . . . . . . ⎟⎟ ⎠ ⎞ ⎜⎜ ⎝ ⎛ = o v st o v uc d b c f A d b V β β β
Where, 1 . 1 1000 6 . 1 1 . 1 0
1 ⎟≥
⎠ ⎞ ⎜ ⎝ ⎛ − × = d β 1 . 1 1000 257 6 . 1 1 .
1 ⎟≥
= 1.48
1
1 =
β (as there is no axial load present)
1 3 = β Therefore, 3 1 257 150 32 900 257 150 1 1 48 . 1 ⎟ ⎠ ⎞ ⎜ ⎝ ⎛ × × × × × × × = uc V
= 51.77 kN
The ultimate shear strength of the shear reinforcement, Vus, is:
v f sy sv us s d f A
V . . . 0 ⎟⎟cotθ
⎠ ⎞ ⎜⎜ ⎝ ⎛ = Where, ⎟⎟ ⎠ ⎞ ⎜⎜ ⎝ ⎛ − − + = min . max . min . 15 30 sv sv sv sv o o v A A A A θ Where, sv
A = cross sectional area of shear reinforcement =2×π×32
min . sv
A = cross sectional area of minimum shear reinforcement
f sy v f s b . . 35 . 0 = = 5 . 52 150 150 35 .
0 × ×
= 42mm2
Asv..max = cross sectional area o f maximum shear reinforcement
= f sy st v uc v f d b V c f s b . . ' 2 . 0 . ⎟⎟ ⎠ ⎞ ⎜⎜ ⎝ ⎛ − = 250 257 150 51770 32 2 . 0 150 150 ⎟ ⎠ ⎞ ⎜ ⎝ ⎛ × − × × ×
= 606.9mm2
Therefore, ⎟ ⎠ ⎞ ⎜ ⎝ ⎛ − − + = 42 9 . 606 42 5 . 56 15 30o o v
θ
= 30.04o
(
30.04)
cot 150
257 250 5 . 56
⎟ ⎠ ⎞ ⎜
⎝
⎛ × ×
= us
V
= 30.1kN
Calculating the reinforced concrete beam’s ultimate shear capacity:
us uc
u V V
V = +
=51.77 + 34.87 = 86.64 kN
As four point loading is used, the ultimate shear capacity load, Pu.s, is calculated as:
× =2
.s u
P 82.8
= 173.28 kN
The beam’s shear capacity load, Pu.s (173.28kN) is lower than the beam’s flexural
capacity load Pu.f(263.6kN), so the beam should fail in shear.
3.3 Design of Externally Post-tensioned Beam
The ultimate moment capacity, Mu, and the shear capacity, Vu, for the design specimen after post-tensioning are calculated in this section.
3.3.1 Selection of Post-tension Force
The eccentricity of the force was chosen to maximise the effectiveness of the post-tensioning, but was kept within the middle third of the section to ensure no tensile stresses were induced on the top face of the beams due to the post-tensioning (Luther 2005, p 27). The positioning of the post-tensioning rods can be seen in Figure 3.5.
Figure 3.4: Positioning of Post-tensioning Bars (Figure adopted form Luther, 2005)
The post tensioning rods were sourced form USQ. The available post-tensioning rods were 26mm high tensile Maceloy bars. The post tensioning rods were connected to the specimen by 150C10 sections. The 150C10 end plates transfered the post-tension force to the beams.
3.3.2 Flexural Capacity
The flexural capacity of the beam after post-tensioning needs to be less than the beam’s shear capacity after post-tensioning. The calculations for the beam’s flexural capacity after post-tensioning are shown below. The parameters of the initial post-tensioning are: Post-tensioning force:
Depth to post-tensioning steel:
mm do =200
Area of post-tensioning steel:
4 2 2 D Apt π × = 4 26 2 2 × × = π
= 1061.9mm2
Effective post-tensioning stress:
pt ef p A F = . σ 9 . 1061 10 150× 3 =
= 141.3MPa
To find the stress in the post-tensioning rods, Clause 8.1.6 of AS3600 is used. For a beam with a span-to-depth ratio of less than 35 (2000/300 = 6.67), the ultimate stress
in the rods is:
400 . 100 . . ' 70 . . ⎟⎟≤ + ⎠ ⎞ ⎜ ⎜ ⎝ ⎛ + +
= pef
pt p ef ef p pu A d b c f σ σ σ 400 3 . 141 9 . 1061 100 200 150 32 70 3 .
141 ⎟≤ +
=220.3 MPa
The flexural capacity of the post-tensioned beam is calculated in a similar way as for the reinforced beam, except the tensile force of the post-tensioning rods is added to the balancing equation.
Initially assume all reinforcement yields before Mu, therefore;
Tensile steel force:
T s= fsy.Ast
= 500×900 = 450×103N
Compression steel force:
Cs = fsy.Ast =500×400 =200×103
Concrete compressive force:
Cc = 0.85.f'c.b.dn.γ = 0.85×32×0.822×dn
= 3353.76dn
o d
Post-tensioning steel tensile force:
pt pu
p A
=220.3×1061.9
=22393N
As the sum of the forces equals zero:
233930 10 150 10 200 76 .
3353 + × 3 = × 3+
n
d
dn =114.3mm
Checking the compressive reinforcement has yielded:
⎟ ⎠ ⎞ ⎜ ⎝ ⎛ − × = 3 . 144 39 3 . 144 003 . 0 sc ε =0.0022
As εsc < 0.0025, the assumption that the compressive reinforcement had yielded is incorrect. The compressive forces will be recalculated knowing the compressive reinforcement is in the elastic range.
Checking the tensile reinforcement has yielded:
As εst < 0.0025, the assumption that the tensile reinforcement had yielded is incorrect. The tensile forces will be recalculated knowing the tensile reinforcement is in the elastic range:
st st s
p E A
T = .ε .
As εst is dependent on the neutral axis depth, dn, the forces will be solved by trial and error knowing both the compressive and tensile reinforcement are in the elastic range.
From the trial and error, dn =143.98mm
The strains equal:
⎟ ⎠ ⎞ ⎜ ⎝ ⎛ − × = 98 . 143 39 98 . 143 003 . 0 sc ε =0.002187 ⎟ ⎠ ⎞ ⎜ ⎝ ⎛ − × = 98 . 143 98 . 143 257 003 . 0 st ε =0.002355
The forces equal:
sc sc s
s E A
C = .ε .
= 174960 N
n
c f c bd
C =0.85 ' .γ. .
=0.85×32×0.822×150×143.98
=482874N
st st s
s E A
T = .ε .
=200×103×0.002355×900
= 423900 N
pt pu
p A
T =σ .
=220.3×1061.9
=233930N
Therefore, taking moments about the tensile reinforcement, the ultimate moment capacity is: ) ( ) ' 5 . 0 ( )
( st dc c st n p st p
s d d C d d T d d
C
M = − + = γ − −
) 200 257 ( 233930 ) 98 . 143 822 . 0 5 . 0 257 ( 482874 ) 39 257 (
174960× − + × − × × − × −
=
= 120.33kN.m
75 . 0 33 . 120 2 .f = ×
Pu
=320.9kN.m
3.3.3 Shear Capacity
The ultimate shear capacity, Vu, of the post-tensioned beam is again determined from:
Vu = Vuc +Vus
The ultimate shear strength of the shear reinforcement, Vus, is as for the reinforced concrete beam, but the ultimate shear strength of the concrete, Vuc, is:
v o o v pt st o v
uc V P
d b c f A A d b
V ⎟⎟ + +
⎠ ⎞ ⎜⎜ ⎝ ⎛ + = 3 1 3 2 1 . ' ) ( . . . . .β β
β Where, c f d bv, o ' ,
, , 2 3
1 β β
β and Ast are the same as for the reinforced beam
Pv = 0, as the post-tensioning rods are horizontal
Vo = the shear force which would occur at the section when the bending moment at the section was equal to the decompression moment (Mo)
⎟⎟ ⎠ ⎞ ⎜⎜ ⎝ ⎛ = * * 0 V M M
for simply supported conditions, where M* and V* are the
b g g b g o y I I y e P A P
M ⎟⎟
⎠ ⎞ ⎜ ⎜ ⎝ ⎛ + = . . Where,
P = post-tensioning force = 150kN
Ag= gross cross-sectional area = b.D
= 150 x 300 = 45000mm2
e = eccentricity from the centroid of the section = 50mm
yb = distance from the centroid to bottom edge = 150mm
Ig = Second moment of area of the uncracked section
⎟⎟ ⎠ ⎞ ⎜⎜ ⎝ ⎛ = 12 3 bD ⎟⎟ ⎠ ⎞ ⎜⎜ ⎝ ⎛ × = 12 300 150 3
=3.375×108mm4
Therefore, the decompression moment is:
⎟ ⎟ ⎟ ⎟ ⎠ ⎞ ⎜ ⎜ ⎜ ⎜ ⎝ ⎛ × = 2 2 tan * * Load Load ort oadandSupp ceBetweenL Dis V M =0.75
Therefore, the shear force where decompression occurs is:
75 . 0 15 0 = V =20 kN
Therefore, the shear force where decompression occurs is:
v o o v pt st o v
uc V P
d b c f A A d b
V ⎟⎟ + +
⎠ ⎞ ⎜⎜ ⎝ ⎛ + = 3 1 3 2 1 . ' ) ( . . . . .β β
β 0 10 40 257 150 32 ) 9 . 1061 900 ( 257 150 1 1 477 .
1 3 3
1 + × + ⎟ ⎠ ⎞ ⎜ ⎝ ⎛ × × + × × × × × = = 106.9kN
Therefore, the ultimate shear capacity of the post-tensioned beam is:
kN Vu 46 . 141 48 . 34 98 . 106 = + =
46 . 141 2
.s = × u
P
= 282.92kN
The tensioned beam’s shear capacity load, Pu.s (282.9.kN) is lower than the post-tensioned beam’s flexural capacity load Pu.f (320.9kN), so the beam again should fail in shear.
3.4 Design Summary
[image:47.595.89.507.336.460.2]The design of the specimens to be used for this testing is shown in Figure 3.8.
Figure 3.5: Specimen Design
The model beams have been designed to ensure they fail in shear over flexure. This has been done for both the reinforced control beam, and the post-tensioned beams.
A summary of the design capacities can be seen in Table 3.1.
Shear Capacity Load, Pu.s (kN)
Flexural Capacity Load, Pu.f (kN)
Reinforced Beam 171.9 263.3 Post-tensioned
Beam
293.3 319.6
[image:47.595.142.455.591.714.2]CHAPTER 4
EXPERIMENTAL METHODOLOGY
4.1 Introduction
This chapter presents the details of the construction and testing processes that were used to undertake the research. A brief description of the materials utilised along with the method in which the specimens were built will be presented in the construction section. The testing section will cover the work that was undertaken in order to obtain the results.
Note: This section of the report has been largely taken form the report of Steven Luther as the methodologies are the same for both research projects.
4.2.1 Formwork
The formwork was constructed by university staff for a previous student research, Steven Luther, and this will be used for this work. The formwork was constructed to have the four beams side by side to minimise the material used (Luther, 2005, p. 36). Three separator boards were used to stabilise the middle formwork ply, until the concrete had been filled on both sides of the ply. The formwork was greased and the edges sealed with silicone before the beams were cast, to ensure they could easily be removed (Luther, 2005, p. 36).
4.2.2 Reinforcement
The N16 compression bars were cut to a length of 2500 mm, to allow 50 mm of space at either end for the ferrules, which were needed to position the end anchorage for the post-tensioning (Luther, 2005, p. 40). The R6 ligatures were cut using bolt cutters, and bent using a jig to suit the required cage. The cage was designed to have 25 mm cover from the outside of the ligatures (Luther, 2005, p. 40).
To ensure a cover of 25 mm, the reinforcement cage was positioned on mortar blocks. These were made five days before casting the beams from a water, cement and sand mix. Each block had a tie wire cast in, so the blocks could also be tied to the cages and used for lateral positioning (Luther, 2005, p. 41).
Four ferrules were secured to the formwork using M10 bolts on either end of each beam, to be used to fasten the end plates during post-tensioning. (Luther, 2005, p. 42).
4.2.3 Pouring the Concrete
The concrete used to construct the test beams was obtained from a local supplier (Wagners). The concrete that was ordered was 32MPa strength, 80mm slump and 20mm nominal aggregate size. The actual properties of the concrete were similar to this, and are shown in Chapter 5.
The concrete was poured straight from the truck, using the slide, into the formwork and manoeuvred using shovels. A vibrator was then used to compact the concrete and to expel any air pockets inside the box (Luther, 2005, p. 41).
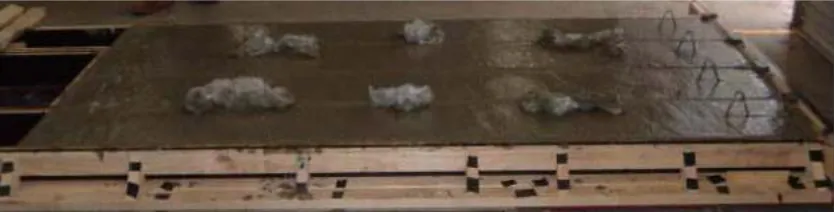
Figure 4.1: Beams after casting (Figure adopted form Luther, 2005)
[image:50.595.240.355.378.550.2]A number of test cylinders were also cast during this stage so as to ascertain the compressive and indirect tensile strengths at particular stages of the concrete’s life. Figure 4.5.2 shows a sample of these cylinders.
Figure 4.2: Test cylinders (Figure adopted form Luther, 2005)
4.2.4 Stripping, curing and movement
cylinders were also removed from their moulds and placed outside next to the beams so as to cure in the same environment
After the 28 day minimum curing period the beams transported to the Instron testing facility located in the Z4 building of the university.
4.2.5 Post-tensioning
This section will explain about the post-tensioning system used for the test beams. It will include the elements involved in the setup, and the process used to tension the beams.
4.2.5.1 Prestressing Rods
4.2.5.2 End Anchorage
[image:52.595.157.440.306.520.2]End anchorage was used to transfer the post-tensioned force in the rods to the beam.. The end anchorage was made up of an 10x150mm C-section, with a 15mm thick high strength steel plate behind it, as shown in Figure 4.11. These bearing plates had small lugs welded on the top and bottom to hold them in position. The C-sections were held in position with four M10 bolts which were screwed into four ferrules that had been cast in each end of the beams. The force from the rods was transferred through high strength nuts to the bearing plates and C-section, then to the beam (Luther, 2005, p.49).
Figure 4.3: Stressing of Rods (Figure adopted form Luther, 2005)
4.2.6 Epoxy Repairing
below, and the data sheets relating to these products are shown in Appendix D (Luther, 2005, p. 50).
4.2.6.1 Lokfix E
Lokfix E is a two part epoxy sealant for use on concrete structures. It is used to give member impermeability, and reduce the chance of reinforcement corrosion. The Lokfix E was obtained in two cartridges connected together, for use with a double barrel corking gun. The cartridges were sized to automatically apply the correct proportions of the two parts of the epoxy. The two parts of the epoxy were mixed together when extruded, using a specially supplied mixing tube that was connected to the end of the cartridges (Luther, 2005, p.50).
Before the sealant was applied, the crack surface was cleaned using a wire brush, and any loose pieces of concrete were removed. Small holes were then drilled along the crack line, and injection nozzles for the Nitofill LV were glued to the concrete over the holes. The holes were needed to allow the Nitofill LV to freely enter the cracks. The Lokfix E was then extruded over the crack lines, and spread over a 5cm strip using a knife. Care was taken to ensure all cracks were covered and a tight seal was obtained around the flange of the nozzles. Figure 4.12 shows the positioning of the injection nozzles, and the sealing of the cracks using the Lokfix E. The sealant was left to dry for four days after it was applied before the Nitofill LV was injected (Luther, 2005, p. 50).
Before the Nitofill LV was injected, the impermeability of the sealant was tested by pressure injecting water into the cracks. Leakage occurred around some of the injection nozzles, so these were repatched with Lokfix E to form an impermeable seal. The beam was then left for a day before the Nitofill LV was injected, to ensure the crack surfaces had dried (Luther, 2005, p. 51).
4.2.6.2 Nitofill LV
Nitofill LV is a two part epoxy resin designed to rebond cracked concrete surfaces. It has very low viscosity, and is therefore ideally suited to being pressure injected into fine cracks (Luther, 2005, p. 51).
The Nitofill LV was obtained in two cartridges connected together, for use with a double barrel corking gun. The cartridges were sized to automatically apply the correct proportions of the two parts of the epoxy. Like the Lokfix E, the two parts of the epoxy were mixed together when extruded, using a specially supplied mixing tube. The end of the tube was attached to the injection nozzles using a connector, and the resin was injected using the corking gun. The injection process started at the lowest most nozzle, with all the nozzles being left open. This was to show when the resin had reached all parts of the crack. As the resin began to flow out of a nozzle, it was then closed. Once only the nozzle being used for injection was open, and the pressure on the corking gun was noticeably higher, the final nozzle where the injection was occurring was closed. The increase in pressure indicated the entire crack had been filled. The Nitofill LV was then left to cure for seven days before the beam was reloaded (Luther, 2005, p. 52).
Before the beam was reloaded, the Lokfix E sealant was removed with a grinder, to allow the initial crack lines to be seen. This was so a comparison of the initial crack lines and the crack formed after repair could be made (Luther, 2005, p. 52).
4.3 Testing Methodology
4.3.1 Introduction
[image:55.595.84.499.267.391.2]This section outlines the experimental testing that was involved in this research. As previously stated, four beams were tested under varying conditions, which can be seen in Table 4.1.
Specimen Preloaded Post-tensioned Epoxy Repaired
B1 No No No B2 Yes Yes No B3 Yes Yes Yes B4 No Yes No Table 4.1: Test Conditions for Specimens
4.3.2 Test Configuration
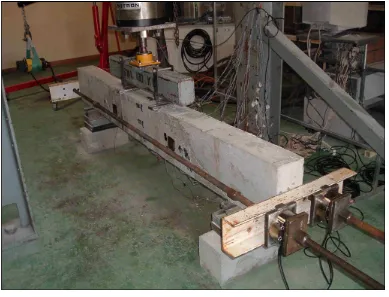
Figure 4.4: Test Configuration (Figure adopted form Luther, 2005)
To simulate pin supports as the beams were modelled for, the supports for the beam were made up of triangular shape steel blocks. A 30mm wide steel plate was positioned on top of each triangular block to avoid local cracking around the support (Luther, 2005, p. 54).
Figure 4.13 show how the beams were tested with four point loading. A single 500kN Instron loading ram, with a maximum travel of 150mm, was used to apply the load. The loading ram was supported by the loading frame, which had been adjusted to the correct height for the test beam setup. The load was transferred evenly to the beam at two points via the spreader beam. The spreader beam was connected to the loading ram with a ball and socket joint, and the two loading points were set 500 mm apart (Luther, 2005, p. 55).
the post-tensioning rods when they were being stressed, as well as when the load was being applied. The data gathered from the load cells was stored by the system 5000 data logger (Luther, 2005, p. 55).
The midspan deflection of the test beams when loaded was measured by a load variable string plot recorder. The data gathered from the string plot was stored by the system 5000 data logger(Luther, 2005, p. 55).
4.4 Data logging
All the data collected from the load cell, strain gauges and string plot during the testing process was recorded by the system 5000 data logger. To do this each of the measuring devices were allocated a channel on the system 5000 data logger, or in this case data loggers due to the amount of channels needed to record all the measuring devices. One channel used for the load cell, one for the string plot. During testing a reading was taken from each of these devices every second (Luther, 2005, p. 56).
4.5 Loading
All of the test beams were loaded at a constant rate of 1 mm per minute using the Instron loading ram. This load rate was achieved by the loading ram being computer controlled (Luther, 2005, p. 56).
4.6 Concrete Compressive Strength Tests
CHAPTER 5
RESULTS AND DUSSCUSSION
5.1. Introduction
This chapter analyses the data that was collected from the experimental work. It provides an overview, of the experimental results that were observed, and attempts to explain the findings. Finally a comparison between the theoretical and experimental capacities can be found at the conclusion of this chapter.
5.2. Material Tests
5.2.1. Concrete Slump Analysis
A slump test was conducted on the mix to gain some indication of the wet concrete’s properties. A slump of 120 mm was determined for the batch. It has been noted that the concrete had been ordered with a slump of 80mm and strength of 32MPa. From slump results it is obvious that the concrete delivered was somewhat different to what was ordered. This concrete was still utilised, however the strengths of the batches were decreased due to the high moisture content.
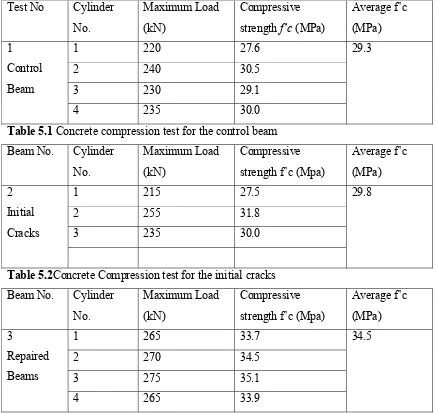
5.2.2. Concrete Compressive Strengths
than the ordered 32 MPa. The testing of the repaired beam occurred at a later stage and hence the concrete strength has increased.
Test No Cylinder No.
Maximum Load (kN)
Compressive strength f’c (MPa)
Average f’c (MPa)
1 220 27.6
2 240 30.5
3 230 29.1
1 Control Beam
4 235 30.0
[image:59.595.81.516.166.579.2]29.3
Table 5.1 Concrete compression test for the control beam Beam No. Cylinder
No.
Maximum Load (kN)
Compressive strength f’c (Mpa)
Average f’c (MPa)
1 215 27.5
2 255 31.8
3 235 30.0
2 Initial Cracks
29.8
Table 5.2Concrete Compression test for the initial cracks Beam No. Cylinder
No.
Maximum Load (kN)
Compressive strength f’c (Mpa)
Average f’c (MPa)
1 265 33.7
2 270 34.5
3 275 35.1
3
Repaired Beams
4 265 33.9
34.5
Table 5.3 Concrete Compression test for the repaired beams
5.3 Crack Observation
5.3.1 Specimen B1 (control beam)
[image:60.595.182.415.347.522.2]The cracking in the control beam formed with a major shear crack propagating from the support to the loading point. The crack started at approximately half-way between the loading points at 108 kN. As the load increased a second shear crack formed above the main crack. The second shear crack appeared at a load of 125 kN. The main crack developed to a spacing of 4 mm while the second stopped at 2 mm. The ultimate shear load was 198 kN for the control beam. Figure 6.4.1 depicts the crack propagation of the control beam.
Figure 5.1 Crack pattern for B1
5.3.2 Specimen B2
second shear crack developed in the shear zone. The initial crack formed in Specimen B2 can be seen in Figure 5.3.
Figure 5.3 Initial shear crack pattern in B2
After preloading Specimen 2 a post-tensioning force was applied without the use of epoxy resin to repair the existing cracks. The applied post-tensioning force was set at 150 kN. Once loading was reapplied the existing cracks began to reopen. At the maximum load of 173 kN, the maximum crack width was 4 mm. The failure crack of the repaired specimen 6 mm can be seen in Figure 6.4.4.
[image:61.595.182.415.527.704.2]5.3.3 Specimen B3
[image:62.595.182.415.365.542.2]Specimen B3 was used to determine the strength that could be regained to a beam with shear cracks being repaired with epoxy injection and strengthened with post-tensioning. Specimen B3 was preloaded to form a shear crack with a maximum width of approximately 4 mm. A load of 181 kN was required to form this crack. The initial shear cracking in the specimen formed in the same way as the previous specimens, with the first shear crack forming at 115 kN. The cracking began in the middle of the beam and propagated towards the loading point as the load was increased. The initial crack formed in Specimen B3 can be seen in Figure 5.5.
Figure 5.5. Initial crack pattern in specimen B3
changed. The cracks opened flatter, more in the longitudinal direction of the beam. The maximum crack width at this point was 7 mm. The failure crack of Specimen B3 can be seen in Figure 5.6.
Figure 5.6 Crack pattern in specimen B3.
5.3.4 Specimen B4
Figure 5.7 Crack pattern in specimen B4.
5.3.5 Comparison of Crack Patterns
In all specimens, the first crack always appeared as a flexural crack at the midpoint of the beam where the maximum bending moment is present. Under 60–70% of failure load, these cracks in the shear span were inclined and propagated toward the loading points. External post-tensioning, which were used to strengthen and repair the beams, successfully controlled the size of the cracks propagated in the beams, although with out epoxy injection, the major diagonal shear cracks reopened. Hence no new shear cracks. The use of epoxy injection successfully repaired the shear cracks. This is evident in specimen 3 where the cracks where repaired with epoxy resin. The development of new shear cracks appeared while the repaired cracks remained intact.
5.4 Load – Deflection Characteristics
in stiffness, as can be seen by the different slope on the plot below. In this section yielding may occur and the reinforcement will then go on to fail if the load is increased. Conversely, if the concrete begins to fail before the steel yields, a brittle failure will be observed.
5.4.1. Specimen S1
Beam 1
-50 0 50 100 150 200 250
-2 0 2 4 6 8 10 12 14 16
Deflection (mm)
Loa
d
(
kN
[image:65.595.92.508.249.566.2])
Figure 5.8 Load-deflection plot of Specimen B1
the specimen no longer deforms with an increase in load. Once the cracks become large enough that the member cannot withstand the applied load, the specimen fails. In the plot above this occurs at approximately 189kN and 14.8 mm of deflection.
5.4.2 Specimen S2
Beam 2
-50 0 50 100 150 200 250
-2 0 2 4 6 8 10 12 14
Deflection (mm)
Lo
ad
(
kN
)
[image:66.595.90.507.202.524.2]After Post-Tensioning Pre-Loading
Figure 5.9 Load-deflection plot of Specimen B2
Figure 5.9 shows the load versus deflection graph for the post-tensioned repair beam. The preloading of Specimen B2 shows similar behaviour to Specimen B1. The preloading was taken to 204 kN, with 12.85m deflection.
This has been explained by Luther, 2005 his research describes an important factor is the angle of the shear cracks relative to the post-tensioning force. As the cracks are on an angle of approximately 30 degrees, part of the post-tensioning force is actually causing the crack faces to slide against each other, instead of forcing them together. This reduces the concrete component of the shear strength for the beam, leaving the load to be predominantly taken by the shear ligatures.
This shows that post-tensioning alone will not increase a beam’s shear strength if it has existing shear cracks. The loading was stopped at.12.21 mm deflection, as the beam had obviously failed.
5.4.3 Specimen B3
Beam 3
-50 0 50 100 150 200 250 300 350
-5 0 5 10 15 20
Deflection (mm)
Loa
d (
kN
)
[image:67.595.89.508.372.650.2]After expoy injection and post tensioning Preloading Figure 5.10 Load-deflection plot of Specimen B3
shape up until 115 kN load, when the shear cracks began to form. The preloading was taken to 181 kN, with 11.53 mm deflection.
The beam had its shear cracks repaired with epoxy injection, and was then post tensioned. The first shear cracks formed in the repaired beam at 230 kN. This is evident on the graph by the end of the linear section of load versus deflection. The slope of the graph after this point is much flatter, as the load is predominantly being taken by the ligatures. The maximum load taken by the beam was 310 kN at 13.84 mm deflection. This is a 58% increase in strength from the reinforced control beam. The sharp drop in load after the maximum is due to a sudden shear-compression failure occurring. After this occurred, almost the entire load of 162 kN was being taken by the ligatures.
5.4.4 Specimen B4
Beam 4
-50 0 50 100 150 200 250 300 350
-2 0 2 4 6 8 10 12 14 16 18
Deflection (mm)
Loa
d (
kN
[image:68.595.92.508.381.700.2])
The load versus deflection graph for the post-tensioned control beam, Specimen B4, is shown in Figure 5.12. The beam was post-tensioned before loading, and was then loaded until failure. The post-tensioning caused the beam to deflect upwards by 0.38 mm. The graph shows a linear shape up until 180 kN load, when the shear cracks began to form. The slope of the graph is then flatter up until the maximum load of 354 kN. This load is 81% higher than for the reinforced control beam. The sharp drop in load after the maximum is again due to a sudden shear-compression failure occurring. This behaviour is very similar to that exhibited by Specimen B3.
5.5 Comparison of Load – Deflection Characteristics
5.6 Increases in External Post-tension Force
The applied prestressing force increased as beams were loaded. This increase can be explained by when the beams were loaded and began to deflect, the tension side of the beam increased in length. This caused the post-tensioning rods to also increase in length, which therefore increased the force in the rods. Figure 5.32 shows the increase in post-tension force as the beams have been loaded. Note that the deflection shown is the deflection from when the post-tensioned beam has begun loading.
Increase in Post-tension Force vs Deflection
0 50 100 150 200 250 300
0 2 4 6 8 10 12 14 16 18 20
Deflection (mm)
P
o
st-t
en
si
o
n
F
o
rce
(kN
)
[image:70.595.92.509.288.554.2]Specimen B2 Specimen B3 Specimen B4
Figure 5.12: Increase in Post-tension Force as the Beams are Loaded