1
A Comparison of Learning Preferences and Perceptions of Students for
Statistics Concepts and Techniques
MEHRYAR NOORIAFSHAR [email protected]
TEK NARAYAN MARASENI [email protected]
University of Southern Queensland, Toowoomba, Australia
Abstract
This paper is an extension of a comparative study on learning style and method preference of students from culturally different parts of the world. The first sample (TMB) was selected from the undergraduate students in the University of Southern Queensland in the Darling Downs region of Queensland in Australia and the second sample (KTM) was selected from the same level of students in Apex College, Kathmandu, Nepal. Although both groups of students possess similar characteristics in terms of topic and level, they have been exposed to different cultural and country backgrounds. The findings however, appear to be very similar in terms of both groups of students’ in all research questions including learning styles and methods preferences. It is interesting to note that both groups have indicated their high preference for more visually oriented teaching materials in Statistics. The study has also demonstrated that the country and cultural differences do not play a significant role in students’ preferences for learning methods. Both groups of students have indicated their preference for learning the concepts first and then finding out about the applications.
Key words: Mathematics, Education, Learning Style, Cultural Background
Introduction
Whether we choose to adopt the latest technology or maintain the traditional "chalk and talk" methods of teaching, we must bear in mind that we need to make teaching of statistics as interesting as possible for our students. There is no doubt that the misunderstood image of statistics as a dry subject should be re-built in the 21st century.
As suggested by Kettenring (1997) in a presentation entitled "Shaping Statistics for Success in the 21st Century" to the American Statistical Association back in 1997, image reconstruction of the field of statistics must be placed right at the top of the list.
College, Kathmandu, Nepal. Both groups of students were studying similar subjects related to Statistics. It should be noted that culturally driven factors such as parental encouragement or even pressure in some cases would also play a role in shaping and influencing students’ attitudes and aspirations. For instance, statistics/mathematics, in general, is regarded by the majority of the Nepalese parents as a topic which will help their children with their future studies and profession. Hence, traditionally, in a society like Nepal, graduate students would be encouraged to excel in learning statistics and related topics by both parents and teachers.
The objectives of this paper are to compare and contrast the two groups in terms of:
• their learning style (modal) preferences; and • their preferred method of learning.
For an introduction to modal preferences refer to Fleming (1995).
In order to achieve these objectives, a questionnaire was developed and used as the data collection instrument. This questionnaire contained questions on the following categories:
• students’ background;
• students’ learning preferences; and • students’ future goals and aspirations.
3 Analysis of Students’ Perceptions and Characteristics
The following sections provide analysis and discussion on a number of key questions presented to the students:
Enjoy learning Mathematics – Eighty five percent of the total students regard mathematics as an enjoyable subject. Only 15 percent of the total students claim that mathematics is not an enjoyable subject. See Table 1 for details. Students from Kathmandu (86.7%) appear to enjoy learning mathematics more than their Australian (80%) counterparts. However, the Chi-Square test shows that there is no significance difference between the two groups of students regarding the perception on enjoyment of learning mathematics (Chi-Square 2.22, p=0.329).
Table 1: Do you regard mathematics an enjoyable subject?
Group
TMB KTM Total
Count 4 8 12
Not an enjoyable
subject % within Group 20.0% 13.3% 15.0%
Count 16 52 68
Mathematics an enjoyable
subject? An enjoyable
subject % within Group 80.0% 86.7% 85%
Count 20 60 80
Total
% within Group 100.0% 100.0% 100.0% Chi-Square 2.22 (p=0.329)
The analysis of the perception of the high school students on the same matter by the authors indicated that only about 65 percent of the total students regarded mathematics as an enjoyable subject. Moreover, there was a significant difference on perception between the two groups of students (Australian and Iranian students). Further investigation and comparison of the university students’ results with the high school students have revealed that:
Firstly, as the level of education goes up the homogeneity on the enjoyment perception by the students also increases. This is because there was no significance difference (Chi-Square 2.22, p=0.329) on perception between the university students in two different parts of the world.
Secondly, the percentage of students saying ‘mathematics is an enjoyable subject’ increases with level of study. That is, the more they incline towards higher education the more they enjoy mathematics. This may be because of the choices made towards specialization and narrowing down of their career options.
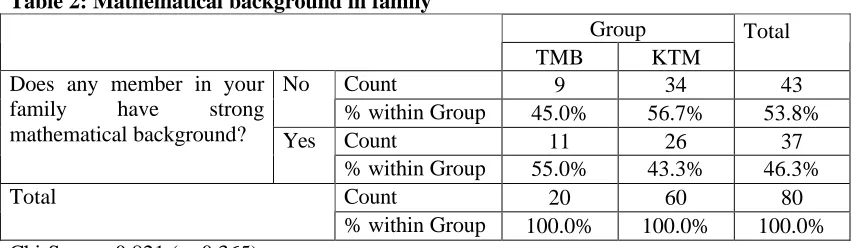
Table 2: Mathematical background in family
Group
TMB KTM
Total
Count 9 34 43
No
% within Group 45.0% 56.7% 53.8%
Count 11 26 37
Does any member in your family have strong mathematical background?
Yes % within Group 55.0% 43.3% 46.3%
Count 20 60 80
Total
% within Group 100.0% 100.0% 100.0%
Chi-Square0.821 (p=0.365)
The family background of the HSS study had found that approximately 48 percent of the total students had a member with a strong mathematical background in their families. The Chi-squire test had indicated that there was no significant difference between the Iranian and Australian High School students with respect to family background in mathematics. That result has now been independently verified by the university students (from different parts of the world) too. Hence, it can be concluded that regardless of the geographical location the family background has no strong influence on different levels of education
Practical uses - About 51 percent of the total students (both groups) believe that the practical use of statistics is ‘high’ and another 38 percent believe that it is very high. The percentage of students in both of these categories (sum of high and very high) is the same (90%) for the Kathmandu and Australian groups. The Chi-square test has shown that there is no significant difference between the two groups of students in terms of their perception of practical uses of statistics (Chi-Square 0.170, p=0.919). Hence, both groups of university students believe that the chances of having practical applications for Statistics for them are high.
Table 3: Perception on practical use of statistics
Group
TMB KTM Total
Count 2 6 8
Low
% within Group 10.0% 10.0% 10.0%
Count 11 30 41
High
% within Group 55.0% 50.0% 51.3%
Count 7 24 31
Practical use of statistics
Very high
% within Group 35.0% 40.0% 38.8%
Count 20 60 80
Total
% within Group 100.0% 100.0% 100.0% Chi-Square0.170 (p=0.919)
According to the HSS study almost 80 percent of the total students (both Iranian and Australian) believed that the practical use of statistics was ‘high’ and ‘very high’. However, the Chi-square test had shown that there was a significant difference between the two groups of students. Again two things are apparent from the comparison of the results of university and high school level students:
(Chi-5 Square 2.22, p=0.329) on ‘perception of practical use of statistics’ between the university level students in two different corners of the world.
Secondly, the percentage of the students seeing the greater practical use of statistics increases according to their level of education. This may be the reason why they chose statistics for their higher degree.
Future profession - As Table 4 shows, almost 54 percent of the total students (both groups) believe that their future profession will be related to the field of statistics. The proportion (51.7%) of Kathmandu students who see some connection with and reliance on Statistics in their future is slightly lower than the proportion (60%) of the Australian students. However, Chi-Square test has demonstrated that there is no significant difference between the two groups of students in terms of their perception of the future profession in statistic (Chi-Square 0.427, p=0.808).
Table 4: Future profession in statistics
Group
TMB KTM Total
Count 1 4 5
No
% within Group 5.0% 6.7% 6.3%
Count 7 25 32
Not sure
% within Group 35.0% 41.7% 40.0%
Count 12 31 43
Your future profession will be related to statistics?
Yes
% within Group 60.0% 51.7% 53.8%
Count 20 60 80
Total
% within Group 100.0% 100.0% 100.0% Chi-Square 0.427 (p=0.808)
Based on the HSS study, the authors had found that only 25 percent of the total students believed that their future profession would be related to the field of statistics. Moreover, the Chi-Square test had demonstrated that there was a significant difference between the two groups (Iranian and Australian) of students in terms of their perception of the future profession in statistics. Again the two similar findings as described above are obvious from the comparison of the results of university and high school levels students:
Firstly, homogeneity on perception by students is greater as the education level increases and tends towards a specialization. This is due to the fact that there was no significance difference (Chi-Square 0.427, p=0.808) on ‘future profession’ between the university students in two different culturally and linguistically different countries (Katmandu and Australia) of the world.
Objectives
Preferred learning style
It is notable that the learning style preferences of both groups of students are similar. Very low percentage (10 percent) of the total students prefers ‘self reading and then asking questions’ approach. Both groups prefer the learning style which uses graphs, pictures, images etc. In total, 80 percent of students have a preference for visual learning (Table 5). Most interesting thing is that the proportion of students who prefer this style is exactly the same (80%) in both countries. Although the proportion of ‘verbal explanation learning model’ preference in Australia (15% Vs 8.3%) and ‘self reading and asking model’ preference in Nepal (11.7% Vs 5%) is greater than their respective counter part, the Chi-Square test suggests that there is no significant difference in learning style preferences of two groups at 95 percent confidence level (Chi-Square 1.333, p=0.513). This demonstrates that regardless of country or cultural background, students have a preference for visual features in learning. Similar conclusion was drawn by Nooriafshar et al. (2004).
Table 5: Comparison of learning style preferences of two groups of student Group
TMB KTM Total
Count 3 5 8
Verbal
explanation % within Group 15.0% 8.3% 10.0%
Count 16 48 64
Using graphs, pictures, images etc
% within Group 80.0% 80.0% 80.0%
Count 1 7 8
Preference in learning approaches
Self-reading and
asking % within Group 5.0% 11.7% 10.0%
Count 20 60 80
Total
% within Group 100.0% 100.0% 100.0% Chi-Square1.333 (p=0.513)
Investigation into the learning style preference of the high school students by the authors, had found that only around 59 percent of students had a preference for a learning style which uses graphs, pictures, images etc. In the university students’ study this percentage has increased to 80 percent. The Chi-Square test however, in both university level and high school level comparisons, has suggested that there is no significant difference in learning style preferences of either of the two groups (University students of Australia Vs University students of Nepal and High School students of Australia Vs High School students of Iran). This demonstrates that students’ preference for visual features in learning increases with their level of education.
Preferred learning method
7 percent of the Nepalese students prefer learning the ‘application first and then the concept’ (Table 6). Although the preference for learning methods between the two groups of students seems almost the same (in figures and numbers) a Chi-Square test for statistical accuracy was performed. This test has shown that there is no statistically significant difference between them even at 12 percent confidence level (Chi-Square 0.018, p=0.893). This test has, statistically, verified the strong similarity on learning method preference between the students of two different countries.
The test outcome has demonstrated that the country and cultural differences do not play a significant role in students’ preferences for learning methods. This finding has important implication in teaching practices. For instance, as a productive and effective teaching approach, we may consider presenting concept first for the theoretical foundation, and then the examples for broader applications. It would be reasonable to assume that if students knew the in-depth concept and theory well then they would be in a good position to explore applications of the theory.
Table 6: Comparison of preferred learning methods of two groups of student Group Total
TMB KTM
Count 7 22 29
First application and then
concept % within Group 35.0% 36.7% 36.3%
Count 13 38 51
Preferred learning method?
First concept and then
application % within Group 65.0% 63.3% 63.8%
Count 20 60 80
Total
% within Group 100.0% 100.0% 100.0%
Chi-Square 0.018 (p=0.893)
The HSS study had found that approximately 57 percent of the total students (Australian and Iranian) preferred practical examples before learning the concept. However, the university students’ study has shown that the preference is for learning the concept before finding out about the application. This finding illustrates that students at a higher level expect to equip themselves with solid theoretical foundation before putting things into practice.
Conclusions
The perceptions of the university students, from two different parts of the world (University of Southern Queensland, Australia and Apex College, Kathmandu) were compared on the following six different research questions:
1. Is mathematics an enjoyable subject?
2. Does anybody in your family have strong mathematical background? 3. How do you find the practical use of statistics?
4. Will your future profession be related to statistics? 5. What is your preferred learning style?
6. What is your preferred learning method?
in perceptions between two groups of students in all research questions. Further analysis and investigation into the research findings of the high school students from two different parts of the world (Iran and Australia) and the university students’ study has revealed the following four findings:
Firstly, as the level of education goes higher the percentage of students regarding mathematics/statistics ‘an enjoyable subject’ with high practical and relevance to the future profession also increases.
Secondly, as we move from the high school level towards the university level the more homogenous the perception between two counterparts (respective groups) of students becomes. This finding has been confirmed by the statistical tests. It is noteworthy to mention that unlike the HSS study the university students’ study on comparison of the perceptions on research questions has revealed that there are no statistically significant relationships in all cases.
Thirdly, regardless of country or cultural background students have a preference for visual features in learning. This finding indicates that learning via multimedia, with interactive animations, appears to be an attractive approach. The use of memory handles and prompters such as analogies and anecdotes will make teaching and learning much more enjoyable for both the teacher and students. These prompters can help the learners to visualize both actual and virtual images of scenarios and situations and then link them with the content concepts. For a few examples, see Chanter (n.d.), Friedman; Halpern and Salb (1999); Nooriafshar (2001) and Nooriafshar et al. (2004).
Fourthly, the test outcome also demonstrates that the country and cultural differences do not play a significant role in students’ preferences for learning methods. It is interesting to note that unlike the high school students, the university students prefer learning the concepts first and then find out about the application. This is expected as at a higher level, students are interested in being able to build a theoretical foundation prior to application. This method makes students more creative, analytical and also helps them to maintain long lasting memory.
The most important conclusion of this research is that regardless of the geographical location and cultural background, students’ preferences in terms of ‘learning method’ and ‘style’ are similar. In fact, the level and degree of education accelerates such preferences. This conclusion has significant implications for the course designers, teachers, and all stakeholders regardless of their status or location.
References
Chanter D.O.,(n.d.), Some Anecdotes and Analogies for Illustrating Statistical Ideas, Retrieved July 2 2004 from
http://science.ntu.ac.uk/rsscse/ts/bts/chanter/text.html.
9 Friedman, H., Halpern, N.and Salb, D. (1999), 'Teaching Statistics Using Humorous
Anecdotes', Mathematics Teacher, Vol. 92, Issue 4, p305, 4p.
Kettenring, J. (1997), 'Shaping statistics for success in the 21st century', Journal of the American Statistical Association, Vol. 92, Issue 440, p1229, 6p.
Nooriafshar, M. (2001), 'Teaching Non-Parametric Statistics to Students from a Non- Mathematical Background', International Journal for Mathematics Teaching and Learning, September Issue.
Nooriafshar M., Williams R., Maraseni T.N. (2004), “The Use of Virtual Reality in Education”, The American Society of Business and Behavioral Sciences (ASBBS) 2004 Seventh Annual International Conference, Cairns, Queensland, Australia, 6th-8th August.
Nooriafshar M., Maraseni T.N. (2004), “A Comparison of Learning Preferences and Perceptions of High School Students for Statistics”, Proceedings of the Hawaii International Conference on Statistics, Mathematics and Related Fields, Honolulu, Hawaii, USA, 9th-11th January.