VARIATIONS IN SOLAR ERYTHEMAL
ULTRAVIOLET OCCUPATIONAL EXPOSURE
DUE TO DAYLIGHT SAVING TIME IN AUSTRALIA
A.V. Parisi
1,*, M.G. Kimlin
1, J.S. Mainstone
11
Centre for Astronomy and Atmospheric Research, University of Southern Queensland, Toowoomba, 4350, Australia. Ph: 61 7 46 312226. FAX: 61 7 46 312721. Email: [email protected]
*
To whom correspondence should be addressed
Complete Published Citation: Parisi, Alfio and Kimlin, M.G. and Mainstone, J.S. (1999) Variations
in solar erythemal ultraviolet occupational exposure due to daylight saving time in Australia.
Radiation Protection in Australasia, 16 (3). pp. 13-20. This copy accessed from USQ ePrints http://eprints.usq.edu.au
ABSTRACT
This paper presents the variations in the solar erythemal ultraviolet (UV) exposure during work hours due to daylight saving time in Australia. The differences in the exposures to workers on AEST (Australian Eastern Standard Time) and AEDT (Australian Eastern Daylight Time) are dependent on the meal break times and the morning and afternoon tea break times. There were both increases and decreases in the erythemal UV exposures to the workers. For the shoulder of workers outside between 07:00 and 17:00 who take a meal break out of the sun, the largest decrease provided by switching to AEDT was 118 MED (minimum erythemal dose) over the five month period for the 12:30 to 13:30 AEST break time. In comparison, the maximum increase for the shoulder was 29 MED for the 11:00 to 12:00 AEDT break time. For indoor workers who spend a meal break outdoors, the maximum increase was by 49 MED over the five months on a horizontal plane for the 12:30 to 13:30 AEST break by converting to AEDT. In comparison, for the 11:00 to 12:00 AEST meal break time, the erythemal exposure was decreased by 58 MED by converting to AEDT. The results are also applicable to locations that are west of the coastal cities where the sunrise and sunset times are later.
Keywords: UV; non-ionizing; solar; daylight saving; ultraviolet radiation
INTRODUCTION
Solar ultraviolet (UV) related disorders are a serious human health problem, with Australia having the highest incidence rates of skin cancer in the world. Queensland has the highest skin cancer incidence rates of the Australian states. Additionally, premature skin ageing has been observed(1) in a Queensland population, with a significant percentage of the under 30 year olds displaying moderate to severe ageing. UV exposure has also been associated with adverse effects on the eye, for example cataracts(2). In Queensland, there are high ambient solar UV irradiances(3,4). Additionally, at some latitudes, there have been substantial increases in peak UV radiation due to ozone losses. For example, at a site in New Zealand (45 oS), a 12% increase in the peak sunburning UV in the 1998/99 summer was measured compared to the first years of the decade(5). Larger increases were measured for DNA-damaging UV. There have also been downward trends measured in the total ozone between 60 oN and 60 oS(6). As a result, solar UV exposure is a major public health problem, with the necessity to minimise solar UV exposure. Sun exposure can be reduced by the combined UV prevention strategies of sunscreen, clothing, hat, sunglasses and spending less time outdoors(7). Additionally, solar UV exposure can be reduced by altering the times of the day spent outdoors(8,9).
of the year. This paper considers the effect of daylight saving time on the occupational UV exposure of the population.
MATERIALS AND METHODS
Human UV Exposure
Daylight saving started for the 1998/99 season in New South Wales and Victoria at 2 am on 25 October 1998, and is referred to as AEDT (Australian Eastern Daylight Time). The end of daylight saving came at 3 am on 28 March 1999. On the other hand, Queensland remained on Australian Eastern Standard Time (AEST) which was one hour behind. In this paper, the effect on the occupational UV exposures of workers in Queensland, with that state remaining on AEST rather than changing to AEDT, will be considered. Additionally, the differences in the occupational UV exposures of workers near the New South Wales - Queensland border with the respective AEDT and AEST times will be investigated.
The erythemal UV exposures over the five months were calculated using a model described elsewhere(12,13), as follows:
∑
∑
==
23 0)
(
.
).
(
)
(
h m eryPF
h
FO
ER
h
AE
m
N
UV
(1)where AE is the ambient erythemal UV exposure on a horizontal plane, ER is the exposure ratio or the proportion of the UV exposure to a specific body site compared to the ambient exposure, FO is the activity index or the fraction of the time that a person spends outdoors, PF is the protection factor or reduction of exposure provided by a UV protective strategy, h is the hour of the day and N(m) is the number of days in the m-th month.
Erythemal UV Measurements
The ambient erythemal UV on a horizontal plane was recorded every 15 minutes by a calibrated UV Biometer (model 510, Solar Light Co., Philadelphia, USA) permanently mounted outdoors on an unshaded building roof in Toowoomba (27.5 °S, 151.9 °E, 693 m above sea level). The site of the Biometer is approximately 100 km north of the New South Wales - Queensland border. Differences in local ambient UV exposures over this distance are considered to average less than 10%(14). Consequently, the results are relevant to providing information on the differences in the exposures to workers on either side of the border. The weather conditions over the five months varied from clear sky conditions to overcast and rain.
The manufacturer of the Biometer provides the spectral response as approximating the human erythemal action spectrum(15). Calibration of the Biometer was against a spectroradiometer(16) with calibration traceable to the Australian National UV standard. In the calibration, the measured spectrum S(λ) was weighted with the erythemal action spectrum A(λ)(15) to provide the erythemal irradiances, UVery as follows:
(2)
λ
λ
λ
Δ
=
∑
S
(
)
A
(
)
UV
UV ery
where the summation is over the UV waveband and Δλ is the wavelength step of the spectroradiometer, in this case 1 nm. This calibration was during the 1998/99 summer.
The uncertainty in absolute terms for UV measurements with the spectroradiometer is of the order of
±5%(17). However, the research in this paper is concerned with comparing the relative differences in UV exposures; the stability of the Biometer is better than these figures. The temperature coefficient of a Biometer’s phosphor is approximately –1% per +1 oC(18), and the temperature stability of the instrument is ±0.2 oC.
Occupational Exposures
The cases considered in this paper are:
• Outdoor workers who start work at 07:00 and finish work at 17:00 for seven days of the week. These workers spend either no time during the day, or different meal break times, out of the sun. The meal break times considered are provided in column 1 of Table 1 and the morning and afternoon tea break times in the first column of Table 2. For these workers the exposures to the nose and shoulders for workers in a predominantly upright position were calculated using exposure ratio values available in the literature(19). The exposure ratios may change with the month and season. Consequently, the exposure ratios averaged over the five months for each site have been employed;
• Indoor workers who spend various meal break periods outside. The meal break times considered are in Table 3. For this group of workers, only the exposure on weekdays was employed in Equation (1), with their exposures on the weekends and public holidays during the time period of the research not considered.
(Table 1 here)
Table 1 – The erythemal UV exposures to the nose and shoulder of outdoor workers who spend different meal break times out of the sun between 25 October and 27 March.
RESULTS
Ambient Erythemal UV
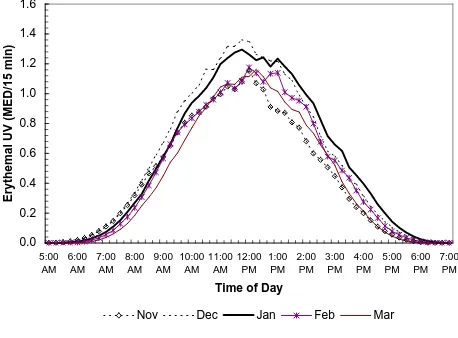
The ambient erythemal exposures for each 15-minute period of the day and averaged for each month are shown in Figure 1. The units of MED or minimum erythemal dose are defined by Diffey(13) as the amount of erythemal UV required to produce barely perceptible erythema after an interval of 8 to 24 hours following UV exposure of unacclimatized white skin. The calibration of the Biometer provided a MED as equivalent to 210 J m-2.
(Figure 1 here)
Figure 1 – The erythemal UV averaged over each month for each 15 minute interval of the day.
The highest ambient exposures for each 15 minute period of the five months were in December with a peak of 1.36 MED between 11:30 and 11:45 AEST. For the other months the maxima were 1.15, 1.30, 1.18 and 1.16 for November, January, February and March respectively.
Outdoor Workers
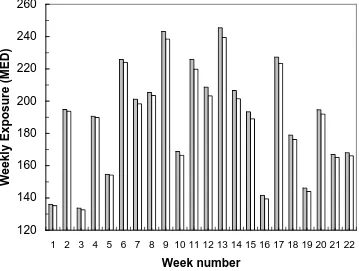
The erythemal UV occupational exposures to the nose and shoulder of outdoor workers who spend different meal break times out of the sun are provided in Table 1. Changing to daylight saving time provides an increase in the UV exposure for some meal break times and a decrease for others. For the workers who take no break or are outdoors between 07:00 and 17:00, there is a decrease in the erythemal UV of 16 and 53 MED for the nose and shoulder respectively. These decreases are due to the shift of the scale on the horizontal axis in Figure 1 to the left by one hour. The variation in the exposures between AEST and AEDT is the differences in the tails of the exposure curves between 16:00 and 17:00. The differences due to the two time schemes for each week may be seen in the weekly exposures on a horizontal plane plotted in Figure 2. The week number is taken from the start of AEDT on 25 October, 1998. The variations between consecutive weeks such as weeks 3 and 4 are due to the differences in cloud cover from one week to the next.
(Figure 2 here)
Figure 2 - The erythemal UV exposures on a horizontal plane for each seven day week between 07:00 and 17:00 AEST, and the corresponding exposures for AEDT. The week number is taken from the start of AEDT on 25 October, 1998.
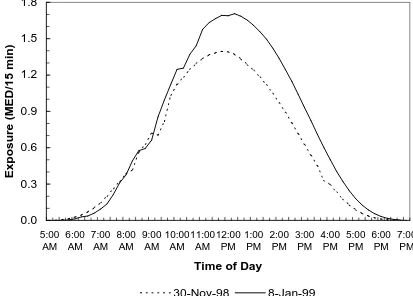
plotted for two days in each of these weeks in Figure 3. There is a higher exposure between 16:00 and 17:00 for 8 January compared to 30 November. Consequently, there is a larger effect due to shifting the time scale to the left by one hour.
(Figure 3 here)
Figure 3 – The erythemal UV exposures on a horizontal plane for 30 November 1998 and 8 January 1999.
The taking of a meal break in an area completely sheltered from the sun, for example indoors, introduces the additional factor of the time of day that the workers are out of the sun with respect to the time of the peak in the exposure curves. Daylight saving time shifts the meal break time with respect to that peak. For the shoulder, the largest decrease provided by switching to AEDT is 118 MED over the five month period for the 12:30 to 13:30 AEST break time. In comparison, the maximum increase for the shoulder was 29 MED for the 11:00 to 12:00 AEST break time.
The erythemal UV exposures to the nose and shoulder for the five month period during different morning and afternoon tea break times are provided in Table 2. For the outdoor workers, their exposures are reduced by the amounts in this table if they spend their breaks out of the sun. The exposures during the tea break are decreased by the shift to AEDT for morning tea breaks. The maximum decrease is 41 MED to the shoulder for the 9:00 to 9:15 AEST break. In comparison, the exposures during the break are increased by the shift to AEDT for the afternoon break with a maximum increase of 43 MED for the shoulder.
(Table 2 here)
Table 2 – The erythemal UV exposures to the nose and shoulder during different morning and afternoon tea break times between 25 October and 27 March.
Indoor Workers
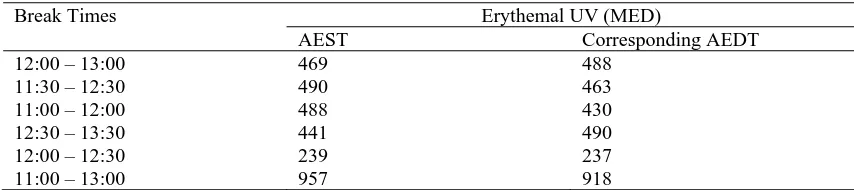
The erythemal UV exposures on a horizontal plane over the five month period for indoor workers spending different meal break periods outside are provided in Table 3 for standard time and daylight saving time. The effect on the erythemal UV exposures of turning the clock forward by one hour is dependent on the time of the meal break. For example, the effect for the 12:30 to 13:30 AEST meal break time is to increase the erythemal exposure by 49 MED over the five months by converting to AEDT. On the other hand, for the 11:00 to 12:00 AEST meal break time, the erythemal exposure is decreased by 58 MED by converting to AEDT. The range of exposures was 237 MED for the 12:00 to 12:30 AEDT break to 957 MED for the 11:00 to 13:00 AEST break. This latter figure is of the same magnitude as the 985 MED of erythemal UV measured outside during the entire days of the three summer months at a higher northern latitude of 55 oN(13).
(Table 3 here)
Table 3 – The erythemal UV exposures on a horizontal plane for indoor workers spending different meal break periods outside, for the scenarios of standard time and daylight saving time.
DISCUSSION
This paper has presented the variations in the solar erythemal ultraviolet exposure during work hours due to daylight saving time in Australia. The introduction of daylight saving time may cause modifications in the recreational behaviour of the population both after work hours and on weekends and holidays with associated changes in the UV exposure. However, in this paper only variations during work hours for workers with fixed work hours have been considered. The differences in the exposures to workers on AEST and AEDT are dependent on the meal break times and the morning and afternoon tea break times. There were both increases and decreases in the erythemal UV exposures to the workers. Consequently, the governing factor in whether daylight saving time increases or decreases the UV exposure is the time of the day that the breaks are taken.
higher exposure of this anatomical region. The results presented in this paper are for the two time schemes of AEST and AEDT, but they are also applicable to locations that are west of the coastal cities. For example, the time of sunrise and sunset is some 50 minutes later at a location in far western Queensland with a longitude of 139.3o compared to the 151.9o longitude of this research.
The risk of squamous cell carcinoma (SCC) is related to the cumulative UV exposure(20). If these variations in UV exposure are consistent over the working life of a group of the population, they may accumulate to a significant amount. Epidemiological research has shown that the incidence of skin cancer increases with exposures raised to a power, known as the biological amplification factor (BAF)(21). The value of the BAF has been determined as 2.5 ± 0.7 for SCC and 1.4 ± 0.4 for basal cell carcinomas. As a result, any reductions or increases in the UV exposures must be significant for the incidence of skin cancer.
Acknowledgments – This project was partially supported through a research grant from the University of Southern Queensland Office of Research and Higher Degrees in the form of funding for the UV Biometer.
REFERENCES
1. Green, A., “Premature ageing of the skin in a Queensland population”, The Medical Journal of Australia (1991), 155, 473-478.
2. Taylor, H.R., “The biological effects of UV-B on the eye”, Photochemistry and Photobiology (1989), 50, 489-492.
3. Sabburg, J., Parisi, A. and Wong, J. “Ozone, cloud, solar and UV-B levels at a low pollution, Southern Hemisphere, sub-tropical site for winter/spring 1995”, Australasian Physical and Engineering Sciences in Medicine (1997), 20, 198-202.
4. Roy, C.R., Gies, H.P. and Toomey, S. “The solar UV radiation environment: measurement techniques and results”, Journal Photochemistry Photobiology B: Biology(1995), 31, 21-27. 5. McKenzie, R.L., Connor, B. and Bodeker, G., “Increased summertime UV radiation in New
Zealand in response to ozone loss”, Science (1999), 285, 1709-1711.
6. WMO (World Meteorological Organization), “Scientific assessment of ozone depletion:1994”, Global Ozone Research and Monitoring Project – Report No. 37 (1995), Geneva, Switzerland. 7. Roy, C.R. and Gies, H.P., “Protective measures against solar UV exposures”, Radiation Protection
Dosimetry (1997), 72, 231-240.
8. Parisi, A.V. and Kimlin, M.G., “Quantifying the effects of simple measures to reduce the occupational solar ultraviolet exposure of outdoor workers”, Journal of Occupational Health and Safety – Australia and New Zealand (1999), 15, 267-272.
9. Parisi, A.V. and Kimlin, M.G., “Effect of meal break times on solar UV exposure to school children in a southeast Queensland summer month,” in press Environmetrics Journal(1999). 10. Hicks, G.J., Davis, J.W. and Hicks, R.A., “Fatal alcohol-related traffic crashes increase subsequent
to changes to and from daylight savings time”, Perceptual and Motor Skills (1998), 86, 879-882. 11. Rock, B.A., “Impact of daylight saving time on residential energy consumption and cost”, Energy
and Buildings (1997), 25, 63-68.
12. Rosenthal, F.S., West, S.K., Munoz, B., Emmett, E.A., Strickland, P.T. and Taylor, H.R., “Ocular and facial skin exposure to ultraviolet radiation in sunlight: a Personal exposure model with application to a worker population”, Health Physics (1991), 61, 77-86.
13. Diffey, B.L., “Stratospheric ozone depletion and the risk of non-melanoma skin cancer in a British population”, Physics in Medicine and Biology (1992), 37, 2267-2279.
14. Gies, P., Roy, C., Toomey, S., MacLennan, R. and Watson, M., “Solar UVR exposures of three groups of outdoor workers on the Sunshine Coast, Queensland”, Photochemistry and Photobiology (1995), 62, 1015-1021.
15. CIE (International Commission on Illumination), “A reference action spectrum for ultraviolet induced erythema in human skin”, CIE J. (1987), 6, 17-22.
16. Parisi, A.V., Wong, J.C.F., Kimlin, M.G. and Meldrum, L., “Errors in determining broadband ultraviolet irradiances from spectral measurements”, Radiation Protection in Australasia (1999), 16, 10-15.
17. Wong, C.F., Toomey, S., Fleming, R.A. and Thomas, B.W., “UV-B radiometry and dosimetry for solar measurements”, Health Physics (1995), 68, 175-184.
19. Kimlin, M.G., “The correlation of solar ultraviolet radiation exposure in Toowoomba and Brisbane”, MAppSc thesis (1998) Queensland University of Technology, Brisbane.
20. NHMRC (National Health and Medical Research Council), “Primary Prevention of skin cancer in Australia”, Report of the Sun Protection Programs Working Party, Publication No. 2120 (1996), Australian Government Publishing Service, Canberra.
Table 1 – The erythemal UV exposures to the nose and shoulder of outdoor workers who spend different meal break times out of the sun between 25 October and 27 March.
Meal break times Erythemal UV (MED)
AEST Corresponding AEDT
Nose Shoulder Nose Shoulder
No break 1040 3576 1024 3523
[image:7.595.86.510.281.389.2]12:00 – 13:00 869 2989 847 2913 11:30 – 12:30 861 2963 857 2946 11:00 – 12:00 862 2965 870 2994 12:30 – 13:30 880 3028 846 2910 12:00 – 12:30 952 3275 938 3225 11:00 – 13:00 694 2387 693 2383
Table 2 – The erythemal UV exposures to the nose and shoulder during different morning and afternoon tea break times between 25 October and 27 March.
Morning and Erythemal UV (MED)
afternoon tea AEST Corresponding AEDT
break times Nose Shoulder Nose Shoulder
09:00 – 09:15 25 86 13 45
09:30 – 09:45 31 108 19 65
10:00 – 10:15 35 121 25 86
14:00 – 14:15 29 101 39 134
14:30 – 14:45 23 78 35 121
15:00 – 15:15 18 63 30 101
Table 3 – The erythemal UV exposures on a horizontal plane for indoor workers spending different meal break periods outside, for the scenarios of standard time and daylight saving time.
Break Times Erythemal UV (MED)
AEST Corresponding AEDT
12:00 – 13:00 469 488
11:30 – 12:30 490 463
11:00 – 12:00 488 430
12:30 – 13:30 441 490
12:00 – 12:30 239 237
[image:7.595.83.510.443.538.2]FIGURE CAPTIONS
Figure 1 – The erythemal UV averaged over each month for each 15 minute interval of the day.
Figure 2 - The erythemal UV exposures on a horizontal plane for each seven day week between 07:00 and 17:00 AEST, and the corresponding exposures for AEDT. The week number is taken from the start of AEDT on 25 October, 1998.
0.0
0.2
0.4
0.6
0.8
1.0
1.2
1.4
1.6
5:00 AM
6:00 AM
7:00 AM
8:00 AM
9:00 AM
10:00 AM
11:00 AM
12:00 PM
1:00 PM
2:00 PM
3:00 PM
4:00 PM
5:00 PM
6:00 PM
7:00 PM
Time of Day
Erythemal UV (MED/15 min)
[image:9.595.104.562.173.511.2]Nov
Dec
Jan
Feb
Mar
120
140
160
180
200
220
240
260
1 2 3 4 5 6 7 8 9 10 11 12 13 14 15 16 17 18 19 20 21 22
Week number
Weekly Exposure (MED)
[image:10.595.122.481.170.441.2]Standard Time Daylight Saving Time
0.0
0.3
0.6
0.9
1.2
1.5
1.8
5:00 AM
6:00 AM
7:00 AM
8:00 AM
9:00 AM
10:00 AM
11:00 AM
12:00 PM
1:00 PM
2:00 PM
3:00 PM
4:00 PM
5:00 PM
6:00 PM
7:00 PM
Time of Day
Exposure (MED/15 min)
[image:11.595.103.516.172.468.2]30-Nov-98
8-Jan-99