Potentially Inappropriate Medication use
in elderly in a tertiary care centre in
South India
An observational study
A dissertation submitted in partial fulfilment of the rules and regulations for
M.D branch XVI - Geriatric Medicine examination of the Tamil Nadu
DECLARATION
This is to declare that this dissertation titled
“Potentially Inappropriate Medication use in elderly in a
tertiary care centre in South India-
an observational study”
Is an original work done by me and submitted in partial
fulfilment of rules and regulations for M.D branch XVI
Geriatric Medicine examination of the TamilNadu Dr.M.G.R
Medical University, Chennai to be held in April 2015.
CANDIDATE
Dr.Alwin Thilak Christopher.J
Post graduate registrar
Dept.of Geriatric Medicine
CERTIFICATE
This is to certify that the dissertation entitled, “Potentially Inappropriate
Medication use in elderly in a tertiary care centre in South India- an
observational study” is a bonafide work
Dr.Alwin Thilak Christopher.J
towards the M.D branch XVI - Geriatric Medicine examination of the
TamilNadu Dr.M.G.R Medical University, to be conducted in
April 2015
.GUIDE AND HEAD OF THE DEPARTMENT PRINCIPAL
Dr.Prasad Mathews Dr.Alfred Job Daniel Professor and Head Professor
Dept. of Geriatric Medicine Dept.of Orthopaedics Christian Medical College Christian Medical College
Vellore Vellore
CO – GUIDES
ACKNOWLEDGEMENT
This dissertation would be incomplete without expressing my gratitude to the people involved in its conceptualisation and completion.
My sincere gratitude to my guide, Dr.Prasad Matthews, Professor and head of Geriatric Medicine, for the mentorship and guidance throughout this process, since its conception to completion, without whose constant help and support this would be an impossible mission.
I thank Dr. Surekha Viggeswarrpu, Professor of Geriatric Medicine, for her guidance in thesis write-up and completion.
I thank Dr.Benny Paul, Assistant Professor of Geriatrics, for the constant support and words of encouragement throughout this new venture.
I thank Ms.Mahasampath Gowri, Department of Biostatistics for her expertise in the statistical analysis.
1 | P a g e
Table of Contents
INDEX OF FIGURES ... 5
1. AIM OF THE STUDY ... 7
2. OBJECTIVES OF THE STUDY ... 8
3. INTRODUCTION ... 9
4. LITERATURE REVIEW ... 10
4.1 Elderly population – World Demography ... 10
4.2 In India ... 11
4.3 Health of the Elderly ... 11
4.4 The use of Medications ... 12
4.5 Definition of Potentially Inappropriate Medication (PIM): ... 12
4.6 PIM– A new non communicable disease ... 13
4.7 Beer´s criteria ... 13
4.7.1 Historical aspects of Beers´ criteria ... 14
4.7.2 Validation of Beers´ criteria ... 15
4.8 Adverse Drug Reactions (ADR) ... 15
4.8.1 Risk factors for Adverse Drug Events ... 16
4.9 Aging physiology ... 16
4.10 Polypharmacy ... 16
4.10.1 Factors contributing to polypharmacy ... 17
4.10.2 Consequences of Polypharmacy ... 18
4.11 Drug-drug interactions ... 18
4.12 Drugs and the Kidney ... 19
5. METHODOLOGY ... 21
5.1 SAMPLE AND SETTING ... 21
5.2 STUDY DESIGN ... 21
5.3 SAMPLE SIZE ... 21
5.4 PARTICIPANTS ... 21
5.5 MEASUREMENTS – DATA COLLECTION ... 22
5.6 DETAILS OF DRUG USAGE ... 24
6. OUTCOMES... 26
6.1 PRIMARY OUTCOMES ... 26
6.2 SECONDARY OUTCOMES: ... 26
2 | P a g e
7. DATA ANALYSIS AND STATISTICAL METHODS... 28
8. RESULTS ... 29
8.1 Demographic characteristics ... 29
8.2 Socioeconomic status ... 30
8.3 PERFORMANCE STATUS ... 32
8.4.2 Systemic hypertension ... 36
8.4.3 Dyslipidemia ... 37
8.4.4 Obesity related ailments ... 37
8.4.5 Coronary artery disease ... 38
8.4.6 Other causes of cardiac failure ... 39
8.4.7 Rhythm disturbances: ... 40
8.4.8 Cerebrovascular accident ... 40
8.4.9 Chronic obstructive pulmonary disease (COPD) ... 40
8.4.10 Chronic kidney disease (CKD) ... 42
8.4.11 Chronic liver disease ... 43
8.4.12 Thyroid disorders ... 43
8.4.13 Peripheral vascular disease ... 43
8.4.14 Epilepsy ... 44
8.4.15 Intracranial (IC) bleed ... 44
8.4.16 Syncopal attack ... 44
8.4.17 Dementia ... 44
8.4.18 Parkinson’s disease ... 45
8.4.19 Major Psychiatric disorder ... 46
8.4.20 Others CNS disorder ... 46
8.4.21 Haematological disorder ... 46
8.4.22 Malignancy ... 47
8.4.23 Connective tissue disorder (CTD) ... 47
8.4.24 Dermatological disorder ... 48
8.4.25 Other diseases ... 49
8.4.26 Incontinence ... 49
8.4.27 Osteoarthritis ... 49
8.4.28 Charlson comorbidity index ... 50
8.5 Factors affecting drug intake and absorption ... 50
8.6 OUTCOMES ... 52
8.6.1 Prevalence of PIM use ... 52
3 | P a g e
8.6.3 CLASS 2 PIM ... 62
8.6.4 CLASS 3 PIM ... 64
8.6.6 Prevalence of polypharmacy and excessive polypharmacy ... 67
8.7TREATMENT FACTORS ... 72
8.8 Details of past ADR ... 73
8.9 DETAILS ABOUT CURRENT ADR ADMISSION ... 74
8.10 ADE s due to drug omission ... 75
8.11 Risk factor assessment – with univariate and multivariate analysis ... 76
8.12 Univariate analysis - summary of risk factor predisposition to PIM use. ... 76
8.13 Multivariate analysis – Independent risk factors for PIM use ... 80
8.14 Univariate analysis - summary of risk factor predisposition to the use of renally inappropriate drugs. ... 83
8.15 Univariate analysis - summary of risk factor predisposition to the occurrence of ADE ... 86
8.16 Multivariate analysis - summary of risk factor predisposition to the occurrence of ADE .... 90
8.17 Univariate analysis - summary of risk factor predisposition to polypharmacy ... 93
8.18 Multivariate analysis - summary of risk factor predisposition to polypharmacy ... 97
9. DISCUSSION ... 100
9.1 Patient profile: ... 101
9.2 PREVALENCE OF PIM USE: ... 101
9.3 Prevalence of renally inappropriate drugs , according to Beers’ criteria : ... 104
9.4 Prevalence of ADEs: ... 105
9.5 Prevalence of polypharmacy: ... 108
10. CONCLUSION ... 110
LIMITATIONS ... 111
4 | P a g e
INDEX OF TABLES
Table 1 Baseline demographic characteristics of study population ... 31
Table 2 Performance status of the study population ... 33
Table 3 Statistics of diabetes mellitus in study population ... 36
Table 4 Statistics of systemic hypertension in study population ... 36
Table 5 Statistics of dyslipidemia in study population ... 38
Table 6 Statistics of coronary artery disease in study population ... 39
Table 7 Statistics of chronic kidney disease in study population ... 42
Table 8 Distribution of various haematological disorders in study population ... 46
Table 9 Distribution of various types of malignancy among our study population ... 47
Table 10 Connective tissue disorder distributed among our population ... 48
Table 11 Distribution of various dermatological disorders in the study population ... 48
Table 12 Stages of CKD in study population (KDOQI guidelines) ... 51
Table 13 BMI distribution in study population ... 52
Table 14 Prevalence of PIM according to Beers´ criteria ... 53
Table 15 Drugs with anticholinergic activity to be avoided, according to Beers´ criteria, 2012 ... 56
Table 16 Drugs with anticholinergic activity to be avoided, according to Chew et al(31) ... 57
Table 17 List of sedatives used by our study population ... 58
Table 18 PIM drugs mentioned in Beer´s criteria ... 61
Table 19 prevalence of renally inappropriate drugs in our study population ... 66
(32) ... 66
Table 20 Renally inappropiate drugs according to Hanlon et al Table 21 drugs to avoid if crcl < 30 according to hanlol et al(32) ... 66
Table 22 Drugs to be avoid if crcl < 60ml/min, according to hanlol et al(32) ... 67
Table 23 Table showing the prevalence of polypharmacy and excessive polypharmacy ... 68
TABLE 24 DRUG OMISSION SCREENED WITH START CRITERIA ... 69
Table 25 Additional drug omissions, not defined by START criteria ... 70
Table 26 Details of past adverse drug events ... 73
Table 27 Details of past adverse drug events ... 74
Table 28 Univariate analysis – comparing clinical dependent variables with PIM use ... 78
Table 29 Multivariate analysis – comparing clinical variables with PIM use ... 81
Table 30 Univariate analysis – comparing clinical variables with renally inapporpiate drug use ... 84
Table 31 Univariate analysis – comparing clinical dependent variables with ADEs ... 88
Table 32 multivariate analysis – comparing clinical variables with ADE ... 91
Table 33 Univariate analysis – comparing clinical dependent variables with polypharmacy ... 95
5 | P a g e
INDEX OF FIGURES
Figure 1 Distribution of elderly in the world(2)... 10
Figure 2 Percentage of elderly (60 and above) by sex, 1901-2051 ... 11
Figure 3 Distribution of age in the study population ... 29
Figure 4 Incidence and types of cardiac failure in study population ... 39
Figure 5 Stage of COPD distribution across study population ... 41
Figure 6 Type of dementia in study population ... 45
Figure 7 Distribution of Charlson comorbidity index ... 50
Figure 8 Type of Sedative used by our study population... 58
6 | P a g e
LIST OF ABBREVIATIONS AND
ACRONYMS
ADR - Adverse Drug Reactions ADE - Adverse Drug Events AGS - American Geriatrics Society Cr Cl - Creatinine clearance GFR – Glomerular Filtration Rate GP – General Practitioners
K/DOQI - Kidney Disease Outcomes Quality Initiative OTC - Over the Counter
7 | P a g e
1. AIM OF THE STUDY
8 | P a g e
2. OBJECTIVES OF THE STUDY
1. To study the comorbidity status of the study population
2. To estimate the prevalence of potentially inappropriate medication (individual drug or drug class) use in elderly (more than 60 years of age) hospitalized patients, as defined by the latest updated Beers´ criteria 2012.
3. To assess the risk factors associated with the use of potentially inappropriate medication.
4. To study the use of nephrotoxic drugs and renally inappropriate dosing in the elderly.
5. To estimate the prevalence of polypharmacy and excessive polypharmacy in hospitalized elderly.
9 | P a g e
3. INTRODUCTION
The world is experiencing a major demographic transition. As a consequence, in developed countries 10% or more of the population are sixty five years of age or over. The situation is moving in the same direction in developing countries like India. Therefore, it is very important to address the health of the elderly. Elderly patients commonly have multiple medical problems requiring treatment. Prescription of medicines plays an important role in the care of elderly people. But unfortunately, many inappropriate drugs continue to be prescribed and used as first-line treatment in older adults. Inappropriate prescribing is considered a major public health issue, given its direct association with substantial morbidity, mortality and health service costs that result from adverse drug reactions (ADRs). Avoiding the use of inappropriate drugs is a simple strategy in reducing medication-related problems in older adults.
Beer’s criterion is a well-established method for evaluating appropriateness of drug prescribing in the elderly. It lists a set of drugs which should be avoided in the elderly or used with careful monitoring. This increases the physician’s awareness in prescribing medications in the elderly, who are prone to age and disease related decline in physiological reserve. Thoughtful application of the Beers´ criteria will result in better patient outcomes.
10 | P a g e
4. LITERATURE REVIEW
4.1 Elderly population – World Demography
The world is experiencing a major demographic transition. As a consequence, in developed countries 10% or more of the population are 60 years of age or over(1). Globally the elderly population is growing at a rate of 2.6% per year. The elderly population is expected to double to around two billion by year 2050 by when there will be more elderly than children. By the year 2050 it is predicted that the number and proportion of the > 80 years age group (“old old”) will grow significantly.
11 | P a g e
4.2 In India
This demographic trend is similar even in developing countries like India. In India the proportion of the elderly in the total population is rising steadily. The proportion of people >60 years of age was 7% in 2009, and 8% in 2011(3) and it is estimated to rise to 20% in 2050 (figure 2). The absolute elderly population was 88 million in 2009 and is expected to rise to 135 million in 2050(2). More developed states such as Punjab, Himachal Pradesh, and Maharashtra along with Southern states have a higher proportion of senior citizens as compared to other parts of the country.
Figure 2 Percentage of elderly (60 and above) by sex, 1901-2051
4.3 Health of the Elderly
[image:15.595.82.499.327.536.2]12 | P a g e
significantly over the last few decades. About one third of medications are prescribed for patients more than 65 years of age(4), and about three fourths of the elderly population are taking at least one prescribed or non-prescribed drug (US population based study, 2008)(5). Hence there is a potential for increased inappropriate drug prescriptions in the elderly.
4.4 The use of Medications
Medication use is a part of routine living for many individuals. Medications are used in all age groups and the amount of usage is directly proportional to the age and morbidity of the individual. The usage of medications seems to be different in different socio economic classes and genders as well. Although the majority of medications consumed are prescribed medications, other classes such as over-the-counter (OTC) drugs and nutritional supplements, belong to the common pool of drugs consumed(6)(7)(8).
Among the developed nations the percentage of the total national health budget spent on drugs varies between 10 to 20%(9).In developing nations, the medication share of the health budget is between 20 and 40% .
4.5 Definition of Potentially Inappropriate Medication (PIM):
13 | P a g e
judgement-based) prescribing indicators. Beers´ criteria is the most widely used explicit tool in the literature.
4.6 PIM– A new non communicable disease
Inappropriate prescribing in the elderly is considered a major public health issue, given its direct association with substantial morbidity, mortality and health service costs that result from adverse drug reactions (ADRs). The prevalence of inappropriate medication usage varies between different studies and is dependent on multiple factors. Lusiele et al, in their systematic review and meta-analysis of all the published studies till 2010 have found the prevalence ranging from 11.5% to 62.5 %(11). Indian data shows that about 12 - 20% of elderly community residents are exposed to at least one PIM(12).
PIM usage is associated with an increased risk of adverse drug reactions and hospitalization in the elderly. It accounts for 5 to 23 per cent of hospitalizations, 2 per cent of ambulatory visits and one in 1000 deaths(13) . The Food and Drug Administration has estimated that the cost of hospitalizations due to inappropriate prescription drug use averages $20 billion annually(14).
It had also found that 22- 30% of Adverse Drug Events (ADEs) were preventable by avoiding inappropriate drugs prescribed to the elderly(15). Avoiding the use of inappropriate and high-risk drugs is an important, simple, and effective strategy in reducing medication-related problems and ADEs in older adults.
4.7 Beer´s criteria
14 | P a g e
1. It is a well-established and validated tool
2. It remains clinically applicable to both community and residential living elderly.
3. It is updated regularly (latest was published in 2012)
4. A number of observational studies have shown a strong link between the medications listed in the Beers´ Criteria and poor patient outcomes (e.g., ADEs, hospitalisation, and mortality).
Limitations:
It does not address drug omission, drug-drug /drug disease interactions or drug class duplication
4.7.1 Historical aspects of Beers´ criteria
The late Mark Beers´, MD, a geriatrician, developed the set of explicit criteria to assess inappropriateness of drugs prescribed for nursing home residents in 1991 with the help of a team of experts using modified Delphi method. The initial list consisted of a list of 30 drugs to be avoided in the elderly irrespective of the diagnoses. Subsequently Beers´ updated the original criteria by adding new drugs in 1997 and 2003. In 2012, the American Geriatric Society along with a panel of experts updated this list(10).This partnership allows for good wider clinical input and regular systematic transparent updates. This update has much more strength because it grades the strength and quality of evidence of each PIM statement based on level of evidence.
Fifty-three medications are included in the final updated criteria, which were divided into three categories: (Annexure 1)
15 | P a g e
2. Potentially inappropriate medications to be avoided in older adults with certain diseases and syndromes.
3. Medications to be used with caution in older adults
4.7.2 Validation of Beers´ criteria
Shah et al(16) studied the appropriateness of prescribing using Beers´ criteria in 400 patients and they found that drug prescriptions in 291 (72.75%) patients were appropriate and 109 (27.25%) were inappropriate. A total of 2924 formulations were prescribed, of which 2788 (95.34%) were prescribed appropriately and 136 (4.65%) were prescribed inappropriately(17).
In another cross sectional study by Karandikar(18) et al, 600 patients were studied and Beers´ criteria identified 7.3% of potentially inappropriate prescriptions. It is well validated in studies to predict adverse health outcomes due to inappropriate prescribing(19).
4.8 Adverse Drug Reactions (ADR)
Many medications may result in an adverse drug reaction (ADR), defined as "A response to a drug which is noxious and unintended, and which occurs at doses normally used in man for the prophylaxis, diagnosis, or therapy of disease, or for the modification of physiological function".
16 | P a g e
4.8.1 Risk factors for Adverse Drug Events
1. Age – pharmacokinetic and dynamic changes
2. Drug factors – polypharmacy, drug duplication, drug–drug /drug –disease interactions
3. Comorbid index
4. Cognition and dependency status
5. Socio - economic factors
4.9 Aging physiology
One thing we learnt in pharmacology in our MBBS days is that “Children are not little adults” and “seniors are not older adults.” With aging there is impairment in the regulatory mechanism that maintains the functional integrity of cells, leading to deranged homeostasis under conditions of stress. Important pharmacokinetic and pharmacodynamics changes occur with age. There is a reduction in renal and hepatic clearance. There is an increase in the volume of distribution of lipophilic drugs (hence increasing the elimination half-life of a drug). There is increased susceptibility to side effects of many classes of drugs, especially anticoagulants, vasopressors and psychotropic drugs.
4.10 Polypharmacy
Out of all these risk factors, polypharmacy was found to be the single most significant and independent risk factor in PIM usage and many studies reiterated this fact(20)(21).
17 | P a g e
in excess of that which is clinically indicated, or the use of an excessive number of inappropriate drugs.
A population-based survey done in the United States showed that more than half of the elderly population use five or more medications a week and 12% use ten or more medications a week(24).
4.10.1 Factors contributing to polypharmacy
Use of multiple drugs is unavoidable in the elderly. The main determinant of polypharmacy is the number of co morbidities. Managing multiple co morbid conditions in old people will be an increasing challenge for medical professionals. The need to keep the number of drugs as low as possible while avoiding under-treatment of the elderly with multiple co morbidities is a difficult balancing act.
Other reasons identified for polypharmacy are,
1. Non-prescription drugs, i.e. Over the Counter (OTC) drugs.
2. Multiple physicians treating one patient.
3. Recent hospitalisation and lack of communication between doctors.
A community survey shows that among the elderly with chronic illnesses as many as 42% used at least one non-medically prescribed drug(25). In the Western literature, vitamins and minerals are the most commonly used (up to 35% of patients) non-prescription drugs. In India, the commonly used non-prescription drugs are - NSAIDs 55%, Antacids 40%, cough expectorants 22% and multivitamin and native medicines contribute 15% each(26) .
18 | P a g e
specialities and medico legal issues. This can significantly increase polypharmacy because of the communication gap between doctors which is more prominent if the patient had recently been admitted. Hospitalisation is a period where many changes are made to medications.
Australian studies found that, about five to seven changes are made during admission, which includes the stoppage of two to three drugs and the initiation of three to four new drugs. Following discharge, these changes are not communicated to the GPs or the GPs fail to recognise these changes. This can lead on to other problems like drug duplication and drug-drug interactions.
4.10.2 Consequences of Polypharmacy
Besides increasing direct drug costs, polypharmacy increases the risk for adverse drug reactions. The risk of ADRs is found to be 13% with two drugs, 58% with five drugs and 82% with seven drugs(27).
The main reasons for this increased risk of ADR with polypharmacy is the multiple comorbid conditions along with the changes due to normal aging, which increase the drug – drug / drug – disease interactions.
4.11 Drug-drug interactions
The elderly are at high risk for drug interactions due to polypharmacy, co morbidities, and the changes associated with normal aging. The risk of a drug–drug interaction increases with the number of drugs used –in 13% of patients taking two drugs and 82% of patients taking more than six drugs (28). The other main risk factor is using drugs with narrow therapeutic indices like digoxin, warfarin, phenytoin and theophylline.
19 | P a g e
4.12 Drugs and the Kidney
Renal impairment is more commonly seen with the elderly, but unfortunately, the prevalence of older people using renally inappropriate drugs is also on the rise. Both drugs which are directly nephrotoxic drug such as NSAID, ACEI, etc. and drugs which are primarily excreted via the kidney which require dose adjustment are considered renally inappropriate. In a study done by Jones and Bhandari(27) in the United Kingdom more than half the number of the elderly population admitted were prescribed at least one potentially inappropriate medication.
As one grows old, there is a decline in renal function. The main reason is a physiological loss of nephrons as a part of aging, and presence of underlying chronic medical conditions like diabetes mellitus or hypertension which affect kidney function. With a decline in renal function, the drug metabolism, mainly the drug elimination is affected. Drugs which are primarily excreted via the kidney are not cleared promptly in renal insufficiency, and this can lead on to drug toxicity if given at the usual dose. Consequently, dosage of these drugs needs to be adjusted according to the creatinine clearance.
20 | P a g e
has another advantage of not using weight as a measure; thereby it can predict the exact GFR in obese individuals and in patients with anasarca.
21 | P a g e
5. METHODOLOGY
5.1 SAMPLE AND SETTING
The study was conducted between April 2013 and August 2014 at Christian Medical College, Vellore, a large tertiary care hospital in South India. Patients greater or equal to 60 years of age, admitted under Geriatric Medicine who fulfilled the inclusion criteria and were willing to participate in the study were recruited into the study. The study and the research procedures were fully explained to the participants and only those who gave written consent /informed consent were allowed to participate in the study. Consent was obtained in the regional language that the patient/relative was conversant with (Annexure 9)
5.2 STUDY DESIGN
This is a prospective observational study done in geriatric patients to assess the prevalence and predictors of inappropriate drug usage and polypharmacy.
5.3 SAMPLE SIZE
The sample size was calculated using an estimated prevalence of inappropriate medication usage as 22% with a 5 % precision using the formula 4pq /d2. This was found to be 275.
5.4 PARTICIPANTS
Inclusion criteria:
1) Patients more than 60 years of age
2) Either the patient or the informant will be able to give a proper drug history
22 | P a g e
Exclusion criteria:
All patients who were unable to communicate (i.e., patients on ventilator, seriously ill patients requiring Intensive care unit admissions), patients with poor cognition (with no reliable care giver) were excluded from the study.
5.5 MEASUREMENTS – DATA COLLECTION
The data collection was done in data abstraction forms (Annexure 3) by the principal investigator of the study during the first visit at the time of admission.
The following details were recorded specifically:
1)Demographic parameters – Age, sex, geographic location, occupation, marital and living status, educational level , socioeconomic status as assessed by Modified Kuppuswamy socio economic scale (Annexure 4)
2) Performance status
- Dependency status with Barthel index – 20 point scale (Annexure 5)
- Functional status – walking pattern questionnaire & timed get up and go test (Annexure 6)
- Exertional capacity using NYHA classification
- Cognitive and mood status
3) Comorbidities status assessment – By clinical interview and Charlson comorbidity index
23 | P a g e
5) Details of drug including treatment details and details regarding drug related hospitalisations
Note :
A) Timed get up and go test: Measures mobility in people who are able to walk on their own (assistive device permitted). The person may wear their usual footwear and can use any assistive device they normally use.
1. Have the person sit in the chair with their back to the chair and their arms resting on the arm rests.
2. Ask the person to stand up from a standard chair and walk a distance of 3 ft. (1m).
3. Have the person turn around, walk back to the chair and sit down again.
Timing begins when the person starts to rise from the chair and ends when he or she returns to the chair and sits down. The person should be given 1 practice trial and then 3 actual trials. The times from the three actual trials are averaged.
Predictive Results Seconds Rating:
- <10 sec Freely mobile - <20 sec Mostly independent - 20-29 sec Variable mobility - >30 sec Impaired mobility
B) Walking pattern: The pattern of individuals walking was observed and classified as follows.
- Walks without aid
24 | P a g e
- Walks only with major help, and cannot walk themselves - Not walking and fully bed bound
C) Exertional capacity: The exertional capacity of the individual was classified using the NYHA classification.
- NYHA class 1 - NYHA class 2 - NYHA class 3 - NYHA class 4
Current functioning status was derived by combining the walking pattern, timed get up and go test with effort tolerance classification. This was further divided into three classes:
- Fully functional - Impaired - Non functional
D) Cognitive status was assessed using the mini cog screening tool (Annexure 7)
E) Mood status was assessed using the GDS 5 - item questionnaire (Annexure 8)
F) Visual and hearing ability – This was done by assessing the ability of the patient to count fingers at 3 meters, and the ability to hear normal voices from 3 meter distance
5.6 DETAILS OF DRUG USAGE
The details of drugs the patients were currently on (over the previous 2 weeks) were noted in detail.
25 | P a g e
2) Essential drug omission was assessed using START criteria (Annexure 2)
3) Drugs with anticholinergic activity in addition to Beers´ criteria were assessed with the criteria studied by Chew et al(31) .
26 | P a g e
6. OUTCOMES
6.1 PRIMARY OUTCOMES
1. To estimate the prevalence of inappropriate medication usage in elderly hospitalized patients.
2. To study the comorbidity pattern of the study population
3. To estimate the prevalence of polypharmacy and excessive polypharmacy in hospitalized elderly patients.
4. To estimate renally inappropriate drug usage in elderly hospitalized patient using Beers´ criteria and using Chew et al(31), review article.
5. To estimate the incidence of adverse drug reactions associated with inappropriate drug usage in elderly hospitalized patients
6.2 SECONDARY OUTCOMES:
1. To study the risk factors associated with the usage of potentially inappropriate medication (PIM).
2. To assess the relationship between PIM use and adverse drug reactions (ADRs) in the hospitalized elderly.
3. To assess the relationship between renal impairment and adverse drug reactions (ADRs) in the hospitalized elderly.
4. To estimate the prevalence of drug omission using START criteria.
27 | P a g e
6.3 DEFINITION OF OUTCOME MEASURES
The prevalence of potentially inappropriate medication usage is defined as the proportion of elderly (more than 60 years of age) who received at least one inappropriate medication (individual drug or drug class), as defined by the latest updated Beers´ criteria 2012, for at least a four weeks continuously.
Polypharmacy is defined as the concurrent use of five or more drugs and excessive polypharmacy is defined as the concurrent use of 10 or more drugs.
Renally inappropriate drugs are drugs / class of drugs which are nephrotoxic or drugs or class of drugs which need dose adjustments but are not appropriately adjusted according to the patient’s GFR.
Class 1 PIM (potentially inappropriate medications) are drugs to be avoided in any elderly irrespective of any underlying diseases
Class 2 PIM are drugs to be avoided in specific disease condition to avoid harmful drug – disease interactions
28 | P a g e
7. DATA ANALYSIS AND STATISTICAL
METHODS
Data entry was done by the principal investigator in the data form and subsequently transferred to Epidata worksheet (Annexure 4). The results were analysed using SPSS software version 22 and stata. The following variables were assessed:
QUALITATIVE VARIABLES QUANTITATIVE VARIABLES
Living status
Socio economic status
Dependency and functional status Cognitive and mood status
Co morbidity status Treatment characteristics
Age
Barthel index Minicog and GDS Co morbidity index Body Mass Index Creatinine clearance Creatinine
Number of drugs Number of PIM Number of RIM
Data was analysed using the Student t test, chi square test or Mann Whitney U test and Fisher’s exact test based on the normality of distribution of the variables.
29 | P a g e
8. RESULTS
8.1 Demographic characteristics
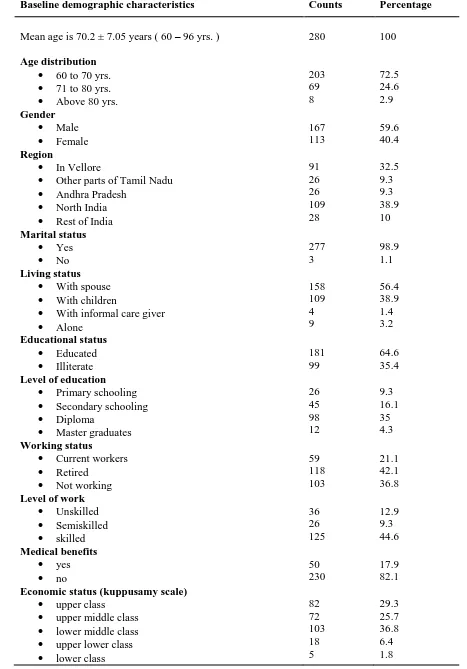
[image:33.595.72.428.389.701.2]A total of 280 patients, more than 60 years of age, admitted in the geriatric ward, from April 2013 to August 2014, were recruited in the study. The mean age of the study population was around 70.2± 7.5 years with the highest age noted being 96years. The majority of subjects, (72.5%) were 60 to 70 years of age and only 2.9% were above 80 years of age. The distribution of age is summarised in the histogram below (Figure 3). 59.6% (167) of the population were male and 40.4% (113) were female. There was no variation in distribution of age among males and females. About 41.7% were from Tamil Nadu, and the rest were from different regions of India.
30 | P a g e
8.2 Socioeconomic status
a) The majority of the population (about 97%) were married. About 95.4% lived with either their spouse or children, and only very few, (less than 5%) lived alone or with an informal care giver. Interestingly, out of 9 patients living alone, 8 were females (p 0.003, Pearson chi square test) and 6 patients were more than 75 years of age. (p 0.031, Pearson chi square)
b) About 35.4 % (99) were illiterate. Out of 99 people who were not educated, females comprised the majority with 62.6% (p=< 0.001, Pearson chi square). About 21.1% of people were still working, and others were either retired or not working. Out of people working, males comprised about 87.9 % (p=< 0.001, Pearson chi square).
31 | P a g e
Table 1 Baseline demographic characteristics of study population
Baseline demographic characteristics Counts Percentage
Mean age is 70.2 ± 7.05 years ( 60 – 96 yrs. ) 280 100
Age distribution
60 to 70 yrs.
71 to 80 yrs.
Above 80 yrs.
203 69 8 72.5 24.6 2.9 Gender Male Female 167 113 59.6 40.4 Region
In Vellore
Other parts of Tamil Nadu
Andhra Pradesh
North India
Rest of India
91 26 26 109 28 32.5 9.3 9.3 38.9 10 Marital status Yes No 277 3 98.9 1.1 Living status
With spouse
With children
With informal care giver
Alone 158 109 4 9 56.4 38.9 1.4 3.2 Educational status Educated Illiterate 181 99 64.6 35.4
Level of education
Primary schooling
Secondary schooling
Diploma
Master graduates
26 45 98 12 9.3 16.1 35 4.3 Working status
Current workers
Retired
Not working
59 118 103 21.1 42.1 36.8
Level of work
Unskilled Semiskilled skilled 36 26 125 12.9 9.3 44.6 Medical benefits yes no 50 230 17.9 82.1
Economic status (kuppusamy scale)
upper class
upper middle class
lower middle class
upper lower class
lower class
32 | P a g e
8.3 PERFORMANCE STATUS
a) About 43.2% of people were dependent either partially or completely with no gender, age or class difference. Dependence was further classified objectively with the help of the Barthel index. The results were summarised in table 3.
b) Functional status of an individual was assessed in 2 parts, assessing mobility and the other exertional capacity. Mobility was assessed subjectively with mobility pattern questionnaire and objectively by timed get up and go test and exertional capacity was assessed by NYHA class. Finally the patient’s functional status was assessed as functional, impaired or non-functional. Functional patients were those who took less than 10 sec to walk 3 foot distance without support and with an exertional capacity of better than NYHA class 2. Non-functional patients were identified as those who could not walk and remained mostly or completely bed bound with the exertional capacity of NYHA class 3 or 4. The remaining patients were grouped as impaired functional status. The results are summarised in the table below.
c) About 16 %( 45) of the population had cognitive impairment affecting their ADLs which was assessed with the help of mini Cog. There was no gender variation in the distribution but there was a significantly higher proportion of dementia with
advancing age (p=0.003, Pearson Chi-Square test).
33 | P a g e
e) About 59 patients in our study had significant insomnia which warranted the usage of sedatives, at some point in their life. There was no gender variation and the
distribution was similar across all age groups with no variation in the distribution of insomnia.
f) Almost all the patients (98%), except 6 patients, in our study group had good visual acuity which was assessed by finger counting at 3meters. Out of these 6 people with severe visual impairment, 1 had congenital blindness, 2 had proliferative diabetic retinopathy and the other 3 patients had mature cataract. About 90% of people had cataract (either immature or mature), but only 35.7% of people had undergone cataract surgeries with IOL placement.
g) About 77.1 %( 216) of people could hear normal voices at 3 meter distance, and the rest 22.9 %( 64) were hard of hearing. Out of 64 people who had hearing impairment, only one patient was using a hearing aid.
Table 2 Performance status of the study population
Performance status assessment Numbers Percentage 1. Dependency status
a) Fully independent for ADLs
b) Partially dependent with Barthel index > 10/20 c) Partially dependent with Barthel index < 10/20 d) Completely dependent for ADLs
159 74 23 24 56.8 26.4 8.2 8.6
2. Functional status
a) Timed getup and go test takes less than 10 sec takes 10 – 30 sec takes 30 - 60 sec takes > 1min could not walk b) Walking pattern
Walks without aid
Walks with minimal aid, by themselves Walks only with major help , and cannot
34 | P a g e
Not walking and fully bed bound c) Exertional capacity
NYHA class 1 NYHA class 2 NYHA class 3 NYHA class 4
d) Current functioning status Fully functional Impaired Non functional
80 132 55 13 32 215 33 28.6 47.1 19.6 4.6 11.4 76.8 11.8
3. Cognitive status
Normal cognition
Impaired cognition with Minicog > 1 Impaired cognition with Minicog ≤ 1
237 26 17 84.6 9.3 6.1 4. Mood status – depression
Normal mood / no depression Depression with GDS ≤ 3 Depression with GDS > 3
231 13 36 82.5 4.6 12.9 5. Sleep pattern
Normal sleep Insomnia
221 59
78.9 21.1
6. Visual ability
normal vision ( as assessed by finger counting at 3 m)
vision impaired presence of cataract
presence of IOL in cataract
274 6 250 70 97.9 2.1 89.5 25
7. Hearing status
Normal hearing (able to hear 30 db sound)
Impaired
Using hearing aid
35 | P a g e
8.4 COMORBIDITY STATUS
8.4.1 Diabetes mellitus
- A total of 156 people (55.7%) out of 280 patients had diabetes. The mean duration of Diabetes mellitus (DM) in years was 12.1 yrs. ± 8.7yrs, and it ranged from newly diagnosed to as long as 43 years.
- Out of these 156 people with DM, 135 (86.5%) had evidence of diabetic neuropathy. The predominant form (more than 90%) seen was distal sensorimotor polyneuropathy. - About 50 patients (32%) had laboratory evidence of diabetic nephropathy.
- Out of these 50 patients, 25 patients had evidence of chronic kidney disease (CKD) with crcl < 60. Of these, two were in stage 5 CKD (one required maintenance haemodialysis), 11 in stage 4 and the other 12 in stage 3 CKD.
- 23 patients had diabetic retinopathy, out of which 2 patients had significant vision impairment and had difficulty to even count fingers at 3 meter distance.
- Out of 156 patients, 50 were taking insulin with or without concomitant use of oral hypoglycaemic agents (OHAs), and there were 8 admissions for hypoglycaemia in this group.
- By chi square subgroup analysis there was no difference in occurrence of these hypoglycaemic episodes between diabetics with and without CKD and there was also no age related difference.
- Only 2 people reported hyperglycaemic complications.
36 | P a g e
Table 3 Statistics of diabetes mellitus in study population
Patients with diabetes mellitus 156 (55.7%) 124 (44.3%)
With neuropathy 135 (48.2%) 145 (51.8%)
With nephropathy 50 (17.9%) 230 (82.1%)
With CKD 25 (7.1%) 255 (91.1%)
With retinopathy 23 (8.2%) 257 (91.8%)
8.4.2 Systemic hypertension
- This was the most commonly occurring comorbidity in our study population, seen in 222 patients out of 280 (79.3%). Mean duration was 10 years ± 6 years.
- 53 patients (23.9%) had left ventricular hypertrophy (LVH).
- Out of these 53 patients with LVH, 33 patients had diastolic dysfunction. Out of these 33 patients 15 patients had grade 1 diastolic dysfunction, 7 patients had grade 2 diastolic dysfunction, and the remaining 11 patients did not have any echocardiogram done to know the status of diastolic dysfunction.
- 3 patients had evidence of hypertensive nephrosclerosis, and all of them 3 had CKD (2 patients in stage 4 CKD, and 1 in stage 5 non oliguric CKD).
- Out of these 3 patients, 1 had a hypertensive emergency which eventually led onto recent hospitalisation.
- 3 patients had evidence of hypertensive retinopathy, out of which 2 patients had grade 2 HTN retinopathy and 1 had grade 1 HTN retinopathy
Table 4 Statistics of systemic hypertension in study population
Patients with hypertension 222 (79.3%) 58 (20.7%) With nephrosclerosis 3 (1.1%) 277 (98.9%)
With CKD 3 (1.1%) 277 (98.9%)
With retinopathy 3 (1.1%) 277 (98.9%)
With LVH 53 (18.9%) 227(81.1%)
37 | P a g e
8.4.3 Dyslipidemia
- About 178 patients (63.6%) had dyslipidemia.
- Out of 178, 40 people (22.5%) had fatty liver, 7(4%) had NASH, 2 patients (1.1%) had evidence of Chronic Liver disease (CLD) (one with no evidence of Portal Hypertension (PHT) and decompensation, but the other patient had decompensated chronic liver disease.
8.4.4 Obesity related ailments
- People with obesity (BMI > 30) comprised 39 patients out of 280. 37 had dyslipidemia (almost 95%).
- The mean BMI in people having dyslipidemia was 26 ± 5, which was in the overweight category.
- A greater proportion of males were obese in our study in comparison with females. (p 0.005 in chi square test).
- Of these 39 obese individuals, 29 had obesity sleep apnea (OSA) syndrome. Of these 29, 12 cases were proven by sleep study, but the other 17 were assumed to have probable OSA based on the STOP BANG questionnaire.
- Of these 12 proven cases of OSAS, only 3 were using CPAP.
- Of these 37 patients, 36 had hypertension, 28 had diabetes and 10 had coronary artery disease (CAD).In our study, the disease incidence of DM, HTN and CAD was
38 | P a g e
Table 5 Statistics of dyslipidemia in study population
Patients with dyslipidemia 178 (63.6%) 102 (36.4%) With fatty liver 40 (14.3%) 240 (85.7%)
With NASH 7 (2.5%) 273 (97.5%)
With CLD With obesity
2 (0.7%) 37 (13.2%)
278 (99.3%) 243 (86.8%)
With OSAS 29 (10.4%) 251 (89.6%)
8.4.5 Coronary artery disease
- We had 56 patients (20%) with coronary artery disease. In this group of people, 37 had definite history of acute coronary syndrome (ACS), 5 had angina symptoms, and 1 underwent elective percutaneous transluminal coronary angioplasty (PTCA) . The other 13 did not have any definite evidence of CAD, but were receiving antiplatelets, statins and some even beta blockers.
- Of these 37 people who had a history of ACS, 6 underwent coronary artery bypass grafting(CABG), 6 underwent stenting, 1 was thrombolysed with streptokinase, and the remaining 24 were treated with conventional medical drugs and had not
undergone any form of revascularisation surgically or medically.
- Of these 56 patients, 31 had ischaemic cardiomyopathy with systolic dysfunction. The mean ejection fraction (EF) in these patients was 43%± 7 %. Out of 31 with left ventricular (LV) systolic failure, 13 patients had mild LV systolic dysfunction, 3 had moderate LV systolic dysfunction, 4 had severe LV systolic dysfunction, and the remaining 11 patients did not have an ECHO documentation to stage the failure. - Of these 7 patients with moderate to severe LV systolic dysfunction, 5 patients had
39 | P a g e
Table 6 Statistics of coronary artery disease in study population
Patients with coronary artery disease 56 (20%) 224 (80%)
With History of ACS 37 (13.2%) 243(86.8%)
With LV systolic failure 31(11.1%) 249(88.9%) With History of revascularisation
(stent / CABG)
12(4.3%) 268 (95.7%)
8.4.6 Other causes of cardiac failure
- We had a significant number of patients having cardiac failure secondary to causes other than ischemia.
- Diastolic failure was the most common cause for cardiac failure, occurring in 56 patients (20%), followed by high output failure secondary to anaemia in 7 patients (2.5%), restrictive cardiomyopathy in 3 patients (1.1%), and one patient (0.4%) with dilated cardiomyopathy secondary to alcohol.
40 | P a g e
8.4.7 Rhythm disturbances:
- Twenty eight patients had rhythm abnormalities, which included 14 cases (50%) of atrial fibrillation, 2 cases (7.1%) of ventricular tachyarrhythmia (1 non sustained ventricular tachycardia, and one of ventricular fibrillation and subsequent cardiac arrest), 2 cases (7.1%) of sinus nodal dysfunction, 5 cases (17.9%) of conduction system disease and other miscellaneous causes in 5 patients (17.9%).
- Out of 28 patients, only one patient had suffered an episode of cardiac arrest which reverted with CPR and was managed medically with amiodarone.
- Both the patients with sinus nodal disease were not on permanent pacemakers. But, one patient with recurrent episode of cardiogenic syncope secondary to atrial tachyarrhythmia underwent permanent pacing.
8.4.8 Cerebrovascular accident
- Forty four patients (15%) had a history of cerebrovascular accident out of which ischaemic stroke dominated with 77.3% (34 cases), haemorrhagic in 13.6% (6 patients), both types in 1 patient and in 4 cases, the nature of stroke could not be identified because of loss of documentation.
- No patient in our study group had undergone any revascularisation procedure (medical or endovascular).
- 8 patients in our study group had suffered recurrent CVAs, out of which 2 were on anticoagulation (1 for cardio embolic stroke secondary to atrial fibrillation (AF), and the other for large artery occlusion)
8.4.9 Chronic obstructive pulmonary disease (COPD)
41 | P a g e
- Out of these 66 patients with COPD, 47 had spirometry reports. The mean FEV1 in patients with COPD was 56% ± 19% of the predicted value. Significant reversibility was seen in 19 patients (40.4%).
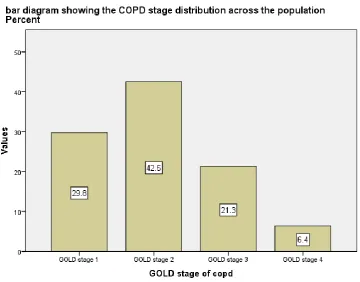
- Majority of the COPD patients belonged to GOLD stage 1 and 2, and only 1/4th of population belonged to stage 3 and 4 COPD. The COPD stage distribution across the population is described in Figure 5.
- No patient with severe COPD had any evidence of pulmonary arterial hypertension or right heart failure.
[image:45.595.77.438.386.668.2]- Out of 73 patients, 41 (56.2%) were using inhalers, either rota halers or metered dose inhalers (MDIs), and 25 (34.2%) patients had been vaccinated with pneumococcal vaccine previously.
42 | P a g e
8.4.10 Chronic kidney disease (CKD)
- Chronic kidney disease (CKD) was defined as Crcl less than 60ml/min/1.73sq.m calculated with the abbreviated MDRD equation.
- About 73 patients (27.1%) were found to have evidence of CKD. 45 patients (61.6%) had stage 3 CKD , 21 patients (28.8%) had stage 4, and only 7 (9.6%) had stage 5 CKD.
- Of the 7 patients with stage 5 CKD, 2 were diabetes related, 1 was HTN related, 2 were connective tissue disease (CTD) related (both were microscopic polyangitis related ) and 2 were due to NSAID abuse.
- Of the 7 patients, only 2 required maintenance dialysis, with one using haemodialysis and the other using peritoneal dialysis.
[image:46.595.76.461.522.767.2]- Complications of CKD were widely seen in our study population with normocytic anaemia being very common, seen in 76.7% of the patients, followed by hyperuricemia in 52.1%, hyperkalaemia in 34.2% and hyperparathyroidism in 32.9%.This is summarised in Table 7.
Table 7 Statistics of chronic kidney disease in study population
Chronic kidney disease statistics Frequency Percent
a) Stage 3 CKD 45 61.6
b) Stage 4 CKD 21 28.8
c) Stage 5 CKD 7 9.6
stage 5 CKD on maintenance haemodialysis 1 14.2 Stage 5 CKD on maintenance peritoneal dialysis 1 14.2 Complications of CKD
a) With normocytic anaemia 56 76.7
b) With secondary hyperparathyroidism 24 32.9
c) With hyperkalaemia 25 34.2
d) With hypernatremia 0 0
e) With hyponatremia 10 13.7
f) With hypercalcemia 3 4.1
g) With hyperphosphatemia 10 13.7
43 | P a g e
i) With metabolic acidosis 18 24.7
8.4.11 Chronic liver disease
- Eleven patients (3.9%) had evidence of chronic liver disease. Of these, 4 had evidence of portal hypertension with decompensation.
- The signs of decompensation and portal hypertension seen in these patients were as follows - all 4 had hypoalbuminemia, 3 had coagulopathy with no active bleeding, 2 had jaundice, 2 had splenomegaly and variceal bleed and hepatic encephalopathy were seen in 1 patient each.
- No patient underwent Trans jugular intrahepatic Porto systemic shunt (TIPS) or liver transplantation.
8.4.12 Thyroid disorders
- Forty patients (14.3%) had hypothyroidism. None of the patients had hyperthyroidism in our study group.
- Of these 40, 37 had primary hypothyroidism, and the other 3 resulted from varied causes - one patient initially had Graves’ disease, post RAI, resulting in hypothyroid state. Another patient developed hypothyroidism post total thyroidectomy for multinodular goitre (MNG) thyroid. The last one resulted as a side effect to lithium, used for bipolar disorder.
8.4.13 Peripheral vascular disease
- Total of 6 patients (2.1%) had evidence of peripheral artery disease out of which 3 patients had arterial non healing ulcers, and 2 had undergone toe amputation.
44 | P a g e
- Interestingly all these 6 patients were non-smokers and all had DM, HTN, DL and three of them also had evidence of CAD.
8.4.14 Epilepsy
- Six patients (2.2%) had an epileptiform disorder, out of which only one was a primary epileptiform disorder and the others were all late onset seizures.
- Of these 5 patients with late onset seizure, 4 were of ischaemic etiology and 1 was secondary to a structural cause (cavernoma).
8.4.15 Intracranial (IC) bleed
- Only 9 patients (3.2%) had a history of intracranial (IC) bleeding, which included 6 hypertensive intracerebral bleeds, 2 subdural bleeds (SDH) and 1 subarachnoid bleed. - Of the 2 persons with SDH, 1 had chronic SDH which was managed conservatively and the other patient had acute on chronic SDH, which was evacuated surgically. All 9 IC bleeds were non traumatic in nature.
8.4.16 Syncopal attack
- 5 patients had episodes of syncope with a mean of 2 episodes in a year. Of these 5 patients, 2 had neurogenic type of syncope, 1 had cardiogenic syncope and the other 2 were undiagnosed.
- None of them underwent pacing procedure.
8.4.17 Dementia
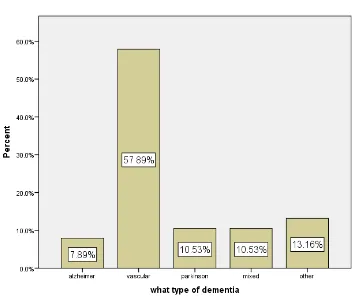
- Dementia diagnosed based on DSM 4, was seen in 40 patients (14.3%). Of these, 15 patients had Behavioural and psychological symptoms of dementia (BPSD).
45 | P a g e
[image:49.595.78.436.114.415.2]10.5% each respectively, pure Alzheimer’s dementia in 7.9%, and other causes in 13.2%.
Figure 6 Type of dementia in study population
8.4.18 Parkinson’s disease
46 | P a g e
8.4.19 Major Psychiatric disorder
- Totally about 9 patients (3.2%) had a major psychiatric disorder. This comprised 1 bipolar disorder, 1 depression with delusional thought and evolving psychosis, 2 adjustment disorder, 2 anxious personality trait, and 3 dysthymia.
8.4.20 Others CNS disorder
- We had 2 cases of chronic inflammatory demyelinating polyradiculoneuropathy (CIDP), and one case each of critical illness polyneuropathy , Mitochondrial encephalopathy, lactic acidosis and stroke like syndromes(MELAS) , myasthenia gravis, Normal pressure hydrocephalus (NPH), Dural arteriovenous(AV) fistula involving cord causing paraparesis and motor neuron disease.
8.4.21 Haematological disorder
- 16 patients had primary haematological disorders. None of them had bone marrow transplantation. This is summarised in table 9.
Table 8 Distribution of various haematological disorders in study population
Haematological disorder Frequency percentage
Hodgkin lymphoma 1 0.4
Non-Hodgkin’s lymphoma 1 0.4
Leukaemia 1 0.4
Plasma cell dyscrasia 7 2.5
Beta thalassemia trait 1 0.4
MDS 3 1.1
Myelofibrosis 1 0.4
47 | P a g e
8.4.22 Malignancy
- About 29 patients (10.4%) had some form of malignancy and 13 had evidence of systemic metastases. The various types of malignancy and the distribution among our study population are summarised in table 10.
[image:51.595.79.490.301.533.2]- Of these 29 patients, only 21 patients received treatment. In treated people, 6 were treated with chemotherapy, 8 received some form of surgical intervention and 7 received both chemotherapy and surgery with or without radiotherapy.
Table 9 Distribution of various types of malignancy among our study population
Primary malignancy Frequency Percentage
Gastrointestinal tract(GIT) 7 2.5
Lung 2 0.7
Genitourinary 5 1.8
Skin and soft tissue 1 0.4
Haematological 8 2.9
Breast 2 0.7
Cervix 1 0.4
Hard palate 1 0.4
Thyroid 1 0.4
Parathyroid 1 0.4
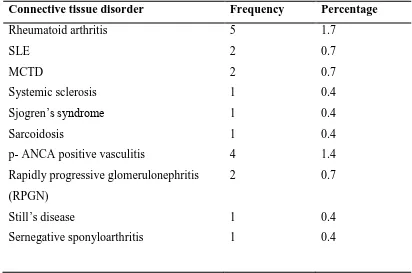
8.4.23 Connective tissue disorder (CTD)
48 | P a g e
Table 10 Connective tissue disorder distributed among our population
Connective tissue disorder Frequency Percentage
Rheumatoid arthritis 5 1.7
SLE 2 0.7
MCTD 2 0.7
Systemic sclerosis 1 0.4
Sjogren’s syndrome 1 0.4
Sarcoidosis 1 0.4
p- ANCA positive vasculitis 4 1.4
Rapidly progressive glomerulonephritis (RPGN)
2 0.7
Still’s disease 1 0.4
Sernegative sponyloarthritis 1 0.4
8.4.24 Dermatological disorder
- About 19 patients (6.8%) had some form of dermatological disorder. The various diseases identified are mentioned in table 11.
Table 11 Distribution of various dermatological disorders in the study population
Dermatological disorder Frequency Percentage
Atopic dermatitis 2 0.7
Contact dermatitis 1 0.4
Dermatitis herpetiformis 1 0.4
Discoid eczema 1 0.4
Lower limb eczema 2 0.7
Lichen planus 4 0.4
Pemphigus vulgaris 1 0.4
Psoriasis 3 1.1
Vitiligo 2 0.7
[image:52.595.79.507.508.738.2]49 | P a g e
8.4.25 Other diseases
- There were 2 patients with hepatitis B and 2 with hepatitis C infection. One among the 2 hepatitis C infected patients was on treatment with antiviral drugs.
- In males, 33% had prostate enlargement, out of which half the number was of a higher grade of prostatism. Only 11 out of 45 patients with severe prostatism has underwent transurethral resection of prostate (TURP).
- In females, urethral stenosis was present in 2 people; of which one underwent dilatation. Unfortunately both the females were having recurrent urinary tract infections (UTI), and were not on long term antibiotic prophylaxis.
8.4.26 Incontinence
- Another significant concern was incontinence, which was present in 20.4% (57) of the population, with functional incontinence in 35%, urge incontinence in 29.6%, mixed type in 15.8%, followed by stress incontinence in (10.5%) and overflow incontinence in 8.5%.
- Recurrent UTI was seen in a significant population, with a total of 28 cases. Out of 28 people, only 8 (28.5%) were on long term antibiotic prophylaxis.
- Interestingly one of the risk factors apart from female sex, and obstructive uropathy, found was indwelling catheter. A total of 12 patients were found to have indwelling catheter.
8.4.27 Osteoarthritis
50 | P a g e
spondylosis 41%, cervical spondylosis 18%, hip 2.5% and Diffuse Idiopathic Skeletal Hyperostosis (DISH) 1.4%.
- About 68 percent were diagnosed previously to have osteoporosis by DEXA scan, and 32 people had suffered a fragility fracture in the past. But out of these 100 people, only 19 patients were already on bisphosphonates.
8.4.28 Charlson comorbidity index
- A mean score of 6 ± 2, with a range of 2 to 14 was identified in our study population, meaning that the population that we are studying was highly complex with multiple comorbidities. There was no gender and age subclass variation. (figure 7)
Figure 7 Distribution of Charlson comorbidity index
8.5 Factors affecting drug intake and absorption
51 | P a g e
had severe reflux symptoms and the rest were due to neurological impairment and poor cognitive status.
b) Gastro-oesophageal reflux disease(GORD) A significant number (about 20 people) had severe GORD with evidence of hiatus hernia in recently done upper gastrointestinal(GI) scopies
c) CONSTIPATION A major chunk of the population (about 71%) was suffering from symptomatic constipation, which warranted them the use of laxatives at some point in their life.
d) DIARRHOEA 4 patients in our study had increased frequency of stools secondary to irritable bowel syndrome, and these patients were on more than one antidepressant.
e) HISTORY OF GI SURGERY A total of 5 patients had a history of extensive bowel resection surgeries in the past. It included 2 distal gastrectomies for stomach cancer, 2 gastrojeunostomies and 1 small bowel resection.
1) CREATININE
The mean value of creatinine was found to be 1.2 ± 1.03, and it ranged from 0.3 to 8.3. The mean creatinine clearance (Crcl) found using Cockcroft Gault equation is 53.8 ± 22 and Crcl using abbreviated MDRD was 73.5 +/- 33.About 75 patients (26.8%) were found to have crcl < 60ml/min/m2. The distribution of creatinine clearance is shown below as a histogram, and the creatinine class distribution is tabulated in table 12.
Table 12 Stages of CKD in study population (KDOQI guidelines)
Stage of CKD Frequency Percentage
Stage 1 82 29.3
Stage 2 111 39.6
52 | P a g e
Stage 4 18 6.4
Stage 5 8 2.9
2) SERUM ALBUMIN
The mean albumin level was found to be 3.5 ± 0.6, ranges from 1.6 to 4.9. 3) Body mass index(BMI)
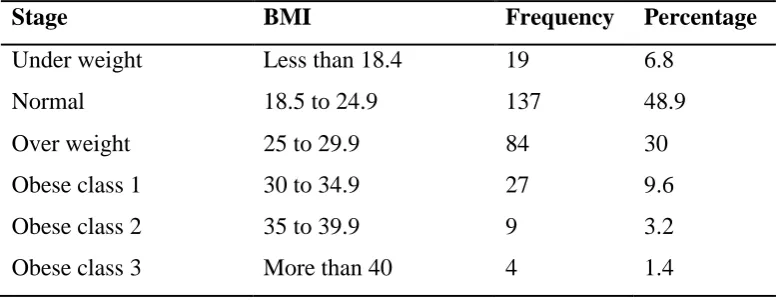
[image:56.595.98.488.353.503.2]The mean height was 162cm ± 7 cm, ranging from 135 to 182 cms. The mean weight of the population was 65kg ± 13kg. The mean BMI was calculated to be 24.9 ±5, which ranged from 13 to 44 kg/sq. m. Normal BMI was seen in 48.9%, underweight in 6.8%, overweight in 30% and obesity in 14.2%. (table 15)
Table 13 BMI distribution in study population
Stage BMI Frequency Percentage
Under weight Less than 18.4 19 6.8
Normal 18.5 to 24.9 137 48.9
Over weight 25 to 29.9 84 30
Obese class 1 30 to 34.9 27 9.6
Obese class 2 35 to 39.9 9 3.2
Obese class 3 More than 40 4 1.4
8.6 OUTCOMES
8.6.1 Prevalence of PIM use
- In our study of 280 patients, 276 patients (98.6%) were using regular drugs.
- In these 276 participants, a total of 1790 drugs were prescribed, out of which 350 drugs (19.5%) were considered inappropriate according to Beers´ criteria.
- Of the 350 inappropriate drugs, 118 were considered to be class I PIM, 188 class 2 PIM and 44 were class 3 PIM drugs.
53 | P a g e
- Most patients were found using one PIM drug (71%), 21.5% were using 2 PIM and a small proportion was using more than 2 PIM (7.5%)
[image:57.595.67.514.194.759.2]- Table 16 list all the inappropriate drugs identified with Beers´criteria.
Table 14 Prevalence of PIM according to Beers´ criteria
PIM – Beers´ criteria Numbers % of 280 pt
Prevalence of PIM users
1 PIM user 2 PIM user > 2 PIM user
93 66 20 7 33.2 23.6 7.1 2.5
Number of drugs out of 350 with percentage PIM class 1 drugs
1. Central nervous system drugs:
a) Benzodiazepines (percentage among class 1 PIM drugs)
b) Conventional antimuscarinics c) Antipsychotics
d) Tricyclic antidepressants e) Non BZD hypnotic f) Barbiturates
118 23 16 14 10 2 1 33.7 6.6 4.6 4 2.9 0.6 0.3 2. Cardiovascular system drugs:
a) Antiplatelets other than aspirin / clopidogrel b) Alpha blockers
c) Central alpha agonist
d) Spironolactones > 25 mg per day e) Digoxin more than 0.125mg per day f) Anti arrhythmics
1 4 5 7 4 4 0.3 1.1 1.4 2 1.1 1.1 3. Others
a) Long acting sulphonyl urea b) Estrogen
c) 1st generation antihistaminics d) Mineral oil
4 1 7 2 1.1 0.3 2 0.6
Prevalence of class 2 PIM (to be avoided in specific disease condition)
54 | P a g e
1. In heart failure a) NSAID b) Amiodarone c) Verapamil d) Cilostazol
6 3 1 1 1.7 0.9 0.3 0.3 2. In syncope
a) Acetyl cholinesterase inhibitors b) Alpha blockers
1 1
0.3 0.3 3. History of fall / fractures
a) Anticonvulsants b) Benzodiazepines c) Antipsychotics d) TCA
e) SSRI
20 16 14 4 3 5.7 4.6 4 1.1 0.9 4. In epilepsy
a) olanzapine 2 0.6
5. History of delirium a) Anticholinergics b) Benzodiazepines c) Non BZD hypnotic d) TCA
e) H2 antihistaminics
10 7 2 2 4 2.9 2 0.6 0.6 1.1 6. In dementia
a) Anticholinergics b) Antipsychotics c) Benzodiazepines d) H2 antihistaminics
8 11 4 1 2.3 3.1 1.1 0.3 7. In parkinsonian disorder
a) Antipsychotics other than quetipatine or clozapine
3 0.9
8. In insomnia
a) Theophyllines 3 0.9
9. In constipation a) Anticholinergics b) Antipsychotics c) TCA
d) 1st generation antihistaminics e) Non dihydropyridine
12 14 11 4 3 3.4 4 3.1 1.1 0.9 10. In gastric ulcer
a) NSAIDs other than low dose aspirin 4 1.1
11. History of urinary incontinence
55 | P a g e
12. In symptomatic BPH
a) Anticholinergics 11 3.1
Prevalence of class 3 PIM (to be used with caution in
elderly) 44 12.6
1. Primary prophylaxis with antiplatelet for patient > 80 yrs
(percentage among class 3 PIM users)
5 1.4
2. Usage of SIADH prone drugs a) Antipsychotics
b) TCA c) SNRI d) SSRI
e) Carbamazepine f) Glibenclamide
14 10 8 4 4 4
4 2.9 2.3 1.1 1.1 1.1
Total 350 100
8.6.2 CLASS 1 PIM - (Drugs to be avoided in elderly , irrespective of underlying disease) a) Drugs with anticholinergic activity
- A total of 60 patients (21.4%) had been exposed to anticholinergic drugs and about 73 drugs with anticholinergic activity (20.9%) were spotted with Beers´ criteria and Jag, 2008.
- Beers´ criteria picked up 47 drugs (13.4%) with anticholinergic activity, and Chew et al, review article helps to spot an additional 26 drugs (7.4%) with anticholinergic activity, which were declared unsafe to use in elderly.
- Out of 14 drugs with anticholinergic activity identified with the Beers´ criteria 34% were antimuscarinics, 30% antipsychotics, 21.3% TCAs, and 15% were 1st generation antihistaminics.
56 | P a g e
- Out of 14 antipsychotics identified, only 2 were typical antipsychotics and the rest were newer atypical antipsychotics. In the atypical group, quetiapine is the major contributor. Out of 10 TCAs identified, 9 were amitriptyline.
- More than 2/3rd of drug with anticholinergic activity was contributed by 4 drugs - Trihexphenidyl, Amitriptyline, Quetiapine and Risperidone.
- Another 26 drugs were additionally identified with Chew et al (31) and these are listed in table 18.
[image:60.595.47.497.385.756.2]- The commonest ADEs requiring hospitalisation observed with anticholinergic drugs are SIADH in 6 patients, followed by SAIO in 2 patients and delirium and fall in one patient each.
Table 15 Drugs with anticholinergic activity to be avoided, according to Beers´ criteria, 2012
Muscarinic receptor antagonist counts percentage
1. Central acting anticholinergic – antiparkinsonian drug
a) Trihexyphenidyl 8 2.3
2. Antispasmodic agent
a) Dicylomine 1 0.3
b) others 1 0.3
3. Other anticholinergics 6 1.7
Antipsychotic 1. Typical
a) Haloperidol 1 2.1
b) Trifluperazine 1 2.1
2. Atypical
a) Quetiapine 8 2.3
b) Risperidone 4 1.1
Tricyclic antidepressant
- Amitriptyline 9 2.6
- Other TCAs 1 0.3
1st generation Anti histaminic 7 2
57 | P a g e
Table 16 Drugs with anticholinergic activity to be avoided, according to Chew et al(31)
Drug Counts `Percentage
Tolterodine 2 0.6
Olanzapine 3 0.9
Escitalopram 4 1.1
Fluoxetine 1 0.3
Mirtazapine 7 2
Ranitidine 9 2.6
Total 26 7.4
b) Sedatives
- Totally 26 sedatives were identified.
- Out of these, benzodiazepines were found to be the predominant tranquilizers used (88.5%), which included 5 on alprazolam , 6 on lorazepam , 11 on clonazepam and only one on diazepam.(table 19)
- Amongst the 5 alprazolam users, one had a fall.
58 | P a g e
Figure 8 Type of Sedative used by our study population
Table 17 List of sedatives used by our study population
1. Benzodiazepine Numbers Percentage
a) Short acting BZD
i. Alprazolam