Measuring the density of dingo teeth with machine vision
John Billingsley, University of Southern Queensland, Kerry Withers, University of Southern Queensland.
Abstract
Collaboration between a mechatronics engineer and a biologist resulted in an unlikely application of machine vision. To deduce the density of the porous teeth, the volume had to be found. An expedient method was constructed for scanning the teeth before they had to be returned to their source and a simple method was derived for deducing their
volume.
Introduction
The biologist co-author had a requirement to measure the density of porous dingo teeth, in order to establish the validity of using the relationship between tooth density and age to estimate the age of the animal. Skulls containing canine teeth from 68 ‘known-age’ animals, either field-captured or captive-reared, were borrowed from dingo skulls held by CSIRO Sustainable Ecosystems, Canberra, Australia.
Weighing the teeth was of course not a problem, but their very porosity was at variance with the use of an ‘Archimedes’ immersion method for measuring their volumes. The biologist seized on the suggestion that machine vision could be the answer.
The original intention was to use ‘structured light’ to map the tooth. It would be mounted on a rotating axis and illuminated by a ‘half plane’ of light using a slide projector. This used the principles of a well known method adopted successfully by a past research student for scanning an ore-pile in a mine [1]. The illumination has a light-dark planar interface that cuts the object at an angle to the direction of observation. The distance of the point on this boundary is easily calculated by triangulation. By making the plane contain the axis of rotation, we would arrive at a table of values of radius as a function of rotation angles, from which the answer would follow.
Development proceeded at a leisurely pace until there was a surprise announcement that the museum required the return of the skulls and teeth by the end of the week. Attention turned to a means of capturing the data for later analysis. The result was almost certainly superior to the original intention.
Capturing the data
An ActiveX ‘OCX’ control had already been written to enable the image data to be ‘grabbed’ into software written in Visual Basic – or most other applications, for that matter. The result of a SnapToArray method was to fill a 320 by 240 by 3 byte-array with red, green and blue values of the image pixels.
The stepper motor was driven in ‘half-step’ mode, which gave a possible resolution of 400 increments per revolution. It was decided, however, that for data economy, only 50 images would be captured per revolution. Even so, the prospect of saving and later processing over eleven megabytes of data for each of 160 teeth was daunting.
Since the ‘shaped light’ projector had not been implemented, the tooth was simply illuminated against a black background. Only the green component of the pixel was tested, leaving invisible the red wax in which the tip of the tooth was bedded. The result was a clear black-and-white silhouette of the tooth. Now only the boundary would be of interest and the data could be reduced dramatically.
For each of the 320 ‘slices’ of the image, the location of maximum and minimum tooth boundary were found. If no white appeared because the slice was beyond the end of the tooth, two values of 0 were recorded, otherwise two comma-separated numbers were written to file. The file size for each tooth was reduced to just over 100 kilobytes.
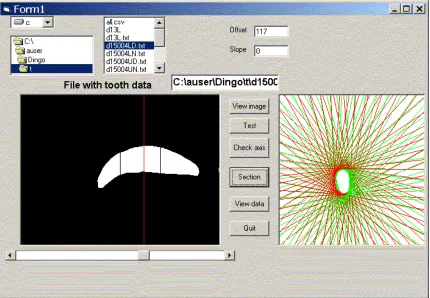
The data could be recalled and replayed as a ‘movie’ of the rotating tooth, as shown in figure 1. The tooth appeared to rotate about a horizontal axis, because of the orientation of the camera.
Some industrious work by a biology student saw the teeth scanned and returned to the museum on time. The problem still remained of processing the data.
Data analysis
Each of the number-pairs in the data file represents a ‘left tangent’ and a ‘right tangent’ for a given elevation angle from the camera lens. Strictly speaking, these will only be accurately tangents to a ‘slice’ when this is at the centre of the image, but the error resulting from neglecting the vertical divergence will be minor. More important is the lateral divergence of these tangents, but that ‘perspective effect’ can readily be
accommodated by drawing such tangents through a single point representing the camera.
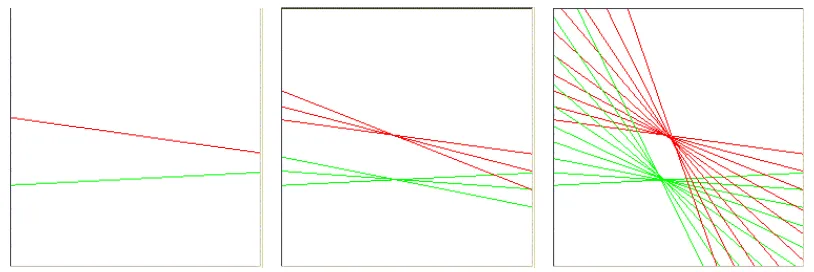
The method adopted was similar to that of the tomograph. A planar array of points was set up, initially deemed to be ‘occupied’. Now each tangent becomes a line that sets a boundary between occupied and unoccupied points and those that are unoccupied can be tagged. For the next image, the camera position is rotated 1/50 revolution with respect to the plane and the process repeated. At the conclusion, the survivors are counted to give the area of the slice.
There are some complications. To perform the coordinate rotation, it is necessary to know the pixel position of the rotation axis. This is entered as a parameter. This axis will not necessarily be accurately aligned with the camera axis, and so a ‘tilt’ parameter is also needed.
A positive error of the axis relative to its reported position will give a positive error in the estimated slice if the left tangent alone is used, or a negative error will result if the right tangent is used. Separate evaluations are therefore made for left and right tangents and the average is taken.
An illustration of the process is shown in figure 2, where left and right tangents are shown in green and red, respectively.
[image:3.612.88.495.524.660.2]
Figure 3. Left and right estimates of the slice.
Clicking the ‘measure’ button causes the slice-measurement process to be applied to the set of 50 images for each x-value of pixel position, 1 to 320, resulting in volume
estimates based on left-tangents and on right-tangents.
The result is of course in cubic pixels, but a simple calibration with a known marble gives the conversion factor.
Problems along the way
The stepper motor is driven in a simple way by direct outputs via the printer port, using a Darlington driver chip. The four windings can be labelled N S E and W and the motor is advanced by stepping the energisation through the sequence NE SE SW NW for four "full steps", or NE E SE S SW W NW N for eight half steps. Repeating the sequence fifty times will take the shaft through a full revolution.
This is simple in principle, but is complicated by the reluctance of the Windows
operating system to permit direct hardware outputs. A ‘dll’ was necessary to perform the task. It was also necessary to avoid any version of Windows later than Windows ME.
programming API published on the web page of E. J. Bantz Jr. and declared to be free of copyright [2]. It enabled image data to be transferred to a byte array for analysis from the ‘Video for Windows’ stream associated with the camera. (Today, attention is turning to DirectShow tools that offer more power and flexibility)
Conclusion
A relatively simple application of machine vision met the needs of biological research. These were expressed in the following terms:
The dingo (Canus lupis dingo) is considered a pest by the Australian livestock industry, while conservation groups argue for its protection. Management strategies developed to conserve dingoes, or to reduce their impact on livestock often require the determination of the age of dingo specimens. Dingoes younger than 10 months can be distinguished from their older counterparts on the basis of closure of the foramen at the root tip of their canine teeth. Similarly, dingoes younger than 2 years can be distinguished from older animals using the ratio of pulp-cavity to canine tooth width at the gumline (Thompson and Rose 1992). Unfortunately, there is no accepted technique for distinguishing between the ages of dingoes older than two years. This presents a problem, as dingoes may live for more than 10 years (Corbett 1995). The relationship between age and canine tooth density as a possible means of age determination in dingos of a wide range of ages has been examined by Ellerton 2002. This study extends that research by providing a method, other than Archimedes’ principle, of determining tooth density (Ellerton et al submitted, Ellerton et al In Prep). Furthermore, it provides a novel application of machine vision technology to a problem in wildlife management.
Along the way, some interesting mechatronic problems were encountered and overcome. The pragmatic methods of this paper may well prove of use to those with some more mundane problems.
1. M Petty, J Billingsley, T Tran-Cong, Autonomous LHD Loading, 4th Mechatronics and machine vision in practice, Toowoomba; Australia, Sep 1997, pp. 219-224.
2. http://www.inlink.com/~ejbantz
3. Thompson, P.C. and Rose, K., 1992. Age determination of dingos from characteristics of canine teeth, Wildlife Research 19, 597-599.
4. Corbett , L., 1995. The dingo in Australia and Asia. Australian Natural History Series, University of New South wales Press, Sydney
5. Ellerton, K. L. 2002. Tooth density as a method of determining the age of dingoes and wild dogs. BSc (Hons) thesis, department of Biological and Physical Sciences,
University of Southern Queensland, Toowoomba, Queensland, Australia.
7. Ellerton, K., Allen, L., Lisle, A., Withers, K. and Billingsley, J. Determining the age of adult wild dogs (Canis lupis dingo, C.l. domesticus and their hybrids): II. Tooth density. (In Prep)
Billingsley, John and Withers, Kerry (2004) Measuring the density of dingo teeth
with machine vision. Sensor Review, 24 (4). pp. 361-363. ISSN 0260-2288 This is the authors’ final corrected pre-publication version.