Develop a system to Monitor, Analyse and Report health data captured
during exercise
A dissertation submitted by
Law Boon Lee
In fulfilment of the requirements of
Courses ENG4111 and 4112 Research Project
Towards the degree of
Bachelor of Engineering (Mechatronic)
Abstract
This dissertation documents the design, develop and testing of the system to Monitor, Analyse and Report health data captured during exercise. The system targeted for home user and has been customized for single user.
Before developing of the system, a research is carried to understand the cardiovascular disease, cardiovascular system and the parameters of the cardiovascular system and equipment used to measure.
During the development of the system, research is also conducted on the signal analyses, circuit design and programming technique.
A prototype of the circuits is developed and tested but the developing of the
microcontroller is halted due to the extensive requirement of time and the difficulty in the programming. The program for user interface and presentation of the result is developed with features that simulated the possible situation of a successful transmission between the equipment and the computer through the interface circuit. Work is currently
underway to improve the system.
University of Southern Queensland
Faculty of Engineering and Surveying
ENG4111 & ENG4112 Research Project
Limitations of Use
The Council of the University of Southern Queensland, its Faculty of Engineering and Surveying, and the staff of the University of Southern Queensland, do not accept any responsibility for the truth, accuracy or completeness of material contained within or associated with this dissertation.
Persons using all or any part of this material do so at their own risk, and not at the risk of the Council of the University of Southern Queensland, its Faculty of Engineering and Surveying or the staff of the University of Southern Queensland.
This dissertation reports an educational exercise and has no purpose or validity beyond this exercise. The sole purpose of the course pair entitled "Research Project" is to contribute to the overall education within the student’s chosen degree program. This document, the associated hardware, software, drawings, and other material set out in the associated appendices should not be used for any other purpose: if they are so used, it is entirely at the risk of the user.
Prof G Baker Dean
Certification
I certify that the ideas, designs and experimental work, results, analyses and conclusion set out in this dissertation are entirely own effort, except where otherwise indicated and acknowledged.
I further certify that the work is original and has not been previously submitted for assessment in any other course or institution, except where specifically stated.
Law Boon Lee
Student Number: D10349257
____________________________ Signature
Acknowledgements
A special thanks to Dr. Selvan Pather, my supervisor, for providing valuable advice and extensive support and help to and during this project.
Thanks to Mark Phythian for the advice and recommendation in the development of the interface circuit.
I would also like to thanks Chris Locke and Terry Byrne for all the assistance and supply of equipment and components during this project.
Thanks to the staff in Toowoomba hospital for providing information for the understanding of medical equipments.
Thanks to Dr Grace Pretty, Dr Des Coates and Dr. Malcolm Mills and some nursing students like Yiu Ngar Wei for the advice on the relation between heart rate, blood pressure and exercise.
Many thanks and respect to my house mate (Lin Tun Kyaw, Yukiko Yoshida and Han Paing Soe) for all the inconvenience caused during the project.
Table of Content
Abstract i
Acknowledgements iv
List of Figures viii
List of Table ix
Chapters 1 Introduction 1
1.1 Introduction 1
1.2 Project Aim 1
1.3 Project overview 2
1.4 Project Objectives 2
1.4.1 Main objectives 2
1.4.2 Additional objectives 3
1.5 Overview of Dissertation 4
1.6 Conclusion 4
Chapters 2 Background 5
2.1 Introduction 5
2.2 Cardiovascular disease and the cardiovascular System
5
2.3 Cardiovascular disease 6
2.3.1 Cost of cardiovascular disease on Australia economy
6 2.3.2 Types of cardiovascular disease and its impact on
Australia
7
2.3.3 Symptoms of Heart Disease 10
2.4 Function of cardiovascular system 12
2.5 Structure of cardiovascular system 12
2.5.1 Heart 13
2.5.2 Blood vessels 13
2.5.3 Blood 13
2.6 Conclusion 14
Chapters 3 Methodology 15
3.1 Introduction 15
3.2 Approach of the project 15
3.2.1 Continuous monitoring of cardiovascular system 16
3.5.1 Equipment 21
3.5.2 Laboratory test 23
3.6 Selection of parameters and instrument 23
3.7 Conclusion 24
Chapters 4 Equipment 25
4.1 Introduction 25
4.2 Selection of measuring equipment 25
4.3 Current product on the market 26
4.4 Features of IA2 31
4.5 Components of the IA2 33
4.6 Information Retrieval 38
4.7 Characteristic of this LCD 39
4.8 Output of the microcontroller 39
4.8.1 LCD driving methods 40
4.8.2 Operation of the LCD 41
4.9 Waveform from the input of the LCD 42
4.9.1 Characteristic of the waveform 42
4.10 1/4 duty (1/3 bias) driving method 43
4.10.1 The segments required to produce a numerical figure
43
4.10.2 Waveform from the Segment Output 46
4.10.2.1 The combination of the waveform 46
4.11 Conclusion 48
Chapters 5 Interface Circuit 49
5.1 Introduction 49
5.2 Expectation of the circuitry 49
5.3 Selection of the communication with the computer
50
5.3.1 RS-232 50
5.3.2 Hardware interfacing required by serial port 52 5.4 Convert different voltage level to uniform
working voltage
54
5.4.1 Power supply 55
5.4.2 Voltage comparator 57
5.5 Convert the parallel signal to a single serial signal 60 5.6 Adjust the frequency to suit the frequency of the
computer
62
5.6.1 Frame format of transmission 62
5.6.2 The frequency of the signal from the input of the LCD
63
5.6.3 The frequency of the computer is receiving data 63
5.7 Microcontroller 64
5.7.2 The connection of the microcontroller 65 5.7.3 The programming of the microcontroller 66
5.8 Problem encountered and Recommendations 67
5.9 Testing of the circuitry 69
5.10 Conclusion 70
Chapters 6 Program 71
6.1 Introduction 71
6.2 Programming tool 71
6.3 Program development 72
6.3.1 Layout of program 73
6.3.2 User particulars 73
6.3.3 Data receiving and Data processing 75
6.3.3.1 Data receiving 76
6.3.3.2 Data processing 77
6.3.4 Data presentation 79
6.4 Additional feature of the program 81
6.4.1 Start-up page 81
6.4.2 Tab 1 User particular 82
6.4.3 Tab 2 User particular 82
6.4.4 Tab 4 Data 82
6.4.5 Tab 5 Graph 82
6.4.6 Tab 6 Print 83
6.5 Problem encountered and Recommendations 83
6.6 Testing of the program 83
6.7 Graph Presentation 84
6.8 Limitation of the product 84
6.9 Conclusion 85
Chapters 7 Conclusion 86
7.1 Introduction 86
7.2 Objectives and achievement 86
7.2.1 The research of the topic 86
7.2.2 The development of the system 88
7.2.3 The problem encountered 89
7.3 Further Work 89
7.4 Conclusion 90
List of References 92
Appendix A Projection Specification 95
List of Figures
2.1 The distribution of health cost due to cardiovascular disease 10
3.1 Picture of ECG 17
3.2 Picture of sphygmomanometer 19
4.1 Picture of an automatic blood pressure monitor 27
4.2 Picture of a manual blood pressure monitor 27
4.3 Picture of a wrist blood pressure monitor 28
4.4 Picture of IA2 31
4.5 Relation between the five main components 33
4.6 Picture of the pump of IA2 34
4.7 Picture of the LCD of IA2 36
4.8 The waveform of 1/4 duty (1/3 bias) 40
4.9 Relationship between common outputs with segments and segment output with segments
43 4.10 Labelling of the segment of the display figure 44 4.11 Labelling of the segment of the display figure 45 4.12 The period and voltage level of the waveform of a 1/4 duty (1/3
bias)
46 4.13 Waveform of common output minus segment output (selected and
non-selected)
47
5.1 RS-232 DB9S interface 51
5.2 The connection between the computer and the interface hardware (no-handshake technique)
52 5.3 A typical connection of a RS-232 Transmitter/Receivers IC 53 5.4 A picture of the RS-232 Transmitter/Receivers IC 53
5.5 A possible signal from the input of the LCD 54
5.6 Circuitry of power supply 55
5.7 Circuitry of R1, R2, R3 and R4 56
5.8 A picture of power supply circuit 56
5.9 Circuitry of voltage comparators using operational amplifier 58 5.10 Circuitry of voltage comparators using operational amplifier with
transistor
59 5.11 A picture of voltage comparators using operational amplifier with
transistor
60 5.12 Circuitry of the parallel to series IC 74HC165 61
5.13 RS-232 frame format 62
5.14 The period of the waveform of a 1/4 duty 63
5.15 A picture of the microcontroller 16PIC628A 65
5.16 Circuitry of the microcontroller 16PIC628A 66
5.17 A picture of the microcontroller 16PIC628A programmer circuit 66
6.1 Tab 1 of the program 74
6.2 Tab 2 of the program 75
6.3 Tab 3 of the program 76
6.4 Tab 4 of the program 80
List of Table
2.1 The direct cost of cardiovascular disease affecting the health system 7 2.2 The population affected by different type of cardiovascular disease 9 3.1 The method and equipment used to mean the parameters 23 4.1 Comparison chart of different blood pressure from Omron 30 4.2 Relation of frame frequency and Common output port 42 4.3 The relationship between the segment outputs, common outputs and
the segment
44 4.4 Relation of the segment to the numerical figures 45 5.1 Relation between signal voltage, output voltage and logic with
voltage reference
Chapter 1
Introduction
1.1 Introduction
This chapter provides a brief introduction of the project. It also includes the objectives of the project and description of the content of this dissertation.
1.2 Project Aim
Health information is critical to the doctor in providing the best possible treatment to the patient and it helps increase the awareness of the patient to one’s health condition. This project aims to develop a system to Monitor, Analyse and Report health data captured during exercise. A research is carried out to access current health of Australian in
1.3 Project overview
The product of the project involves the equipment that is used to measure the blood pressure and pulse, the interface circuit that is used to establish the communication between the equipment, the circuit and the computer and the development of the program to interpret the information from the equipment.
1.4 Project Objectives
The project is categorised into six main objectives and two supplement objectives. These six main objectives are required to fulfil the project requirements, whereas the two supplement objectives will help to enhance the project.
1.4.1 Main objectives
1. Define the objective and tasks of the project
The first task of the project is to plan the possible outcome of the project. Identify the objectives of the project and list the tasks required to achieve the objectives.
2. State the Requirement, Restriction and Resources of Project
After the tasks are listed, it requires a rough plan to identify the requirements, restriction and resources that are needed to fulfil the objectives.
3. Research the critical parameters, measuring device types and current devices on the market.
of health, the equipment used to measure these health indicators and the equipment that is on the market.
4. Investigate the interface of the equipment
Then a next step is taken to investigate the interface method and requirement of the equipment and computer.
5. Design several possible interface circuit and select the most suitable for the project
The development of the interface circuit will have to undergo different possibility of different possible plan. Then the appropriate plan is selection for the project.
6. Develop and test the interface and software between the equipment and the computer
Develop the interface circuit that required for the communication between the equipment and the computer.
1.4.2 Additional objectives
7. Evaluate the design and minor improvement to the system
The system is not perfect and required to have another review to improve it. 8. Incorporate other devices to the system
1.5 Overview of Dissertation
This dissertation is a documentation of the work involved in the development of this project. It is to provide adequate information of the project for future development. The project is classified into the “research” and “development”. The “research” involves the required information for the project. This includes:
1. The background of the project in chapter 2 2. The Methodology of the project in chapter 3 3. The equipment in chapter 4
4. The interface circuit in chapter 5 5. The program in chapter 6
1.6 Conclusion
This chapter describes the overview of the project which includes the project title, aim and objectives and also provides a brief introduction of the expectation of this
Chapter 2
Background
2.1 Introduction
“Early detection of serious disease is a key priority in preventative health services” is one of the objectives of the department of Health and Aging of Australia (Chief Medical officer’s report, 1999-2000). This project provides the same intention in promoting early detection of cardiovascular disease. This chapter explains how cardiovascular disease affects Australian both socially and economically and the function and components of cardiovascular system.
2.2 Cardiovascular disease and the cardiovascular System
2.3 Cardiovascular disease
Cardiovascular disease is the most important item in the national health profile. The number of Australians affected by cardiovascular disease have increased from 1 in every 6 to 1 in every 4 which is about 67% of families suffer cardiovascular disease (Heart disease and stroke statistics, 2005 update). Above all, 38% of death is caused by cardiovascular disease. In 2004, 50,292 people died due to cardiovascular disease. In every 10 minutes, an Australian dies due to cardiovascular disease. These figures illustrate how serious the cardiovascular disease is affecting Australia.
2.3.1 Cost of cardiovascular disease on Australia economy
Items Cost (million)
Hospital inpatient $2700
Pharmaceuticals $1700
Residential aged care $639
Others $2561
Total $7600
(Heart disease and stroke statistics, 2005 update)
Table 2.1 The direct cost of cardiovascular disease affecting the health system
This does not include the indirect spending which is estimated to be $6.6 billion in 2004. There are 55,871 Australians who could not work due to cardiovascular disease.
Production losses due to lower employment rates and premature mortality have reached a total of $3.6 billion.
2.3.2 Types of cardiovascular disease and its impact on Australia
Before the discussion of the cardiovascular system (detailed in 2.3), this section introduces some cardiovascular disease. This includes some common types of
cardiovascular disease and facts and figures showing how these cardiovascular diseases are affecting the lives and economy of Australia.
Some common types of cardiovascular disease include:
• Hypertension
heart to work harder than normal. Over a period of time, it causes injury to the heart and the arteries. Injured heart and arteries increase the risk of heart attack, heart failure and stroke.
• Tachycardia
Tachycardia is rapid beating of the heart. Rapid beating of the heart reduces the heart’s ability to pump and circulate blood effectively. It cause dizziness, light headedness and fainting or near fainting.
• Arrhythmias
Arrhythmias are abnormal heart rhyme and it causes the heart to pump less effectively. When the heart is less effective, it causes from barely perceptible to cardiovascular collapse and death.
(Heart and stroke facts, American Heart Association, 1992-2003)
Cardiovascular disorder (long term) males (‘000) % male
pop'n females (‘000) % female pop'n people (‘000) % total pop'n Hypertension 868.9 9.0% 1,040.3 10.6% 1,909.1 9.8%
Angina 137.6 1.4% 122.8 1.3% 260.3 1.3%
Other coronary heart
disease 79.6 0.8% 46.1 0.5% 125.6 0.6%
Other heart disease 6.0 0.1% 6.4 0.1% 12.4 0.1%
Tachycardia 143.4 1.5% 195.0 2.0% 338.4 1.7%
Oedema 88.3 0.9% 208.3 2.1% 296.6 1.5%
Diseases of arteries,
arterioles & capillaries 124.8 1.3% 74.4 0.8% 199.1 1.0%
Haemorrhoids 88.8 0.9% 119.8 1.2% 208.6 1.1%
Varicose veins 97.8 1.0% 341.9 3.5% 439.7 2.3%
Other CVDs 93.8 1.0% 111.3 1.1% 205.1 1.1%
Cardiac murmurs and sounds
159.3
1.7% 206.2 2.1% 365.4 1.9%
Other CV signs &
symptoms 24.7 0.3% 41.6 0.4% 66.2 0.3%
Total 1,387.4 14.4% 1,798.4 18.4% 3,185.9 16.4%
Source: Access Economics derived from ABS (2002), Table 5. Self-reported data.
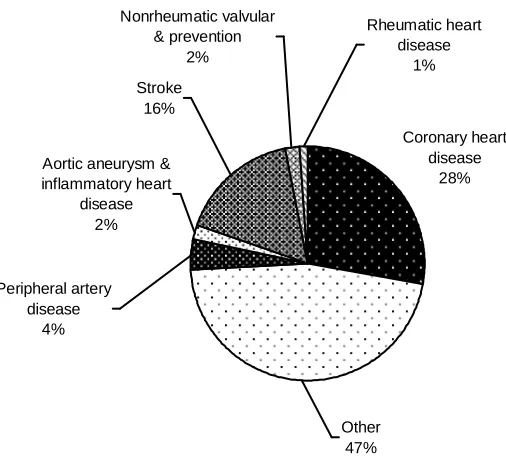
Coronary heart disease 28% Peripheral artery disease 4% Other 47% Aortic aneurysm &
inflammatory heart disease 2% Stroke 16% Rheumatic heart disease 1% Nonrheumatic valvular & prevention 2%
[image:20.612.152.405.80.313.2]Source: Access Economics derived from ABS (2002)
Figure 2.1 The distribution of health cost due to cardiovascular disease
2.3.3 Symptoms of Heart Disease
The symptom of cardiovascular diseases depends on the type of disease. For instance, the warning signs for heart attack are:
• Chest discomfort
Chest discomfort refers to discomfort in the centre of the chest that lasts more than a few minutes or that goes away and comes back. These discomforts might be
uncomfortable pressure, squeezing, fullness or pain.
• Shortage of breath
Shortage of breath usually happens before chest discomfort.
• Other warning signs
These may includes breaking out in cold sweat, nausea or light-headedness. (Heart and stroke facts, American Heart Association)
The warning signs for stroke are:
• Sudden numbness or weakness of the face, arm or leg
• Sudden confusion
• Suddenly having difficulty in
o Speaking or understanding
o Seeing in one or both eyes
o Walking
o Dizziness
o Loss of balance
• Sudden headache with unknown cause
(Heart and stroke facts, American Heart Association)
2.4 Function of cardiovascular system
The human body is the integration of several systems but these systems can also operate independently. The cardiovascular system is the most important system in the human body because the cardiovascular system is directly related to all systems in the body. The role of the cardiovascular system is classified in five categories:
Delivery
The cardiovascular system delivers oxygen. Removal
The cardiovascular system removes carbon dioxide. Transport
The cardiovascular system helps to transport hormones from glands to receptors Maintenance
The cardiovascular system regulates the temperature and pH level of the body Prevention
The blood in the cardiovascular system prevents dehydration and infection (Physiology of sport and exercise, 2003)
2.5 Structure of cardiovascular system
The cardiovascular system consists of three main components: Heart
With these three components, the cardiovascular system acts as a circulation system, with the heart as the pump, the blood vessels as the pipe and the blood as the transport medium (Exercise physiology, third edition).
2.5.1 Heart
The heart is divided into four chambers. Two atria are receiving chambers for blood returning from the arteries and two ventricles are delivery chambers that pump blood into the blood vessels. The rate of the flow of blood is controlled by the values in the heart and the rate the heart beat. These values also help to prevent a reverse flow of blood hence the blood flow is maintained in unidirectional (Clinical Cardiology, sixth edition).
2.5.2 Blood vessels
The blood vessels are like roads in a transportation system. The vessels are linked with all cells in the body which create paths for the blood to travel. These vessels are made up of veins, arteries and capillaries. Blood are delivered through the arteries to the capillaries and from the capillaries to the veins back to the heart. All exchange of oxygen, carbon dioxide and nutrients happen in the capillaries (Physiology of sport and exercise, 2003).
2.5.3 Blood
The blood is the medium of transportation. It carries substances like oxygen to the
2.6 Conclusion
This chapter illustrated how the cardiovascular disease affects the economy and
Chapter 3
Methodology
3.1 Introduction
This chapter will highlight the two approaches in developing the system and the methods that can be used to achieve the approach. Using the method, the project required the understanding of the equipment used to measure the parameters of the cardiovascular system. The chapter will also include the selection of the parameters of the cardiovascular system and the equipment used to measure these parameters.
3.2 Approach of the project
3.2.1 Continuous monitoring of cardiovascular system
Continuous monitoring of the cardiovascular system refers to the use of medical
equipment to measure the critical parameters of the cardiovascular system. This approach is preferred for the detection of cardiovascular disease in the early stage. It helps to greatly reduce the medical treatment cost and increase the chances of recovery.
3.3 Methodology
In an engineering point of view, there are three ways to improve continuous monitoring of cardiovascular system:
• The instrument that measure the parameter
This method improves the accuracy of the instrument.
• The method of measuring the parameter
This method improves the way of measuring of the parameter to achieve more accurate measurement or reduce the error during measuring.
• The system of measuring the parameter
This method improves the presentation of the value of the parameter.
3.4 Parameters of the cardiovascular system
The health condition of the body is directly related to the performance of the
cardiovascular system. Hence, it is the measurement of the performance of the three components in the cardiovascular system.
3.4.1 Measurement of the heart performance
The parameters for the heart are the heart rate and the heart rhythm (Exercise physiology, third edition). Heart rate is the measurement of the rate the heart pumps also known as heart beat. This can be achieved by using a heart rate meter. Heart rhythm is the frequency which the heart beats and requires an electrocardiogram (ECG) machine to measure the oscillation of the heart.
[image:27.612.94.382.411.644.2](Picture taken from http://health.allrefer.com)
This oscillation is created by the potential difference of the muscles of the heart. Usually five electrodes are placed on the body to measure the pacemaker also known as sinoatrial (SA). The sinoatrial are a group of cells which act like switches that spontaneously generate action potential at a constant rate. Depending on the position of the electrodes, the potential difference can be calculated by the ECG machine and create a waveform of the frequency of the heart (Biomedical instrumentation, Second edition).
3.4.2 Measurement of the blood vessels
(Picture taken from http://www.medical-scrubs.com)
Figure 3.2 Picture of sphygmomanometer
The indirect method is measured by placing a rubber cuff wrapped around a person’s upper arm. The inflation of the rubber cuff will compresses the large artery in the arm,
momentarily stopping the blood flow. When air in the cuff is released, the blood starts to
pulse through the artery and makes a sound. Sounds continue to be heard using the
stethoscope until the pressure in the artery exceeds the pressure in the cuff. When the sound stops, the measurement will be taken. Two measurements are recorded, Systolic
pressure and Diastolic pressure. Systolic pressure is the pressure of the blood flow when
the heart beats (the pressure when the first sound is heard). Diastolic pressure is the
pressure between heartbeats (the pressure when the last sound is heard). Blood pressure is
measured in millimetres of mercury, which is abbreviated mm Hg. The harder it is for
diastolic pressure below 80 mm Hg is “Normal “condition of the body (Clinical Cardiology, sixth edition).
The process of measuring is classified manual, semi automated or the fully automated.
The manual method uses a sphygmomanometer. The person taking the measurement will
be required to inflate the cuff and listen to the sound and take reading from the scale on
the sphygmomanometer. The process can be sped up by using the semi-automated blood
pressure monitor (BPM) to sense the transmission of the sound as a pulse reference to a
timer but the person is still required to inflate the cuff. The fully automated blood
pressure monitor (BPM) inflates the cuff and listens to the sound. The person is only
required to read the value of measurement (Biomedical instrumentation, Second edition).
The stroke volume is the measure of the volume of blood in each stroke (Exercise physiology, third edition). It determines the amount of blood that is passing through the position where the measurement is taken in each stroke. The blood volume is the quantity of blood in the blood vessels. The method of measuring the blood volume and stroke volume are similar to the method of measuring the blood pressure and it is measured using the direct method (Biomedical instrumentation, Second edition).
3.4.3 Measurement of the blood
The parameters for blood are blood viscosity and peripheral resistance (Exercise
physiology, third edition). The blood viscosity measures the quality of the blood which is the quantity of the content of blood in each specified amount of blood. Blood is taken from the body to undergo laboratory tests. The peripheral resistance affects the efficiency of the blood flow. (Exercise physiology, third edition).
3.5 Instrument to measure the cardiovascular system
The different instruments are used to measure these parameters. These parameters involve the use of equipment or laboratory test to define the performance of the three components.
3.5.1 Equipment
The parameters of the cardiovascular system can be measured by two methods, direct and indirect. The direct method involves a cut in the body to place a transducer into the
cardiovascular system to take measurement (Biomedical instrumentation, Second edition). This method will produce a more accurate measurement but it is not convenient and it has a certain risk of infection. This method is suitable only when the accuracy of the
The indirect method is also known as the physical examination (Clinical Cardiology, sixth edition). The measurement is taken physically on or near the skin which is more convenient. It is almost risk free.
Indirect method of measuring the parameters is preferred in this project. Indirect method of measuring has the following benefits:
Convenient
The measurement is taken on or near the skin which make measurement convenient. It also allows measurement to be taken repeatedly.
Risk (Risk of infection)
Indirect method involves only the contact with the skin or even non-contact, hence the risk involved is relatively small.
Cost
The manufacturing cost for the equipment is much lower than those equipments used for direct method.
The disadvantage of the indirect method includes: Accuracy
When the sensor of the equipment is nearer to the heart, the accuracy of the
measurement will be better. Hence, indirect method is less accurate compared to the direct method.
Factors affecting the accuracy of readings
Under critical circumstances, continuous monitoring of parameters of the cardiovascular system is required. Direct method can provide readings of the component of the cardiovascular system instantly.
(Clinical Cardiology, sixth edition)
3.5.2 Laboratory test
Most parameters of the cardiovascular system are measured using equipments. For example, the heart rate and blood pressure are measured using heart rate meter and blood pressure monitor respectively. Other parameters that measure the concentration of the blood or related factors required laboratory testing to determine its value. For example, the blood content and the resistance in the vessels required laboratory tests (Exercise physiology, third edition).
3.6 Selection of parameters and instrument
The selection of the parameters is determined by the importance of the parameter, the method and the equipment. Hence, table 3.1 summarized the method and its equipment according to the parameters.
Parameters Method Medium of measurement
1 Pulses Indirect Pulses meter
Indirect 1. Sphygmomanometer 2. Semi-automated BPM
3. Fully-automated BPM
2 Blood pressure
Direct Transducer
3 Blood volume Direct Transducer
5 Blood viscosity Direct Laboratory test
6 Peripheral resistance Direct Indirect measurement via calculation Indirect Heart rate meter
7 Heart rate
Direct Transducer Indirect ECG machine 8 Heart rhythm
Direct Transducer (Exercise physiology, third edition)
Table 3.1 The method and equipment used to mean the parameters
Of all the parameters mentioned above, the blood pressure and pulse is selected for the project.
The main reason is the importance of these two parameters. A stable rate of the heart beat reflects a stable operating condition of the heart. A change in the blood volume, stroke volume and peripheral resistance can be predicted by a change in the blood pressure. Both parameters can be measured indirectly
3.7 Conclusion
Chapter 4
Equipment
4.1 Introduction
Chapter three has illustrated the parameters of the blood pressure and pulse and this chapter will illustrate the equipment to measure both the blood pressure and the pulse. This measuring equipment is essential to the project. This equipment is the source of the information health data. It is a blood pressure monitor with capability to measure pulse. The selection of the equipment and some common equipment in the market will be discussed in this chapter. This chapter will also have a detail description of the function of the equipment, the interpretation of the information and the signal that is coming out from the equipment.
4.2 Selection of measuring equipment
and the heart rate meter is used to measure the pulse. There is also equipment that can measure both parameters. Equipment is mostly similar in its function but additional features are added depending on the usage and the cost.
The usage of the equipment is grouped into three: - extensive usage
The person is required to wear the equipment for 24 hours. For this usage, the ambulatory blood pressure monitor is used to measure the blood pressure whereas a holter meter is used to measure the heart rate.
- periodic usage
The person will take the measurement in an allocated time. - occasional usage
The person seldom measures.
In this project, the usage of the equipment is between extensive and periodic. The measurement is taken in periodic and transferred to the computer to analyses.
4.3 Current product on the market
Currently in the market, equipments are categorizes in three groups
• Automatic blood pressure monitor
(Picture taken from http://www.50plushealth.co.uk)
Figure 4.1 Picture of an automatic blood pressure monitor
• Manual blood pressure monitor
The manual blood pressure monitor will allow the user to inflate the cuff manually.
(Picture taken from http://www.epinions.com )
Figure 4.2 Picture of a manual blood pressure monitor
• Wrist blood pressure monitor
[image:37.612.215.416.341.544.2](Picture taken from http://asseenontvpicks.com)
Figure 4.3 Picture of a wrist blood pressure monitor
Both manual and automatic blood pressure monitor takes measurement from the upper arms and the wrist blood pressure measures from the wrist. The market is currently moving toward providing more features and new blood pressure monitor usually come with automatic inflation function. For example, Omron have only a hand full of product that is manual inflated and most are currently automatic inflated. Table 4.1 shows a comparison chart with a list of blood pressure monitor with different features. Omron is not the only company providing blood pressure monitor equipment. Companies like Lifesource, J. Hewitt and SunTech also carries a series of blood pressure monitor but Omron is the leading band in Asia.
Additional features of the equipment include: 1 Memory capability
The accuracy of reading refers to the consistency of the reading. Different measurement taken within a small period of time should not have a big variation in the value.
3 Error detection of readings
The error detection of readings refers to the intelligence of the equipment to detect inaccurate readings. For instance, incorrect positioning or shaky while taking measurement.
4 Downloading capability
The downloading capability refers to the ability of the equipment to transfer the readings to a computer.
5 Pulse measuring capability
This refers to the ability to measure pulse.
The equipment for this project requires these all the features above.
Features IA1 IA1B IA2 IW1 IW2 R8IT M5 MX-3 R-A1 M2 T9P HEM-907 Intellisense
technology
√
√
√
√
√
√
√
√
Automatic
Inflation
√
√
√
√
√
√
√
√
√
√
√
Wrist
√
√
√
√
Cuff Fit Cuff Fit Cuff
Fan-shaped cuff Wrist Cuff Wrist Cuff Wrist Cuff Fan-shaped cuff Fan-shaped cuff Wrist Cuff Fan-shaped cuff Fan-shaped cuff Fan-shaped cuff Standard cuff size provided
17 - 32 cm
(S-M)
22 - 42 cm
(M-L)
22 - 32 cm 13.5 - 21.5 cm 13.5 - 21.5 cm 13.5 - 21.5 cm
22 - 32 cm
22 - 32 cm
13.5 - 21.5 cm
22 - 32 cm
22 - 32 cm
22 - 32 cm
Fast
measurement
√
√
√
√
√
√
√
√
Memory (sets of readings)
90 90 90 90 90 90 14 21 14 28
Date & Time
Display
√
√
√
√
√
√
√
√
Average of last
3 readings
√
√
√
√
√
Detects Irregular heartbeat
√
√
√
√
√
Body movement indicator√
√
√
AdvancePosition Sensor
√
√
AC jack
(optional)
√
√
√
√
√
√
√
√
√
√
√
√
4.4 Features of IA2
Figure 4.4 Picture of IA2
IA2 is the equipment chosen for this project due to three main reasons. 1. The size
The size of the equipment is not compact therefore it is easier to investigate the equipment.
2. The price
The cost of the equipment is relatively cheaper than others. 3. The features
This equipment has the following features: 1. Memory capability
IA2 can hold 90 sets of memory with date and time.
2. Accuracy of reading
IA2, like many of Omron product, has Intellisense technology. The Intellisense
technology is an ability to take a few readings and provide the average of the readings as the final readings. It also removes ambiguous readings. This greatly improves the
accuracy of the reading.
3. Error detection of readings
IA2 can also detect irregular heartbeat and body movement. By taking a set of readings, when these readings are mostly ambiguous readings and with the motion detection of on transducer, it indicates that the person is moving while taking the readings. These set of readings can also interpret irregular heartbeat when the changes of the sys pressure and dia pressure values is not in a regular pattern.
4. Pulse measuring capability
IA2 can measure both the pulse and the blood pressure.
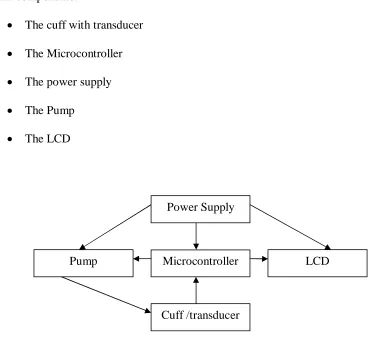
4.5 Components of the IA2
Investigation is carried out to understand the components of the IA2. IA2 consists of 5 main components:
• The cuff with transducer • The Microcontroller • The power supply • The Pump
[image:43.612.101.473.138.476.2]• The LCD
Figure 4.5 Relation between the five main components
These four components are linked to the microcontroller. This processor will activate the pump to ensure a sufficient amount of pressure is produced to inflate the cuff. During the inflation of the cuff, the transducer will take the pressure difference and transmit the information to the microcontroller. The microcontroller will interpret the information and process the calculation and display the relevant information on the LCD.
Cuff /transducer
Microcontroller LCD
Pump
1. The cuff
The inflation of the cuff depends on the amount of pressure from the pump. This amount of pressure transmitted to the cuff will tighten the cuff. When the cuff is tightening, pressure acts on the blood vessel. Hence, when the blood vessel is been pressurized, it produce a sound wave. This sound wave is then picked up by the transducer.
2. The pump
[image:44.612.92.480.374.665.2]3. The LCD
LCD is a Liquid crystal display which displays the following information. a. SYS (systolic pressure)
b. DIA (diastolic pressure)
c. PUL (the pulse) d. Time and date
e. Memory (determine the information display is from the memory) f. Error detection
g. Accuracy detection
h. Processing (a symbol to show that the equipment is taking measurement) i. Heartbeat symbol (flash at each heartbeat)
j. Deflation symbol (flash while cuff deflating)
Figure 4.7 Picture of the LCD of IA2
4. The power supply
a. It controls the pressure and the rate of the increasing pressure which the pump is producing.
b. It transmits data to the LCD to light up the specify segment. c. It receives information from the transducer
d. It processes the information from the transducer e. It store information in its memory
The microcontroller used in this equipment is TMP86CP23. This chip is manufactured by Toshiba Company and has 48k x 8 bits of ROM and 2k x 8 bits of RAM.
The features of the microcontroller include: • 8-bit single chip microcomputer
• Instruction execution time: 0.25µs - 122µs • 731 basic instructions in 132 categories • 20 interrupt sources (External 5, Internal 15) • Input/ Output ports (48 pins) (program controlled) • Output ports (3 pins)
• 18-bit timer counter: 1channel • 8-bit counter: 4 channel • Real Time counter • Time Base Timer • Divider output function • Watchdog Timer • Serial Interface
• Multiply accumulate unit (MAC) • Four key-on wake-up pins • LCD driver/controller • Dual clock operation • Nine power saving mode • Wide operating voltage
These features show that this chip’s capability far exceeds the requirement of the equipment. Most of the features are not used.
4.6 Information Retrieval
There are two possible options to achieve this task. a. Retrieve the information from the microcontroller b. Retrieve the information from the LCD
1. Option 1
Retrieving the information from the microcontroller is the initial approach in this project. This approach has two possible ways.
a. Use the Serial Interface of the microcontroller
b. Use the information in the memory of the microcontroller
Decoding the microcontroller is not an easy task as manufacturers usually enclose the microcontroller and reverse engineering of industrial or commercial product is violating the law. Hence, this approach is not selected.
2. Option 2
The objective is to understand the information from the microcontroller that transmits to the LCD to light up the segment. There are two possible areas to retrieve this information.
• The Output port of the microcontroller • The Input pins to the LCD
The Output port of the microcontroller is not a preferred choice as the pins of the
microcontroller is fairly small as each pin of the microcontroller is only 0.35 mm and by probing to these pins will damage these pins.
4.7 Characteristic of this LCD
This LCD has 34 pins and required a continuous supply of signal. Each segment of the LCD depends on a pattern of one or more segment output signal and a pattern of common output signal.
4.8 Output of the microcontroller
4.8.1 LCD driving methods
The microcontroller can provide 5 types of driving method 1. 1/4 duty (1/3 bias)
2. 1/3 duty (1/3 bias) 3. 1/3 duty (1/2 bias) 4. 1/2 duty (1/2 bias) 5. Static
[image:50.612.123.476.325.565.2]The driving method of the driver will affect the frequency and the drive voltage for the LCD.
Figure 4.8 The waveform of 1/4 duty (1/3 bias)
For instance, figure 4.2 shows a 1/4 duty (1/3 bias) waveform.
The Duty refers to the frequency of the waveform.1/4 indicates that the value 4 is the VLCD
0
-VLCD
Duty Bias
The bias refers to the changes of the voltage. 1/3 indicates that there can be 3 level of voltage. The waveform will be fall under six different section of voltage.
The microcontroller can operate under 5 different High-frequency clocks which are 16MHz, 8MHz, 4MHz, 2MHz and 1MHz and 1 Low-frequency clock which is 32.768kHz.
The voltage level of the LCD depends on the application of the driving method. The VLCD must work within the range of VDD and VSS which is between 0V to 5V. VLCD is the working voltage of the signal to the LCD, VDD is the operating voltage of the LCD and VSS is the ground.
Common outputs are consistent signal used for the LCD as a referencing signal. Hence, the status of the Segment is directly dependant on the waveform of the Segment outputs.
4.8.2 Operation of the LCD
Frequency COM3 COM2 COM1 COM0
1/4 Duty Used Used Used Used
1/3 Duty Not Used Used Used Used
1/2 Duty Not Used Not Used Used Used
Static Not Used Not Used Not Used Used
Table 4.2 Relation of frame frequency and Common output port
4.9 Waveform from the input of the LCD
Waveform from the input of the LCD can be achieved by using an oscilloscope. One end of the oscilloscope is connected to the pin of the LCD and the other is connected to the ground of the equipment. This process is repeated four times on all the 34 pins and the reading are recorded in a table in appendix B. The table contains the voltage level in each two duty cycle with columns as the two duty cycle and rows as the number of the pin. In each reading, the display on the LCD is also recorded.
4.9.1 Characteristic of the waveform
The waveform repeated after 2 duty cycle which mean that each data is 2 duty cycle. This shows that the microcontroller is using 1/4 duty for the frame frequency.
The waveform has 3 voltage levels which shows that the microcontroller is using 1/3 bias.
4.10 1/4 duty (1/3 bias) driving method
After the driving method of the microcontroller has been identified, a step is taken farther to derive the segments that are required to produce a numerical figure and the Segment output that produce these numerical figure and study the waveform characteristic of 1/4 duty (1/3 bias) driving method.
4.10.1 The segments required to produce a numerical figure
1/4 duty (1/3 bias) drive uses 2 segment outputs and 4 common outputs to control the display of a figure. Each segment output control four segments and each common output controls two segments. This combination of control will produce eight combination of relation between a segment output and a common output. The relation between each segment output with a common output will control the status of each segment. In each numerical figure there are seven segments and a dot. The dot display is not used in this equipment.
COM0
COM1
COM2
COM3
SEG0
[image:53.612.150.461.465.683.2]Figure 4.3 shows the relationship between common output with segments and segment output with segments. For instance, segment 1 is controlled by common put 0 (COM0) and segment output 0 (SEG0).
Figure 4.10 Labelling of the segment of the display figure
Segments Segment outputs Common outputs
a SEG0 COM0
b SEG1 COM0
c SEG0 COM1
d SEG1 COM1
e SEG1 COM2
f SEG0 COM2
g SEG1 COM3
h SEG0 COM3
Table 4.3 The relationship between the segment outputs, common outputs and the segment
Figure 4.4 shows the segment of the display figure and table 4.4 summaries the
relationship between the common output with the segments and segment output with the segments.
a
b
c d
e f
Figure 4.11Labeling of the segment of the display figure
Numerical
figures Segment
a b c d e f g h
0 1 1 1 0 1 1 1 0
1 0 0 1 0 0 1 0 0
2 1 0 1 1 1 0 1 0
3 1 0 1 1 0 1 1 0
4 0 1 1 1 0 1 0 0
5 1 1 0 1 0 1 1 0
6 1 1 0 1 1 1 1 0
7 1 0 1 0 0 1 0 0
8 1 1 1 1 1 1 1 0
9 1 1 1 1 0 1 0 0
. 0 0 0 0 0 0 0 1
0 = Not Used, 1 = Used
Table 4.4 Relation of the segment to the numerical figures
Table 4.4 shows the required segments to display a numerical figure. For instance, to display a ‘1’ in the LCD, segment c and segment f will have to light up.
a
b
c d
e f
4.10.2 Waveform from the Segment Output
There are two focuses in the waveform from the Segment Output. 1. The frequency of the waveform
2. The different level of voltage of the waveform
Figure 4.12 The period and voltage level of the waveform of a 1/4 duty (1/3 bias)
4.10.2.1 The combination of the waveform
Status of each Segment of the display figure will depends on the combination of the segment output and the common output. This can be derived be taking common output minus segment output. When the common output minus segment output, the voltage that achieve VLCD or -VLCD indicates that segment is lighted up.
2ms 3.6V
1.2V 2.4 V
Figure 4.13 Waveform of common output minus segment output (selected and non-selected) Common output - Segment output
(Selected) 3.6V
1.2V 2.4V
0V
Common output - Segment output (Non-Selected)
-1.2V
-3.6V -2.4V
3.6V
1.2V 2.4V
0V -1.2V
When the common output minus segment output, voltage levels cancel each other and produce another waveform. It also changes the range of voltage level from a 0V to VLCD to range of voltage level from VLCD to -VLCD. For instance, in 1/4 of a duty cycle the voltage level of common output is 3.6V and the voltage level of segment output is 0V, the waveform will be at voltage level 3.6V. Taking another example, in 1/4 of a duty cycle the voltage level of common output is 0V and the voltage level of segment output is 3.6V, the waveform will be at voltage level -3.6V. Both the instances above are able to achieve VLCD or -VLCD. When VLCD or -VLCD is achieved, the output will produce logic ‘1’. Whereas when VLCD or -VLCD is not achieved, the output will produce logic ‘0’. A pulse is generated with a change in the logic level and a continuous pulse will light the segment. On the other hand, a pulse is not generated when the output remains at logic ‘0’. This is because when the common output minus segment output, it is not able to achieve VLCD or -VLCD.
4.11 Conclusion
Chapter 5
Interface Circuit
5.1 Introduction
After understanding the signal from the input of the LCD, this chapter will illustrate the circuitry required to transmit the information to the computer. Two important factors will be discussed throughout the chapter that is the frequency and the voltage level. The objective of the circuitry is to convert the parallel signal of the LCD to a series signal transmit to the computer at same frequency.
5.2 Expectation of the circuitry
The interface circuit is required to convert LCD signal to the computer’s receiving level. It required the signal from many output to be converted to one series signal. To achieve this, there are two important factors to consider:
In this project, there are four steps taken for the development of these circuits. 1. Select the peripheral to communicate with the computer
2. Convert different voltage level to uniform voltage level 3. Convert the parallel signal to a single serial signal
4. Adjust the frequency to suit the frequency of the computer
5.3 Selection of the communication with the computer
Firstly, selection of peripheral to communicate with the computer is essential. The types of techniques of communicating with the computer are:
1. RS-232 2. Parallel port 3. USB port 4. Infrared red
5. Wireless communication 6. Modem
7. LAN communication
5.3.1 RS-232
The electrical characteristics of RS-232 define the minimum and maximum voltages of logic ‘1’ and ‘0’. Logic ‘1’ is about -12V and logic ‘0’ is about +12 V. Any voltage between is considered an indeterminate logical state. If there is no pulse present on the line then the voltage level is equivalent to a high level which is -12V.
There are 2 types of connectors for RS-232 1. DB9S (9 pins)
2. DB25S (25 pins)
DB25S is the actual standard for RS-232 but nowadays most computers are using the DB9S connector as DB9S is sufficient for serial data transfer. In most computer there is at least a serial communication which usually known as COM1. Figure 5.1 show the relation of the pins and the signals.
Figure 5.1 RS-232 DB9S interface
In this project, ‘no handshake communication’ technique is used. This technique requires less hardware. In ‘no handshake communication’ technique, there are two assumptions, no lost of data during communication and all data is successfully transferred during the
5 4 3 2 1
9 8 7 6
transmission. The no handshake technique required only 3 pins for the transfer of data, the Rx, Tx and GND. Rx is the receiving pin, Tx is the transmitting pin and GND is the ground. Figure 5.2 shows the connection between the computer and the interface hardware.
Figure 5.2 The connection between the computer and the interface hardware (no-handshake technique)
5.3.2 Hardware interfacing required by serial port
Due to the different in the working voltage level, the RS-232 required a voltage levelling build up between the interface circuit and the computer.
There are three possible methods of levelling the voltage: 1. Use a single chip Transmitters/Receivers
2. Use a Transmitters chip and a Receivers chip 3. Use Transistor and operational-amplifier
In this project, a single chip Transmitters/Receivers is a better option. The cost between the three methods is minor.
Tx Rx GND
Rx Tx GND 2
3 5 3
2 5
signal is inverted. Figure 5.3 shows a typical connection of a RS-232 Transmitter/Receivers IC which will be used in this project.
Figure 5.3 A typical connection of a RS-232 Transmitter/Receivers IC
Figure 5.4 A picture of the RS-232 Transmitter/Receivers IC 1 3 4 5 11 10 12 9 C1+ C1- C2+ C2- T1in T2in R1out R2out V+ V- T1out T2out R1in R2in 2 6 14 7 13 8 Vcc GND 16 15 GND 5V
1µF
1µF
1µF 1µF
[image:63.612.142.471.386.636.2]5.4 Convert different voltage level to uniform working voltage
The signal from the input of the LCD has four different levels of voltage, 0V, 1.2V, 2.4V and 3.6V which are shown in figure 5.4. These four levels of voltages are required to be converted to component working voltage which is 0V and 5V.
Figure 5.5 A possible signal from the input of the LCD
To convert the signal above, the signal will be spilt into three signals.
A reference voltage will chop between the differences in the voltage level. Voltage level that is above the reference voltage level will produce Logic ‘0’.Whereas the voltage level that is below the reference voltage level will produce Logic ‘1’.
Voltage reference Signal Voltage Output Voltage Logic
0V 5V ‘1’
1.2V 0V ‘0’
2.4V 0V ‘0’
Between 0V to 1.2V
3.6V 0V ‘0’
3.6V
1.2V 2.4 V
0V
2.4V 0V ‘0’
3.6V 0V ‘0’
0V 5V ‘1’
1.2V 5V ‘1’
2.4V 5V ‘1’
Between 2.4V to 3.6V
3.6V 0V ‘0’
When the signal voltage is below the voltage reference, the output voltage will be 5V.
When the signal voltage is above the voltage reference, the output voltage will be 0V.
Table 5.1 Relation between signal voltage, output voltage and logic with voltage reference
To accomplish voltage levelling, two small circuit need to be developed. 1. Power supply with four different voltage levels
2. Voltage comparator
5.4.1 Power supply
The power supply required to produce three different level of voltage. The first voltage level is 5V which is the working voltage level for all components. The other three voltage levels act as a voltage reference for the voltage comparator. The mean of the different between the voltage levels of the signal will be the voltage reference which is 0.6V, 1.8V and 3V. The connection is shown in figure 5.5.
R1 R2 R3 R4
9V 7805
0.6V 1.8V
3V GND
The R1, R2, R3 and R4 are resistors value to achieve the voltage level. Figure 5.6 shows the circuitry of the resistors.
Figure 5.7 Circuitry of R1, R2, R3 and R4
Figure 5.8 A picture of power supply circuit
The power source of the interface circuit is 6 ‘AA’ batteries. These 6 batteries will produce 9V which the 7805 chip requires (at least 7V).
100kΩ
Co
100kΩ
50kΩ
5.4.2 Voltage comparator
Voltage comparator uses a voltage reference to determine the status output voltage. There are 2 types of component can be used as voltage comparator:
1. Operational amplifier 2. Comparator
Table 5.2 shows the voltage comparator with the IC code and description.
Components IC Code IC description
LM741 General purpose op-amp
LM747 Dual op-amp
LM1458 Dual op-amp
LM748 Op-amp
LM3900 Quad op-amp
NE5534N Low- noise op-amp NE5534AN Ultra low-noise op-amp
LM4136 Quad High performance op-amp Operational amplifier
LM4558 Dual High performance op-amp LM393 Low power dual comparator LM311 Voltage comparator
LM339 Quad low- power comparator Comparator
Figure 5.9 Circuitry of voltage comparators using operational amplifier
The connection of the op-amp is shown in figure 5.7 but both operational amplifier and comparator have similar problems. They are not able to work with voltage level below 1V which mean it is difficult to detect differences in the voltage level between 1.2V and 0V. 1.2V might be higher than 1V but the difference between 1V and 1.2V is small. Practically, due to input offset voltage, current leaking and response time of the
component, the voltage comparing will fail. Input offset voltage can be compromise by using operational amplifier. Modification to the voltage comparator circuit is required to countermeasure for current leaking and response time. One possible solution is to deal
0V I/p waveform from
the equipment -
+
- +
- + Signal
GND 5V
O/p 1
O/p 2
O/p 3 Op-amp 1
Op-amp 2
Op-amp 3 0.6V
3V
circuitry. The input signal from the LCD will have to push the voltage level to 1.5V.To achieve this, there are 2 possible methods:
• Use a transistor • Use an amplifier IC
[image:69.612.98.454.246.505.2]Transistor will be preferred as it is much cheaper than the amplifier IC. Figure 5.8 shows the connection of the transistor which will be used in this project.
Figure 5.10 Circuitry of voltage comparators using operational amplifier with transistor
Figure 5.11 A picture of voltage comparators using operational amplifier with transistor
5.5 Convert the parallel signal to a single serial signal
There are 33 signals from the LCD and after the processing by the voltage comparators the number of signals increased to 99. This amount of signal is required to convert from parallel to series. There are three methods of converting parallel to series:
1. Use a parallel to series IC
2. Use a microcontroller with at least 99 inputs 3. Use flip flop
But none of the methods above can achieve the conversion. The combination of two or more of the methods is required to achieve the task. Method 1 and 2 is the best
Figure 5.12 Circuitry of the parallel to series IC 74HC165
A parallel to series IC will help reduce the number of inputs to the microcontroller. 74HC165 is a parallel to series converting IC. This IC required a constant period of pulse (Constant pulse 1) and another pulse that is three times faster than the constant pulse (Constant pulse 2). Constant pulse 1 will be connected to CP which will be used to clock the transmission of the output. Constant pulse 2 will be connected to Ds which will be used to select the receiving of the bit. The circuitry of 74HC165 is shown in figure 5.9.
Microcontroller is another component that can be used to convert parallel signal to serial signal. The signal will be connected to the ports of the microcontroller and transmitted using a program. Details will be discussed in section 5.7.
D0 D1 D2 D3 D4 D5 D6 D7 PL DS Q7 Q7
CP CE 11 12 13 14 3 4 5 6 1 9 7 Constant pulse 1 Microcontroller O/p from
Op-amp Pull up
5.6 Adjust the frequency to suit the frequency of the computer
Frequency is in fact the most important aspect of the signal processing. There are three important factors to be considered:
1. Frame format of transmission
2. The frequency of the signal from the input of the LCD 3. The frequency of the computer is receiving data
The frequency of the signal from the input of the LCD is different from the rate computer is receiving data. The frequency of the input of the LCD must be close to the frequency of the computer receiving rate to reduce the error generated during transmission.
5.6.1 Frame format of transmission
All transfer of data of a circuit with external source will required a standard of
confirmation. RS-232 with no handshake uses three bit as confirmation. These three bits are start bit, stop bit and parity bit shown in figure 5.9. These three bit will enclosure a set of data to be transmitted.
Figure 5.13 RS-232 frame format Logic ‘1’ Logic ‘0’ S ta rt b it S to p b it P ar it y b it 1
0 0 0 0
1 1 1
5.6.2 The frequency of the signal from the input of the LCD
Figure 5.14 The period of the waveform of a 1/4 duty
The time interval between each triggering point of the input signal is 2ms which mean the rate of transmission of the signal is 2ms per bit. In each data, there is 8 bit. Then the total period is 16ms.
5.6.3 The frequency of the computer is receiving data
The baud rate of the computer receiving data can be selected using the 300, 1200, 2400, 9600, or 19200. The microcontroller required a baud rate of 1500 to transmit 11 bit of per data. This baud rate is not a standard baud rate of the computer receiving data. A higher baud rate is required. 2400 baud rate is the next better choice but the difference between 1500 and 2400 baud rate is not much. Hence, 9600 is a preferred baud rate for the transmission.
Microcontroller is usually a suitable way of changing the frequency of the signal. This is because microcontroller can accommodate different frequency of input and transmit in another frequency. The receiving and transmitting of the signal using a microcontroller can be controlled using the program. The only disadvantage is the cost.
2ms 5V
5.7 Microcontroller
Due to time constraint, the development of the microcontroller is incomplete. The development of the microcontroller is connected between the RS-232 circuit and the signal processing circuit. The microcontroller is used to receive the signal from the signal processing circuit at 16ms per duty cycle and transmit to the computer at 9600 baud rate. The development of the microcontroller involves the following steps:
1. The selection of the microcontroller 2. The connection of the microcontroller 3. The programming of the microcontroller 4. The testing of the microcontroller
5.7.1 Selection of microcontroller
There are three features require of the microcontroller: 1. With a serial interface to the computer
2. With at least 3 input port 3. With internal timer
The 16PIC628 microcontroller has the above features and in addition, this
Figure 5.15 A picture of the microcontroller 16PIC628A
5.7.2 The connection of the microcontroller
The connection of the microcontroller involves only three steps:
1. The 3 op-amp output is connected to the port B of the microcontroller from PB4 to PB6
2. The Rx, Tx and the Gnd from the serial cable from the computer are connected to the Tx, Rx and Gnd of the microcontroller.
Figure 5.16 Circuitry of the microcontroller 16PIC628A
Figure 5.17 A picture of the microcontroller 16PIC628A programmer circuit
5.7.3 The programming of the microcontroller
The programming of the microcontroller required much time due to the limitation of the programming instruction type and the program instruction. Hence, the development of
1 2 3 4 5 6 7 8 9 18 17 16 15 14 13 12 11 10 VDD RB6 RB5 RB4 VSS Rx Tx Gnd Tx Rx 5V
1. Clear the ports (A and B) 2. Turn off the comparator 3. Enable the pin
4. Configure port B as output
5. Turn on the interrupt of port B (RBIF interrupt) 6. Turn on the USART (Tx)
7. Set the baud rate of transmission 8. Turn on the USART (Rx)
The main program includes two routines: 1. The routine to receive the signal 2. The routine to transmit the signal
The frequency involves in the signal receiving and the frequency to transmit is different. This requires a timer (Timer 0) and the RBIF interrupt. The interrupt is activated when there is a change of status in the signal received from the input of the op-amp. The timer is used when there is no change of state from the input of the op-amp.
5.8 Problem encountered and Recommendations
There are three problems encountered in the development of the interface circuit that contribute to the incompletion of the project.
Problem 1
achieve the full interface circuit. These have not included the parallel to serial IC that is required to convert parallel to serial which is then connect to the limited amount of microcontroller.
Solution
The development of the signal processing circuit is reduced to using only 3 op-amps which is connected to a pin. This reduced circuit serves as a prototype for the actual circuit.
Problem 2
The time required to develop the microcontroller is longer then expected. This is due to: 1. The microcontroller used for the project required a different set of program
instruction.
2. The program instruction of the microcontroller is limited. It increases the difficulty of writing the program. For instance, the program instruction does not have a compare instruction that the comparison of a byte with another byte. Instead, the program uses a bit detection instruction that check for only a bit in a byte. The program instruction also does not have a condition branch. Instead, it has a definite branch.
Solution
Problem 3
The development of the circuit between the microcontroller and RS-232 IC has not completed. The RS-233 is used to connect between the microcontroller and the computer. Solution
The RS-232 circuit is developed using the MAX-RS-232 with 5 1µF capacitors. A
simulation of the RS-232 circuit is made using a pulse generator to transmit a signal from the input of the RS-232 and this signal is acknowledged by a test program of the RS-232 in the computer.
5.9 Testing of the circuitry
Many parts of the system are affected by the incompletion of the interface circuit. Testing is developed in each individual area to test the functionality of each area. The testing includes:
1. The testing of the power supply
Testing is carried out using a voltage meter and measure the voltages of the output of the power supply created using 7805 and resistors.
2. The testing of the signal processing
Testing is carried out in the output of the op-amp and observed the waveform using an oscilloscope.
3. The testing of the RS-232 circuit
the computer via