City, University of London Institutional Repository
Citation
:
Kusev, P., Ayton, P., van Schaik, P., Tsaneva-Atanasova, K., Stewart, N. & Chater, N. (2011). Judgments Relative to Patterns: How Temporal Sequence Patterns Affect Judgments and Memory. Journal of Experimental Psychology, 37(6), pp. 1874-1886. doi: 10.1037/a0025589This is the accepted version of the paper.
This version of the publication may differ from the final published
version.
Permanent repository link:
http://openaccess.city.ac.uk/17789/Link to published version
:
http://dx.doi.org/10.1037/a0025589Copyright and reuse:
City Research Online aims to make research
outputs of City, University of London available to a wider audience.
Copyright and Moral Rights remain with the author(s) and/or copyright
holders. URLs from City Research Online may be freely distributed and
linked to.
City Research Online: http://openaccess.city.ac.uk/ [email protected]
Running Head: JUDGMENTS RELATIVE TO PATTERNS
JUDGMENTS RELATIVE TO PATTERNS: HOW TEMPORAL SEQUENCE
PATTERNS AFFECT JUDGMENTS AND MEMORY
Petko Kusev - Kingston University London/City University London Peter Ayton - City University London
Paul van Schaik - Teesside University
Krasimira Tsaneva-Atanasova - University of Bristol Neil Stewart - University of Warwick
Nick Chater - Warwick Business School
Correspondence concerning this article should be addressed to Petko Kusev, Department of Psychology,
Kingston University London KT1 2EE, United Kingdom E-mail: [email protected]
JUDGMENTS RELATIVE TO PATTERNS: HOW TEMPORAL SEQUENCE PATTERNS AFFECT JUDGMENTS AND MEMORY
Abstract
Six experiments studied relative frequency judgment and recall of sequentially presented items drawn from two distinct categories (i.e., city and animal). The experiments show that judged frequencies of categories of sequentially encountered stimuli are affected by certain properties of the sequence configuration. We find (a) a first-run effect whereby people overestimated the frequency of a given category when
that category was the first repeated category to occur in the sequence and (b) a dissociation between judgments and recall; respondents may judge one event more likely than the other and yet recall more instances of the latter. Specifically, the distribution of recalled items does not correspond to the frequency estimates for the event categories, indicating that participants do not make frequency judgments by sampling their memory for individual items as implied by other accounts such as the availability heuristic (Tversky & Kahneman, 1973) and the availability process model (Hastie & Park, 1986). We interpret these findings as reflecting the operation of a judgment heuristic sensitive to sequential patterns and offer an account for the relationship between memory and judged frequencies of sequentially encountered stimuli.
We often attempt to understand and make inductions about temporal sequences of events (e.g., busy and quiet business days, people’s good and bad moods, sunny and rainy days). A long history of research analyzes how people reason about the
processes underlying sequences and how they anticipate individual events in a sequence (see reviews in Ayton & Fischer, 2004; Kusev, van Schaik, Ayton, Dent & Chater, 2009; Oskarsson, van Boven, McClelland & Hastie, 2009; Sedlmeier & Betsch, 2002). Extensive research has also investigated memory for - and judgment of - the frequency of events encountered in temporal sequence (cf. Brown, 1997; Hasher & Zacks, 1979, 1984). Sensitivity to the frequency of events is crucial for judgments and decisions concerning uncertain payoffs or threats. However, very little research has explored if and how the ordering of different sorts of item in a sequence affects judgments and choices about those items. The goal of this article is to address this lacuna: we gather evidence that simple strategies effectively exploit sequence properties to compensate for the processing-capacity limitations underlying memory and judgment.
Other accounts, related to the dual-processing theory of automatic and controlled processing (e.g., Schneider & Chein, 2003; Schneider & Shiffrin, 1977), propose that frequency information is automatically encoded with minimal demand on attentional resources (Zacks & Hasher, 2002), independently of ability to subsequently recall individual instances. In support of this view studies of the judged frequency of stimuli have established both that people are highly sensitive to the frequency with which events occur and that frequency information appears to be processed with little effort or constraint by cognitive-capacity limitations (e.g., Hasher & Zacks, 1979). Such theories can be read as implying that memory for individual events and judgment of their frequency might be empirically dissociated.
Here we present evidence that, in order to judge frequency, people can make use of a capacity saving heuristic which, unlike availability, does not depend on recall of individual events. We develop our characterization of this approach later in the paper but essentially it assumes that people note simple patterns in sequences of stimuli to estimate the frequency of different types of stimuli. A number of strands of research are consistent with the idea that the recognition and identification of stimuli and the judgment of their attributes may be influenced by strategies that refer to previous stimuli in a temporal sequence.
Several prominent cognitive theories of the identification and perceptual
established that the presentation order in which a series of events is experienced has a measurable influence on recognition judgments for categories of items; specifically, recognition accuracy for a set of items is enhanced if successive stimuli are similar to each other rather than different. Recent research also shows that the preceding items in a sequence can affect judgments of a single subsequent stimulus, supporting the claim that judgments of properties of stimuli (i.e., loudness and brightness) are made relative to their current context and are not in any sense absolute (Lockhead, 1992, 2004; Stewart & Chater, 2002; Stewart, Brown, & Chater, 2002, 2005). Accordingly, we test the assumption that judgments are relative by examining whether sequence patterns induce measurable biases in judgment. Specifically, in this article, we investigate the theoretical case and the empirical case for one possible strategy by which people might estimate frequency without remembering individual items. We explore evidence for the possibility that people may use a frequency estimation strategy that utilizes information about the sequence pattern. The rationale for this idea is based on the assumption that, in making frequency judgments, people are constrained by information-processing and memory limitations and hence have a propensity for strategies which minimize cognitive load. A possible strategy fitting this requirement is to exploit simple patterns or characteristics of the sequence that may be indicative of frequency (cf. Chater, 1996).
type of stimulus, that stimulus type was likely to be more preponderant in the sequence.
In short, our suggestion is that, in the interests of cognitive economy, people note the category of outcomes exhibiting the first run in the sequence and then
provisionally assume this to be more frequent. As a function of this inference, monitoring of subsequent events in the sequence would be accorded less attentional resource; hence, the strategy makes a quick estimate, trading accuracy against effort (cf. Johnson & Payne, 1985). Of course, for those sequences where the category with greater relative frequency is not signalled by the first run, there will be error.
There is evidence that, in their efforts to anticipate future events, people develop expectations about sequences by monitoring emerging patterns - including runs (e.g., Ayton & Fischer, 2004). If judgments of frequency are informed by the sequence configuration, rather than by consulting memory for the individual items, it follows that judgment of the frequency of types of item in a sequence and a respondent’s recall of the number of individual items of each type in the sequence could be dissociated. Such a finding would be inconsistent with those theories which predict that frequency is assessed according to the ease with which instances/occurrences can be brought to mind (e.g., Hastie & Park, 1986; Hertwig, et al, 2005; Tversky & Kahneman, 1973, 1974).
Summary of Experiments
In order to analyze people’s ability to judge the relative frequency of stimuli experienced in sequence, we have developed a frequency identification task where participants make judgments of binary-category frequency (where binary categories are defined by stimulus variation in, e.g., shape, color or tone). Although our focus on binary sequences is illustrative,many sorts of complex event can be conveniently treated as binary outcomes (Oskarsson et al., 2005). Six experiments explore the hypothesis that frequency judgments, across different perceptual modalities are influenced by the presence of certain configurations of sequences that do not
influence free recall. Specifically, we investigate how the presence of the first run of a stimulus type affects judgments of the relative frequency of the different types of stimuli in a sequence (Experiments 1, 2, 3, 4 and 5). Experiment 6 investigates whether memory for individual sequence items is dissociated from judgments of their relative frequency.
Experiment 1
Method
Participants
Participants were seventy-eight students (32 female, 46 male) from City University London and University College London. Mean age was 22 (SD = 3.07). They took part individually and each received payment of £3.
Stimuli and Equipment
One set of thirty stimuli was produced by generating fifteen different checkerboard patterns in each of two colors (see Figure 1) such that we had 15 red and 15 green stimuli; a second set of forty two stimuli was similarly produced by generating 21 checkerboard patterns reproducing each pattern in red and green versions. One group of participants (n = 46) viewed the first set of thirty stimuli sequentially one at a time; a second group of participants (n =32) viewed the second set of forty two stimuli sequentially one at a time. For each individual participant a sequence was generated by randomly sampling stimuli without replacement from one of the sets of stimuli; therefore, each individual stimulus appeared just once in the sequence. Stimuli were presented to each participant on a 17-inch screen. A computer program for generating and presenting the stimuli was employed.
Design and Procedure
about the nature of the stimuli other than that they would be viewing checkerboard patterns.
Before the experimental trials began, two example stimuli - one sampled from each category (red and green checkerboards) - were presented sequentially to participants for a self-paced period, up to a maximum of 5 seconds. Example stimuli were used again in the main presentation. During presentation of the experimental trials, respondents were not required to make any explicit judgments of the stimuli; presentation of each stimulus was again self-paced via the computer keyboard and there was no limit on how much time participants could spend observing each stimulus. No interval was given between the participants’ key press and the appearance of the next stimulus.
Respondents were presented with one sequence of stimuli and then, immediately after the sequence had been presented, they were explicitly asked, via a visual message on the computer screen, to make one judgment of the frequency of one of the stimulus categories experienced in the sequence as a percentage. The target category was systematically varied so half the time it was red and green for each sequence. If participants were accurate in their judgment, then their responses should be 50% - the actual frequency of the two categories (red and green checkerboards).
Results and Discussion
All statistical tests reported in this article used a significance level of .05 unless indicated otherwise. The effect of response category (red or green) was not
significant, t (76) = 1.58, p > .05. Correlation and regression analysis were conducted to establish the effect of sequential patterns on frequency judgment. After controlling for response category, we computed correlations of judged frequency with 11
the last run, and sequence length (see Appendix 1). With respect to the first run, nine sequence characteristics were significantly correlated with judged frequency: first-run category (r = .48, p < .001), the length of the first run category (r = .38, p < .001), the number of runs of the first-run category (r = .48, p < .001), the number of runs of the non-run category (r = .48, p < .001), the number of single instances of the first-run category (r = .39, p < .001), the number of single instances of the non-first-first-run category (r = .40, p < .001), the number of single instances of the non-first-run category before the first run (r = .25, p < .05), the average run length of the first-run category (r = .46, p < .001), and the average run length of the non-first-run category (r = .48, p < .001). Note that some of these correlations are contingent on other correlations, but sequence characteristics were not perfectly correlated. For example, given an equal number of stimuli of both categories, a higher number of single instances of the first-run category implies a higher number of single instances of the non-first-run category. The remaining 14 characteristics including the 11
experiments in which the characteristics of the first run are experimentally
manipulated and their effect on frequency judgment observed for a range of different kinds of stimulus.
In Experiment 2 we investigate the generality of the first-run effect by testing for its occurrence in sequences differing in length, length of first run, number of first runs, starting position of the first run, type of stimulus (tone, colour, shape) and category of the first run. Rather than using random sequences we systematically designed sequences that enabled us to infer the influence of specific properties of the sequence on frequency judgments.
Experiment 2A
Experiment 2A was designed to investigate whether we could observe the first-run effect in a different modality; specifically, we examined how judgments of the
relative frequencies of two categories of auditory stimuli in a sequence depend on the pattern of events within the sequence.
Method
Participants
Participants were ninety-six students (55 female, 41 male) from City University London and University College London. Mean age was 22 (SD = 4.48). They took part individually and received a payment of £3.
Stimuli and Equipment
Two sequences each comprising 28 simple auditory stimuli - 14 “high” and 14 “low” sine-wave tones per category - were used in this experiment. For the low category, the tones varied in frequency between 300 Hz to 320Hz; for the high category the tones varied in frequency between 640Hz to 683Hz. Within each
immediately lower in frequency, and thus, within each category, the tones were equally spaced on a log-frequency scale. One sequence consisted of a pattern where the first run (repeated type of stimulus) was comprised of low tones and the other sequence consisted of a pattern where the first run was comprised of high tones.
The main features of both sequences were that (a) there were equal numbers of low and high stimuli and (b) the sequential order of low and high stimuli followed the pattern shown in Table 1. For both sequences, the particular stimuli from each category (high or low) were randomly sampled without replacement from the set of stimuli comprising each category, each individual tone frequency appearing once in the sequence. As shown in Table 1, the first run in the sequence appeared after the first single stimulus in the sequence and consisted of a run of seven stimuli. A computer program for generating and presenting the stimuli was employed.
Design and Procedure
The experiment used a 22 independent measures design. The first independent variable was the pitch of the category with the first run, with levels low and high (see Stimuli and Equipment above). Each respondent was presented with one of two different sequences of stimuli - either a sequence where the first run was comprised of high tones, or a sequence where the first run was comprised of low tones (see Table 1). The second independent variable was the response category for the relative frequency judgment - respondents were asked to judge the relative frequency of just one of the two types of stimulus - with two levels: high and low. The dependent variable was the frequency judgment of one of the categories (high or low).
about the nature of the stimuli other than that they would be listening to low and high tones.
In advance of the experimental trial, two example stimuli - one sampled from the mid-range of each category - were presented to participants for a self-paced period, up to a maximum period of 5 seconds. During the experimental trial respondents were not required to make any explicit judgments of the stimuli; presentation of each stimulus was again self-paced via the computer keyboard and there was no limit on how much time participants could spend listening to each stimulus. As each tone lasted until a participant responded to initiate the next tone, the duration of each tone was determined by the respondent. After the participants had responded there was a 500-ms pause/interstimulus interval (after the offset of the tone) before the next trial began. Participants were presented with one sequence of stimuli and then,
immediately after the sequence had been presented, they were explicitly asked, via a visual message on the computer screen, to make one judgment of the frequency of one of the categories of stimuli events experienced in the sequence and to indicate the proportion as a percentage. If participants were accurate in their judgment, then their responses should be 50% - the actual frequency of the two categories (low- and high-frequency tones).
Results and Discussion
interaction effect3. Because none of these effects were significant, we collapsed the data across these factors to simplify assessment of the judgments. The category containing the first run was estimated (mean value, SD) as occurring with a frequency of 58.5% (12%) - significantly greater than the actual frequency of 50%, t (47) = 4.77, very large effect size r = .57, p < .001; the other (non-first run) category was estimated (mean value, SD) as occurring with a frequency of 43.5% (8%) -
significantly less than the actual frequency of 50%, t (47) = 5.49, very large effect size r = .63, p < .001.
The results from Experiment 2A are consistent with our conjecture that the pattern of experienced simple perceptual stimuli affects people’s judgments. The first repeated type of stimulus affected participants’ frequency identification; although the actual frequencies of the two categories from which stimuli were presented were equal, respondents judged that the category corresponding with the first run was more preponderant than the non-first run category. We call this phenomenon the first-run effect.
We speculate that the first-run effect reflects the operation of a judgment heuristic that, unlike availability, is not dependent on recall of individual events; thus, a person attempting to infer the relative frequency of events within binary sequencescould use the first run as a simple heuristic method for judging the relative frequency of the different categories. As we noted above, such a strategy would have the dual virtues of generating judgments with some validity whilst requiring minimal cognitive resources.
Experiment 2B
before, we expected a first-run effect but we used different sequences than those used in Experiment 2A - this experiment uses an increased number of stimuli (42) and systematically varied the length of the first run.
Method
The method was similar to that of Experiment 2A. However, there were 21 “high” and 21 “low” simple auditory stimuli per category (low-category range: 300 Hz to 331 Hz; high-category range: 640 Hz to 707 Hz). Each of the four sequences that were used comprised three runs, and the first and last run were from the same
category. The experiment used a 2 (category with the first run) 2 (length of the first run: 6 or 15) 2 (response category for frequency judgment) independent measures experimental design (see Table 1). One hundred and twelve undergraduate and postgraduate students from City University London and University College London took part in the experiment. Ages ranged from 18 to 30 years (68 female, 44 male), with a mean of 23 years (SD = 3.14).
Results and Discussion
perceptual stimuli affects people’s judgments of frequency; again the first run affected participants’ frequency judgments.
Experiment 2C
Experiment 2C was designed to confirm the influence of experienced patterns on participants’ judgments by using a different type of stimulus. The method was similar to that of Experiment 2A, but visual rather than auditory stimuli were used.
Furthermore, the sequence structure was somewhat different from that used in Experiments 2A and 2B; here the first run consisted of a run of seven stimuli and appeared after two single stimuli (see Table 1).
Method
Participants
Participants in this experiment were sixty-four students (36 female, 28 male) from University College London and City University London. Mean age was 22 (SD = 3.44). The students took part individually and received a payment of £3.
Stimuli and Equipment
Twenty-eight visual stimuli, 14 red and 14 green checkerboard patterns per
category, were used in this experiment and presented one at a time to each participant on a 17-inch screen. Two types of binary sequence were used, one sequence consisted of a pattern where the first run was green checkerboards and the other sequence consisted of a pattern where the first run was red checkerboards (see Table 1 and Figure 1).
Design and Procedure
was of red checkerboards, or a sequence where the first run was of green
checkerboards. The dependent variable was the frequency judgment of one of the categories (red or green). Stimuli of the first-run category were presented after two single stimuli in the sequence. Otherwise, the procedure was identical to that used in Experiment 2A.
Results and Discussion
Participants overestimated the frequency of the category containing the first run (M = 59%; SD = 9.5%) - significantly greater than the actual frequency of 50%, t (31) = 4.97, very large effect size r = .74, p < .001; the other (non-first run) category was underestimated (M = 43.5%; SD=9.5%) - significantly less than the actual frequency of 50%, t (31) = 3.82, large effect size r = .57, p < .001 (see Table 1). The results from Experiment 2C therefore provide evidence for (a) our conjecture that the pattern of events within a sequence affects people’s judgments and (b) the existence of the first-run effect. Participants failed to judge the categories accurately and the bias corresponded with the presence of the first run. The results of the experiment are consistent with the predicted patterns of over- and underestimation of actual frequencies; specifically, participants overestimated the category with the first repeated type of stimulus and underestimated the other category.
Experiment 2D
first run comprised eleven stimuli and occurred after three single stimuli (see Table 1).
Method
Participants
Sixty-four students (38 female, 26 male) from the University of Warwick and University College London participated voluntarily in this study. The students took part individually and received a payment of £3. Mean age was 21 (SD = 2.28).
Stimuli and Equipment
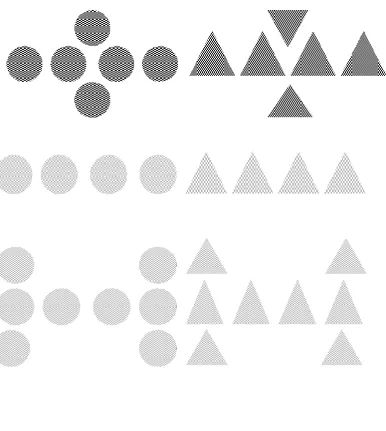
Twenty-eight visual stimuli, geometrical figures - circles and triangles - were used in this experiment (see Figure 2), presented one at a time to each participant on a 17-inch screen. The stimuli were created as pairs of identical patterns (see Figure 2).
Two types of binary sequence were used. One sequence consisted of a pattern where the first run was circles and the other sequence consisted of a pattern where the first run was triangles (see Table 1). In contrast to Experiments 2A, 2B and 2C, the two categories had the same number of runs.
Design and Procedure
Similar to Experiments 2A and 2B, Experiment 2D used a 2 (category of first run)
2 (response category for frequency judgment) independent measures design. The dependent variable was the frequency judgment of one of the categories (circle or triangle). Participants were tested one at a time in laboratory cubicles. Sixteen
participants took part in each experimental condition. The procedure was the same as that used in the preceding experiments.
Results and Discussion
of single stimuli at the beginning and at the end of the sequence was increased and those stimuli were geometrical figures, are consistent with the findings of
Experiments 2A, 2B and 2C. The category containing the first run was overestimated (M = 57%; SD = 8.5%) - significantly greater than the actual frequency of 50%, t (31) = 4.42, very large effect size r = .62, p < .001; the other (non-first run) category was underestimated (M = 44.5%; SD = 8%) - significantly less than the actual frequency of 50%, t (31) = 4.34, very large effect size r = .61, p < .001 (see also Table 1).
The results of Experiments 2A-2D consistently demonstrate a judgment bias in the frequency identification task; specifically, the sequencing of categories, in particular the first run, influenced participants’ estimates of the frequency of the stimulus types. Although both categories occurred equally frequently, the category with the first run of stimuli was overestimated and evaluated as being more frequent than the other category, which was consistently underestimated. This pattern occurred across varying types of stimuli in two different modalities and for sequences of different lengths and patterns.
Thus far respondents in all our experiments were self-paced. This feature of our procedure leaves open the possibility that the first run effect is an artifactual product of possible differences in study duration of stimuli rather than due to the sequence per se. (We are grateful to two anonymous reviewers for pointing out this possibility.)
Experiments 3A and 3B were designed to exclude this possibility and confirm the effect of the first run on participants’ judgments; in this experiment each stimulus in the sequence was presented for a fixed duration.
Experiment 3A
Participants
Participants in this experiment were forty students (29 female, 11 male) from University College London and City University London. Mean age was 23 (SD = 3.52). The students took part individually and received a payment of £3.
Procedure
Each stimulus in the sequence was presented for 3 seconds. Otherwise, the procedure was as in Experiment 2C.
Results and Discussion
Table 1 shows that, for both green and red stimuli, the mean estimates of the proportion of the first-run category were greater than 50%; for the non-first run category the mean estimates were smaller than 50%3. The category containing the first run was overestimated (M = 56%; SD = 7%) - significantly greater than the actual frequency of 50%, t (19) = 4.08, very large effect size r = .68, p < .001; the other (non-first run) category was underestimated (M = 45%; SD = 10%) -
significantly less than the actual frequency of 50%, t (19) = 2.30, large effect size r = .47, p < .05.
Experiment 3B
As in Experiment 3A, the duration of each stimulus presented in the sequence was fixed. In all other respects the stimuli, equipment and design were essentially the same as in Experiment 2D.
Participants
Procedure
Each stimulus in the sequence was presented for 3 seconds. Otherwise, the procedure was identical as in Experiment 2D.
Results and Discussion
Table 1 shows that, for both circle and triangle stimuli, the mean estimates of the proportion of the first-run category were greater than 50%; for the non-first run category the mean estimates were smaller than 50%4. The category containing the first run was overestimated (M = 58%; SD = 10%) - significantly greater than the actual frequency of 50%, t (19) = 3.60, very large effect size r = .64, p < .01; the other (non-first run) category was underestimated (M = 45%; SD = 9%) - significantly less than the actual frequency of 50%, t (19) = 2.84, large effect size r = .55, p < .05.
Experiments 3A and 3B measured the same effects reported in the earlier
experiments although respondents viewed all stimuli for a fixed period of time. We conclude that the first-run effect reported for the self-paced participants in earlier experiments is unlikely to be due to differences in study duration of stimuli.
Experiments 4A and 4B
The first-run effect found in Experiments 1, 2A-2D and 3A-3B proved to be stable over different types of stimulus and variations in the sequence pattern: stimuli
non-first-run category, (b) a shorter sequence (of 19 stimuli) was presented, and (c) the first run was only two stimuli long, following three single stimuli.
Method
Participants
One hundred and thirty-six students (85 female, 51 male) from University College London and City University London, participated individually and received a
payment of £3. Their mean age was 21 (SD = 2.47).
Stimuli and Equipment
In Experiment 4A, 19 stimuli, green and red checkerboards - 7 for the first run category and 12 for the non-first-run category, were used in this experiment (see Table 2) and presented one at a time to each participant on a 17-inch screen. The stimuli were created as pairs of identical patterns (see Figure 1). In Experiment 4B, the stimuli and equipment were the same as in Experiment 4A.
Design and Procedure
giving an estimate of how accurate people are in general .The dependent variable was frequency estimate. The procedure for both 4A and 4B was the same as that used in the preceding experiments.
Results and Discussion
The first-run effect established in Experiments 1, 2A-2D and 3A-3B was replicated in Experiment 4A, even though the experiment used unequal proportions of the two stimulus categories. The category containing the first run was overestimated -
significantly greater than the actual frequency of 37%; the non-first run category was underestimated - significantly less than the actual frequency of 63% (see Table 2). In Experiment 4B the categories were not over or under estimated (see Table 2). In sum, Experiments 4A and 4B demonstrated that the first-run effect occurs even when the first run consists of only two stimuli (following three single stimuli in the task) and even when the first-run stimulus category is less frequent than the non-first-run category.
Experiment 5
Extant research on primacy and recency effects indicates that, with a list of objects, participants are likely to remember items at the beginning and end
Method
Participants
Participants were one hundred and twenty (77 female, 43 male) from University College London and City University London. Mean age was 21 (SD = 2.68). They took part individually and received a payment of £3.
Stimuli and Equipment
Thirty stimuli, green and red checkerboards - 15 green and 15 red stimuli per category were used in this experiment (see Figure 1) and presented one at a time to each participant on a 17-inch screen. As in Experiments 1, 2C, 3A, and 4 the stimuli (checkerboards) were created as pairs of identical patterns (see Figure 1). The first ten stimuli in the task were alternating categories - red and green checkerboards followed by the category with the first run presented in the middle of the sequence (see Table 2).
Design and Procedure
A 22 independent measures design was used for sequences with a first run, with independent variables category of the first run (levels: red or green) and category of the requested frequency estimate (levels: red or green). In addition, two control conditions were included which varied in color of requested frequency estimate (levels: red or green) but with sequences created by a random process and where we disregarded the presence or category of the first run. The procedure was the same as that used in the preceding experiments.
Results and Discussion
actual frequency of 50%, with no significant results for the control conditions when the sequences were randomly generated (see Table 2). In sum, the results of
Experiment 5 demonstrate that the first-run effect occurred even when the first-run occurred in the middle of a series of stimuli - and even when a second run of the alternative category occurred at the end of the sequence, which, given recency effects in memory, might have been expected to be more prominently represented than the first run.
Experiment 6
Previous research based on the availability process model (Hastie & Park, 1986) and the availability heuristic (Tversky & Kahneman, 1973; 1974) has suggested that, because judgments are based on memory for items, judgments of item frequency are dependent on memory for those items and hence there will be a correlation between memory and judgment of items.However, our findings above suggest the possibility that, across a wide range of sequences, patterns of events could affect judgments (frequency estimation) and memory (free recall) differently. Accordingly, in
Method
Participants
Ninety-six City University London and University College London undergraduate and postgraduate students (60 female and 36 male) were recruited for the experiment. They were paid £4 and took part individually. Mean age was 22 (SD = 3.13).
Stimuli and Equipment
Thirty word stimuli -15 city names and 15 animal names - were used in this experiment (see Table 2) and presented one at a time to each participant on a 17-inch screen. The first run occurred after two initial stimuli and was comprised of seven stimuli.
Design and Procedure
Results and Discussion
In order to simplify analysis of participants’ frequency estimates/judgments, we collapsed the data across first-run categories (animal and city) for the first and second estimates. The category containing the first run was overestimated (M =59%; SD = 9%) - significantly greater than the actual frequency of 50% in the conditions with animal or city as the first-run category, with no significant difference for the control random sequences where we elicited judgments but disregarded the presence or category of the first run (see Table 2).
Four 3 (sequence) 2(category of first estimate) ANOVAs were conducted: (1) for the first frequency estimate, (2) for the second frequency estimate, (3) for the recall of the category city, and (4) for the recall of the category animal. The effect of sequence was significant for first frequency estimate, F (2, 90) = 11.00, large effect size 2 = .18, p < .001, but the effect of category of first frequency estimate, F (1, 90) = 2.87, p > .05, and the interaction effect were not, F < 1. Tukey’s HSD tests showed that both first run conditions differed from the random condition, p < .001 (see also Table 2). For second frequency estimate, the effect of sequence, F (2, 90) = 8.44, large effect size 2 = .14, p < .001, and category of first frequency estimate, F (1, 90) = 4.76, small to medium effect size 2 = .03, p < .05, were significant, but the interaction effect, F < 1, was not. Tukey’s HSD tests demonstrated that both first-run conditions differed from the random condition, p < .01 (see also Table 2).
was the effect of category of first frequency estimate, F (1, 90) = 1.34, p > .05, or the interaction effect, F < 1.
The effects of sequence on frequency judgment and the lack of any corresponding effects on recall indicate a dissociation between frequency identification and recall. Moreover, further evidence for this dissociation comes from an analysis of
correlations of performance across participants. The frequency estimate was stable, ICC = .89, F (95, 95) = 8.66, p < .001. In addition, across participants, the correlation
between the item recall of the first-run category and that of the non-first-run category was high, r = .60, p < .001, but correlations between the two measures of frequency estimate and the two measures of recall were low, -.15 < r < -.04, all p > .05.
Combined analysis of the non-random conditions shows that the correlation between recall of the first-run items (of the first-run category) and the first frequency estimate of the first run was negligible, r = -.09, p >> .05, as was the correlation between recall of the last-run items (of the non-first-run category) and the first frequency estimate of the last first run, r = .02, p >> .05. These results, therefore, show no evidence of an effect of the first frequency estimate on recall or an effect of recall on the second frequency estimate.
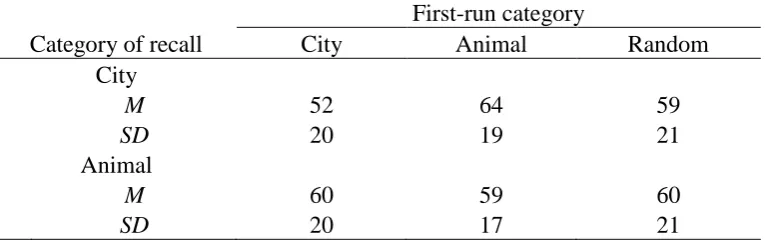
Additional evidence for a dissociation comes from further mixed ANOVA. A 3 (sequence) x (2) (category of recall) ANOVA showed a significant interaction effect F (2, 93) = 3.52, 2 = .01, p < .05, on recall, but the main effects were not significant, both F < 1. t tests showed that the effect of recall category was significant for
conditions where city was the first-run category t (31) = 2.80, large effect size r = .45, p < .01, approaching significance when animal was the first-run category, t (31) =
non-random conditions shows that 20% of variance in the total correct recall of all items was explained by the correct recall of the first-run items (of the first-run category), r = .45, p < .001, but 64% of variance was explained by the correct recall of the last-run items (of the non-first-run category), r = .80, p < .001. These results demonstrate that the category of the first run was recalled less than the non-first run category (in the case of the category city) or marginally so (in the case of the category animal) and that recall of the non-first-run category contributed much more strongly to the total recall. These results and the previous results demonstrate that frequency estimates are exaggerated for the first-run category, but recall is exaggerated for the non-first-run category, thereby indicating a dissociation between judgment and recall. Moreover, the results of our experiments indicate a first-run effect for frequency estimate, but predominantly a recency effect for recall (given that the last repeated sequence of items from the non-first-run category explain almost two thirds of variance in total recall and the first-run items only explain one fifth of variance). Therefore, frequency judgment does not have the same representational basis as the primacy effect in free recall. Rather the findings demonstrate that predominantly a recency effect (rather than primacy effect) contributes to free recall. The evidence does not support the assumption that frequency judgment is a byproduct of elaborate rehearsal which is also supposed to underlie the primacy effect in free recall.
could use the first run as a simple heuristic method for judging the relative frequency of the different categories.
As our participants did not know about the frequency estimation task until after they had experienced the sequence it is very unlikely that there was any deliberate selection of any heuristic prior to the judgment being made. Accordingly it might be reasoned that, as a result, any heuristic judgment would have to operate on the memory for relevant features of the sequence – and that therefore the first run category must presumably have some likelihood of being remembered in order to influence the judgment.
However, we do not preclude automatic activation of a heuristic (cf. Hasher and Zacks finding that frequency judgment is automatic). Moreover this does not necessarily entail that the information used by the heuristic is retained as an accessible memory. For example, participants may have made the judgment online and then forgotten the sequence characteristics they monitored to make the judgment. Nonetheless, when we asked respondents after they had experienced the sequences which was the first run category they were better than chance at this: the percentage of correct identification of the first-run category (77%) was significantly greater than 50%, 2 (1) = 7.54, p < .05. Moreover, correctness of identification was independent of first-run category,2(1) = .26, p > .05.
respondents judged one category of event as more frequent than the other and yet recalled more instances of the latter.
General Discussion
The results from six experiments show that representations of the frequencies of stimulus categories depend on the pattern of events within a sequence. The results provide evidence for a first-run effect across different sequence properties, and psychophysical characteristics of the stimuli employed in the experiments.
Specifically, we find that people overestimate the frequency of a given category of event when that category is the first repeated category to occur in the sequence - a phenomenon we call the first-run effect.
We also found evidence for a dissociation between judgments and recall
(Experiment 6); respondents may judge one category of event as more frequent than the other and yet recall more instances of the latter. Moreover, we found that
frequency judgments and memory were biased by different configurations in
sequences. Specifically, frequency judgments were influenced by the first run - while memory for individual events in the sequence was better for later items in the
sequence.
evidence for the operation of a rather different heuristic for judged frequency which, instead of using recall of individual events, uses simple patterns in sequences of events.
We see some similarities between our attempt to understand frequency judgment and research designed to investigate context effects on identification and
categorization of individual stimuli presented in sequential order. According to exemplar models of perceptual classification (e.g., Medin & Schaffer, 1978; Nosofsky, 1986), people represent categories by storing individual exemplars in memory and classify objects on the basis of their similarity to these stored exemplars, implying that identification is achieved using long-term stored representations of characteristics. Thus, exemplar models suggest that humans make judgments according to a similarity principle. Furthermore, both exemplar-based models and decision-bound models (e.g., Ashby & Townsend, 1986) - the most prominent
theories in categorization - share a common representational assumption, namely that memory of the absolute characteristics of previously perceived stimuli are available when people classify new simple stimuli or make a judgment.
However, studies of identification and categorization conducted over the past five decades have revealed people’s inability to classify or precisely estimate perceived objects independently of their preceding context (Garner, 1954; Hampton, Estes & Simmons, 2005; Holland & Lockhead, 1968; Lockhead, 2004; Medin & Schaffer, 1978; Nosofsky, 1986; Parducci, 1965; Stewart et al., 2005). These studies
demonstrate that people’s judgments (e.g., identification, categorization,
Lockhead’s theoretical review (2004) has demonstrated that the classical laws of psychophysics (Fechner’s, Weber’s and Stevens’ laws) are not general because the context (e.g., physical characteristics) of stimuli affects judgment. According to what can be described as the relative approach, this is because information-processing constraints oblige judgments to be made with very limited information. Accordingly, only the immediately preceding context is available; long-term representations are either unavailable, cannot be formed or remain unused (Stewart et al., 2005).
Our findings are consistent with the idea that people’s frequency judgments are achieved in a similar fashion insofar as they are made without recollecting individual items in the sequence and they are influenced by specific properties of the sequence configuration. In particular, we propose a simple strategy that draws minimal effort from our limited-capacity attentional mechanism whereby respondents use the first run as a cue to frequency. Our experiments demonstrated evidence for such a strategy that uses information about the sequence pattern for relative frequency estimation.
References
Anderson, N. H. (1965). Primacy effects in personality impression formation using a generalized order effect paradigm. Journal of Personality and social Psychology, 2, 1-9.
Ashby, F. G., & Townsend, J. T. (1986). Varieties of perceptual independence. Psychological Review, 93, 154-179.
Ayton, P., & Fischer, I. (2004). The hot-hand fallacy and the gambler’s fallacy: Two faces of subjective randomness? Memory & Cognition, 32, 1369-1378.
Brown, N. R. (1997). Context memory and the selection of frequency estimation strategies. Journal of Experimental Psychology: Learning, Memory and Cognition, 23, 898-914.
Brown, J. (1958). Some tests of the decay theory of immediate memory. Quarterly Journal of Experimental Psychology, 23, 12-21.
Chater, N. (1996). Reconciling simplicity and likelihood principles in perceptual organisation. Psychological Review, 103, 566-581.
Garner, W. R. (1954). Context effects and the validity of loudness scales. Journal of Experimental Psychology, 48, 218-224.
Hampton, J.A., Estes, Z., & Simmons, C.L. (2005). Comparison and contrast in perceptual categorization. Journal of Experimental Psychology: Learning, Memory and Cognition, 31, 1459-1476.
Hasher, L., & Zacks, R. (1979). Automatic and effortful processes in memory. Journal of Experimental Psychology: General, 108, 356-388.
Hastie, R., & Park, B. (1986). The relationship between memory and judgment depends on whether the judgment task is memory-based or on-line. Psychological Review, 93, 258-268.
Haubensak, G. (1992). The consistency model: A process model for absolute judgments. Journal of Experimental Psychology: Human Perception and Performance. 18,
303-309.
Hertwig, R., Pachur, T., & Kurzenhäuser, S. (2005). Judgments of risk frequencies: Test of possible cognitive mechanisms. Journal of Experimental Psychology: Learning, Memory, and Cognition, 4, 621-642.
Hock, H., Malcus, L., & Hasher, L. (1986). Frequency discrimination: Assessing global-level and element-global-level units in memory. Journal of Experimental Psychology: Learning, Memory, and Cognition, 12, 232-240.
Holland, M.K., & Lockhead, G.R. (1968). Sequential effects in absolute judgments of loudness. Perception and Psychophysics, 1968, 3, 409-414.
Johnson, E.J., & Payne, J.W. (1985). Effort and accuracy in choice. Management Science, 31, 394-414.
Kusev, P., van Schaik, P., Ayton, P., Dent, J., & Chater, N. (2009). Exaggerated risk: Prospect theory and probability weighting in risky choice. Journal of Experimental Psychology: Learning, Memory, and Cognition, 35, 1487-1505.
Lockhead, G. R. (1992). Psychophysical scaling: Judgments of attributes or objects? Behavioral and Brain Sciences, 15, 543-601.
Lockhead, G. R. (2004). Absolute judgments are relative: A reinterpretation of some psychophysical ideas. Review of General Psychology, 8, 265-272.
Miller, N., & Campbell, D. T. (1959). Recency and primacy in persuasion as a function of the timing of speeches and measurements. Journal of Abnormal and Social Psychology, 59, 1-9.
Nosofsky, R. M. (1986). Attention, similarity, and the identification-categorization relationship. Journal of Experimental Psychology: General, 115, 39-57.
Oskarsson, A. T., Van Boven, L., McClelland, G. H., & Hastie, R. (2009). What’s next? Judging sequences of binary events. Psychological Bulletin, 135, 262–285.
Parducci, A. (1965). Category judgment: A range-frequency model. Psychological Review, 72, 407-418.
Parducci, A., & Wedell, D. H. (1986). The category effect with rating scales: Number of categories, number of stimuli, and method of presentation. Journal of Experimental Psychology: Human Perception and Performance, 12, 496-516.
Peterson, L. R., & Peterson, M. J. (1959). Short-term retention of individual verbal items. Journal of Experimental Psychology, 58, 193-198.
Schneider, W., & Chein, J. (2003). Controlled and automatic processing: Behavior, theory, and biological mechanisms. Cognitive Science, 27, 525-559.
Schneider, W., & Shiffrin, R. (1977). Controlled and automatic human information processing: I. Detection, search, and attention. Psychological Review, 84, 1-66.
Sedlmeier, P., & Betsch, T. (Eds.). (2002). Frequency processing and cognition. Oxford: Oxford University Press.
Stewart, N., Brown, G. D. A., & Chater, N. (2002). Sequence effects in categorization of simple perceptual stimuli. Journal of Experimental Psychology: Learning, Memory, and Cognition, 28, 3-11.
Stewart, N., Brown, G. D. A., & Chater, N. (2005). Absolute identification by relative judgment. Psychological Review, 112, 881-911.
Tversky, A., & Kahneman, D. (1973). Availability: A heuristic for judging frequency and probability. Cognitive Psychology, 5, 207-232.
Tversky, A., & Kahneman, D. (1974). Judgment under uncertainty: Heuristics and biases. Science, 185, 1124-1131.
Appendix 1
Examples of sequences used in the frequency-estimation task
N Sequence Characteristic Identification of sequence characteristic Value of sequence characteristic
1 First-run category RGRRRRGRGRRGGGGGGGGGRRRRGRRGGR RED
2 Last-run category RGRRRRGRGRRGGGGGGGGGRRRRGRRGGR GREEN
3 Length of the first-run RGRRRRGRGRRGGGGGGGGGRRRRGRRGGR 4
4 Length of the last-run RGRRRRGRGRRGGGGGGGGGRRRRGRRGGR 2
5 Number of runs (first-run category) RGRRRRGRGRRGGGGGGGGGRRRRGRRGGR 4
6 Number of runs (non-first-run category)
RGRRRRGRGRRGGGGGGGGGRRRRGRRGGR 2
7 Single stimuli (first-run category) RGRRRRGRGRRGGGGGGGGGRRRRGRRGGR 3
8 Number of single stimuli (non-first-run category)
RGRRRRGRGRRGGGGGGGGGRRRRGRRGGR 4
9 Number of single stimuli (first-run category) before the first run
RGRRRRGRGRRGGGGGGGGGRRRRGRRGGR 1
10 Number of single stimuli (non-first-run category) before the first (non-first-run
RGRRRRGRGRRGGGGGGGGGRRRRGRRGGR 1
11 Number of single stimuli (first-run category) after the last run
RGRRRRGRGRRGGGGGGGGGRRRRGRRGGR 1
12 Number of single stimuli (non-first-run category) after the last (non-first-run
RGRRRRGRGRRGGGGGGGGGRRRRGRRGGR 0
13 Number of runs (last-run category) RGRRRRGRGRRGGGGGGGGGRRRRGRRGGR 2
14 Number of runs (non-last-run category)
RGRRRRGRGRRGGGGGGGGGRRRRGRRGGR 4
15 Number of single stimuli (last-run category)
RGRRRRGRGRRGGGGGGGGGRRRRGRRGGR 4
16 Number of single stimuli (non-last-run category)
RGRRRRGRGRRGGGGGGGGGRRRRGRRGGR 3
17 Average run length of first-run category
RGRRRRGRGRRGGGGGGGGGRRRRGRRGGR 3
18 Average run length of non-first-run category
RGRRRRGRGRRGGGGGGGGGRRRRGRRGGR
5.5 19 Average run length of last-run
category
RGRRRRGRGRRGGGGGGGGGRRRRGRRGGR
5.5 20 Average run length of non-last-run
category
RGRRRRGRGRRGGGGGGGGGRRRRGRRGGR
3 21 Charateristic 9 + Charateristic 10 RGRRRRGRGRRGGGGGGGGGRRRRGRRGGR 2
22 Charateristic 11 + Charateristic 12 RGRRRRGRGRRGGGGGGGGGRRRRGRRGGR 1
Author Note
Footnotes
1
In this paper we use the term “run” when at least two consecutive occurrences of the same category appear in a sequence; accordingly, a single occurrence is not considered a run.
2
The purpose of this analysis is not to address multicollinearity, but instead analyses for each predictor variable whether the additional amount of variance that each of the remaining predictor variables would explain in the dependent variable is statistically significant.
3
In Experiment 2A and the following experiments, in order to make frequency estimates made in non-first-run conditions equivalent with those made in first-run conditions for the purpose of conducting statistical tests, each estimate in the former conditions were replaced with 100% - estimate.
4
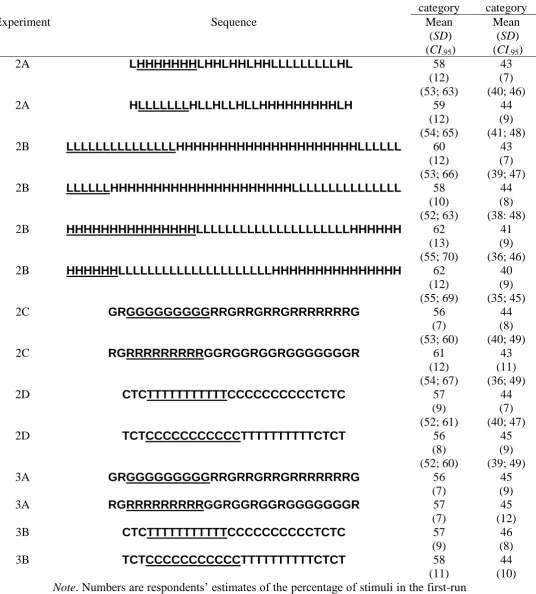
Note. Numbers are respondents’ estimates of the percentage of stimuli in the first-run
and the non-first-run categories.
First-run category
Non-first-run category
Experiment Sequence Mean
(SD) (CI.95)
Mean (SD) (CI.95)
2A LHHHHHHHLHHLHHLHHLLLLLLLLLHL 58
(12) (53; 63)
43 (7) (40; 46)
2A HLLLLLLLHLLHLLHLLHHHHHHHHHLH 59
(12) (54; 65)
44 (9) (41; 48)
2B LLLLLLLLLLLLLLLHHHHHHHHHHHHHHHHHHHHHLLLLLL 60
(12) (53; 66)
43 (7) (39; 47)
2B LLLLLLHHHHHHHHHHHHHHHHHHHHHLLLLLLLLLLLLLLL 58
(10) (52; 63)
44 (8) (38: 48)
2B HHHHHHHHHHHHHHHLLLLLLLLLLLLLLLLLLLLLHHHHHH 62
(13) (55; 70)
41 (9) (36; 46)
2B HHHHHHLLLLLLLLLLLLLLLLLLLLLHHHHHHHHHHHHHHH 62
(12) (55; 69)
40 (9) (35; 45)
2C GRGGGGGGGGGRRGRRGRRGRRRRRRRG 56
(7) (53; 60)
44 (8) (40; 49)
2C RGRRRRRRRRRGGRGGRGGRGGGGGGGR 61
(12) (54; 67)
43 (11) (36; 49)
2D CTCTTTTTTTTTTTCCCCCCCCCCTCTC 57
(9) (52; 61)
44 (7) (40; 47)
2D TCTCCCCCCCCCCCTTTTTTTTTTCTCT 56
(8) (52; 60)
45 (9) (39; 49)
3A GRGGGGGGGGGRRGRRGRRGRRRRRRRG 56
(7)
45 (9)
3A RGRRRRRRRRRGGRGGRGGRGGGGGGGR 57
(7)
45 (12)
3B CTCTTTTTTTTTTTCCCCCCCCCCTCTC 57
(9)
46 (8)
3B TCTCCCCCCCCCCCTTTTTTTTTTCTCT 58
(11)
[image:42.595.46.583.132.727.2]Sequences and test of frequency estimate against the actual proportion (Experiments 4, 5 and 6)
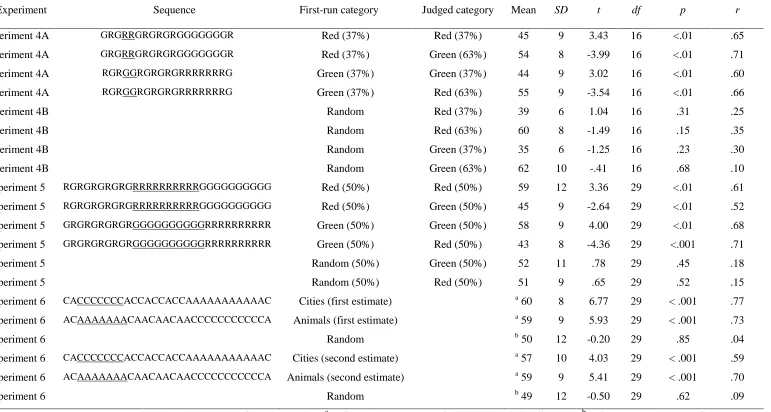
Experiment Sequence First-run category Judged category Mean SD t df p r
Experiment 4A GRGRRGRGRGRGGGGGGGR Red (37%) Red (37%) 45 9 3.43 16 <.01 .65
Experiment 4A GRGRRGRGRGRGGGGGGGR Red (37%) Green (63%) 54 8 -3.99 16 <.01 .71
Experiment 4A RGRGGRGRGRGRRRRRRRG Green (37%) Green (37%) 44 9 3.02 16 <.01 .60
Experiment 4A RGRGGRGRGRGRRRRRRRG Green (37%) Red (63%) 55 9 -3.54 16 <.01 .66
Experiment 4B Random Red (37%) 39 6 1.04 16 .31 .25
Experiment 4B Random Red (63%) 60 8 -1.49 16 .15 .35
Experiment 4B Random Green (37%) 35 6 -1.25 16 .23 .30
Experiment 4B Random Green (63%) 62 10 -.41 16 .68 .10
Experiment 5 RGRGRGRGRGRRRRRRRRRRGGGGGGGGGG Red (50%) Red (50%) 59 12 3.36 29 <.01 .61
Experiment 5 RGRGRGRGRGRRRRRRRRRRGGGGGGGGGG Red (50%) Green (50%) 45 9 -2.64 29 <.01 .52
Experiment 5 GRGRGRGRGRGGGGGGGGGGRRRRRRRRRR Green (50%) Green (50%) 58 9 4.00 29 <.01 .68
Experiment 5 GRGRGRGRGRGGGGGGGGGGRRRRRRRRRR Green (50%) Red (50%) 43 8 -4.36 29 <.001 .71
Experiment 5 Random (50%) Green (50%) 52 11 .78 29 .45 .18
Experiment 5 Random (50%) Red (50%) 51 9 .65 29 .52 .15
Experiment 6 CACCCCCCCACCACCACCAAAAAAAAAAAC Cities (first estimate) a 60 8 6.77 29 < .001 .77
Experiment 6 ACAAAAAAACAACAACAACCCCCCCCCCCA Animals (first estimate) a 59 9 5.93 29 < .001 .73
Experiment 6 Random b 50 12 -0.20 29 .85 .04
Experiment 6 CACCCCCCCACCACCACCAAAAAAAAAAAC Cities (second estimate) a 57 10 4.03 29 < .001 .59
Experiment 6 ACAAAAAAACAACAACAACCCCCCCCCCCA Animals (second estimate) a 59 9 5.41 29 < .001 .70
Experiment 6 Random b 49 12 -0.50 29 .62 .09
[image:43.842.25.796.107.519.2]Descriptives for recall by recall category and first-run category (Experiment 6)
First-run category
Category of recall City Animal Random City
M 52 64 59
SD 20 19 21
Animal
M 60 59 60
SD 20 17 21
[image:44.595.101.484.130.250.2]Figure 1. Examples of red and green stimuli.
Stimuli from the category red Stimuli from the category green
Figure 2. Examples of triangles and circles stimuli.
Stimulus from the category circles Stimulus from the category triangles