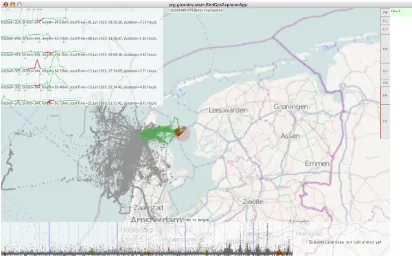
Supporting the visual analysis of the behaviour of gulls
Full text
Figure


Related documents
Most of the steps of TOPSIS can be easily generalized to a fuzzy environment, except max and min operations in finding the ideal solution and negative ideal solution1. Thus we
As noted in the Literature Review, above, scholarship on the determinants of foreign direct investment (FDI) variously argue the influence of GDP growth, the openness of a
The degree of resistance exhibited after 1, 10 and 20 subcultures in broth in the absence of strepto- mycin was tested by comparing the number of colonies which grew from the
Field experiments were conducted at Ebonyi State University Research Farm during 2009 and 2010 farming seasons to evaluate the effect of intercropping maize with
on deeply held misconceptions and fears of people who hold different beliefs, strategies of conceptual change theory, most often found in science education, were
The scattergram represents the distribution with age of 69 determinations of concentration of potassium in serum of 39 premature infants with respiratory distress syndrome (Table
National Conference on Technical Vocational Education, Training and Skills Development: A Roadmap for Empowerment (Dec. 2008): Ministry of Human Resource Development, Department