RESEARCH ARTICLE
10.1002/2014JC009909
Impact of measurement uncertainties on determination
of chlorophyll-specific absorption coefficient
for marine phytoplankton
David McKee1, R€udiger Rottgers€ 2, Griet Neukermans3, Violeta Sanjuan Calzado4, Charles Trees4, Marina Ampolo-Rella4, Claire Neil1, and Alex Cunningham1
1Department of Physics, University of Strathclyde, Glasgow, Scotland, UK,2Department of Remote Sensing,
Helmholtz-Zentrum Geesthacht, Institute for Coastal Research, Geesthacht, Germany,3Marine Physical Laboratory, Scripps Institution of Oceanography, University of California, San Diego, La Jolla, California, USA,4Research Department, Centre for Maritime
Research and Experimentation, La Spezia, Italy
Abstract
Understanding variability in the chlorophyll-specific absorption of marine phytoplankton, aph*Chl(k), is essential for primary production modelling, calculation of underwater light field characteris-tics, and development of algorithms for remote sensing of chlorophyll concentrations. Previous field and laboratory studies have demonstrated significant apparent variability inaph*Chl(k)for natural samples and algal cultures. However, the potential impact of measurement uncertainties on derived values ofaph*Chl (k)has received insufficient study. This study presents an analysis of measurement uncertainties for a data set collected in the Ligurian Sea in Spring and assesses the impact on estimates ofaph*Chl(k). It is found that a large proportion of apparent variability in this set ofaph*Chl(k)can be attributed to measurement errors. Application of the same analysis to the global NOMAD data set suggests that a significant fraction of variability inaph*Chl(k)may also be due to measurement errors.1. Introduction
Material-specific inherent optical properties (IOPs) are essential components for many forward radiative transfer models and remote-sensing interpretation schemes [Mobley, 1994]. The chlorophyll-specific phyto-plankton absorption coefficient,aph*Chl(k), is particularly important since it is used in many primary produc-tion models [Behrenfeld and Falkowski, 1997]. Variability inaph*Chl(k)can have a significant impact on primary productivity calculations [Babin et al., 1993], to the extent that some effort has been made to try to eliminate the parameter from the modeling process [Lee et al., 1996].
Determination ofaph*Chl(k)requires measurements of two variables – the fraction of the absorption coeffi-cient in a given water sample attributable to phytoplankton cells,aph(k), and the concentration of chloro-phyllain the sample,Chl. The most common methodology is to measure the absorption of particulate material retained on glass fiber filters [e.g.,Ferrari and Tassan, 1999] before and after bleaching to determine aph(k)and solvent extraction of phytoplankton pigments followed by fluorometry, spectrophotometry, or high performance liquid chromatography (HPLC) to determineChl[Jeffrey et al., 1997].
The magnitude and spectral shape ofaph(k)is primarily determined by not onlyChlbut the pigment com-position and the size of phytoplankton [Prieur and Sathyendranath, 1981]. Variations inaph(k)normalized by one of the primary photosynthetic pigments,Chl, reflect changes in phytoplankton taxonomy, nutritional status, photoadaptive state, and pigment packaging [e.g.,Fujiki and Taguchi, 2002]. Phytoplankton can respond to changes in ambient light levels by rearranging pigment structures to improve photosynthetic efficiency or provide protection from potentially damaging light levels, both of which lead to changes in aph(k). Of special interest is the magnitude ofaph*Chl(k)at a wavelength of 442 nm because at this wave-lengthaph(k)has its strongest signal. This coefficient is commonly used to assess the so-called pigment packaging effect [Morel and Bricaud, 1981]. The fact that observed values of the chlorophyll-specific absorp-tion coefficient decrease with increasingChlis largely driven by associated changes in phytoplankton size, with lowChltypically being found in clear ocean regions where picoplankton (<2mm diameter) dominate and highChloccurring in regions where microplankton (>20mm diameter) make a significant contribution
Key Points:
Measurement uncertainties are estimated for HPLC chlorophyll concentrations and filter pad absorption data
Propagation of measurement uncertainties into derived values of chlorophyll-specific absorption coefficients accounts for a large fraction of observed variability
Correspondence to: D. McKee,
Citation:
McKee, D., R. R€ottgers, G. Neukermans, V. S. Calzado, C. Trees, M. Ampolo-Rella, C. Neil, and A. Cunningham (2014), Impact of measurement uncertainties on determination of chlorophyll-specific absorption coefficient for marine phytoplankton, J. Geophys. Res. Oceans,119, doi:10.1002/2014JC009909.
Received 14 FEB 2014 Accepted 9 DEC 2014
Accepted article online 16 DEC 2014
Journal of Geophysical Research: Oceans
[Bricaud et al., 1995]. This has led to development of models relating spectral absorption shape to dominant cell size [e.g.,Ciotti et al., 2002]. Reports of large variations in measured values ofaph*Chl(k)for natural sam-ples are common in the literature withBricaud et al. [1995] showing almost an order of magnitude variabili-ty at lowChl. The purpose of this paper is to quantify measurement errors foraph(k)andChland to examine how these errors contribute to the observed variability inaph*Chl(k)i.e., the spread of data around the power-law fits that are used to quantify the package effect [Bricaud et al., 1995].
Measurement ofaph(k)for natural samples is subject to a number of practical limitations. As well as instru-ment noise and sample handling artifacts [Stramski, 1990], there are issues associated with separation of algal from nonalgal components of absorption [Ferrari and Tassan, 1999] and quantification of the path length amplification factor,b, for filter pad absorption measurements. The path length amplification factor is supposed to enable correction for diffuse reflection from the filter paper upon which the sample is retained and resulting multiple photon traversals through the sample. Various, potentially conflicting, strat-egies for assessingbhave been proposed in the literature without any real consensus being achieved [e.g., Mitchell, 1990;Bricaud and Stramski, 1990;Cleveland and Weidemann, 1993;Tassan and Ferrari, 1995;Arbones et al., 1996;Roesler, 1998;Finkel and Irwin, 2001]. More recently,R€ottgers and Gehnke[2012] have presented a new analysis of path length amplification effects and an alternative means of estimatingb. One possible reason why a solution to this problem has remained elusive has been the necessity to validate the approach using absorption data measured on particle suspensions with unknown and probably significant uncertain-ties. In situ absorption measurements using WETLabs AC-9 instruments have been commonplace for approximately two decades, for example, but it has become clear that these data are subject to significant potential errors associated with imperfect correction for scattering artifacts [McKee et al., 2008;Leymarie et al., 2010]. Recent work has demonstrated that these issues can now be largely overcome, and typical AC-9 accuracy now approaches60.02 m21[McKee et al., 2013].The current state of the art for total absorption measurements for natural samples is the Point Source Integrating Cavity Absorption Meter (PSICAM) pro-posed initially byKirk[1997], and successfully implemented and validated byR€ottgersand coworkers at the Helmholtz-Zentrum Geesthacht (HZG) [R€ottgers et al., 2005, 2007;R€ottgers and Doerffer, 2007]. Along with other integrated cavity absorption meter approaches [e.g.,Pope and Fry, 1997], the PSICAM operates by placing the sample in a completely diffuse light field and measuring the loss of light due to absorption. Scattering by the sample does not affect the already diffuse light field and the technique relies upon cali-bration against colored solutions with known spectral absorption coefficients. The HZG instrument has been found to give2% accuracy over a wide range of water conditions, with a maximum error of10% for very low signal levels [R€ottgers et al., 2005]. Unfortunately, the integrating cavity technology is currently not well suited to application of bleaching techniques to separately measureaph(k), so it is still necessary to perform filter pad absorption measurements. The availability of the PSICAM does, however, permit substan-tially less ambiguous validation ofbfactors for filter pad absorption data. In this paper, filter pad absorption data are compared with PSICAM results for a field study in the Ligurian Sea and estimates of uncertainties forbfactors are derived.
Case II waters (algal and nonalgal materials contribute significantly to optical properties) and 7–40% for Case I waters (algae and covarying materials dominate optical properties). They note that preparedChl extracts showed smaller uncertainties (8–15%), suggesting a significant contribution to overall uncertainty from differing filtration and extraction procedures. In order to estimate the range of uncertainty for this data set, we note that the 95% prediction interval is approximately 1.96r, giving maximum 95% prediction interval ranges between 30 and 80% for natural samples.Tilstone et al. [2012] report an average percentage standard deviation of 22% for HPLC measurements ofChlfor an intercomparison study in the North Sea involving five laboratories. Conversion to a 95% prediction interval suggests an uncertainty range of 43% for this study. Given the magnitude of these uncertainty ranges inChl, and the various potential errors in aph(k)discussed above, there are certainly grounds for further investigation into the extent to which these errors combine to produce uncertainties in derived values ofaph*Chl(k)that may be comparable to the
ranges of apparent uncertainty reported for field observations.
The hypothesis tested in this paper is that con-siderable apparent variability inaph*Chl(k)can be attributed to measurement uncertainties in aph(k)andChl. Data are presented from a cruise in the Ligurian Sea to establish likely boundaries for uncertainty inaph*Chl(k) deter-minations using the best currently available methodology. The global relevance of these findings is tested by applying reasonable uncertainty ranges foraph(k)andChl measure-ments toaph*Chl(k)values reported in the NOMAD (NASA bio-Optical Marine Algorithm Data) data set [Werdell and Bailey, 2005].
2. Methods
2.1. Location
[image:3.630.181.385.242.700.2]Data were collected in the Ligurian Sea on board the NRV Alliance between 13th and 26th March 2009. The Ligurian Sea is located off the northwest coast of Italy (Figure 1a) and is part of the Mediterranean Sea. Stations were located in two areas: offshore and onshore (Figure 1b). The offshore group of stations represent deep (up to 2500 m) oceanic waters and at the time of the cruise were experiencing the onset of a spring bloom. Onshore stations were located close to the northwest Italian coast and consist of a series of transects across a gradient from reasonably clear water to quite turbid water associated with the plume from the River Arno. Although the data set is located within a rela-tively confined geographical area, it covers a reasonably wide range of optical water types. For this data set, total chlorophylla concentra-tions ranged over an order of magnitude from 0.3 to 3.3 mg m23while total suspended partic-ulate material concentrations varied from 0.13 to 3.8 g m23. Analysis of HPLC pigment data provided by Horn Point Laboratory suggested that microplankton dominated stations close to shore, with offshore stations typically
dominated by nanoplankton and smaller contribu-tions from picoplankton. Samples were collected within a reasonably short time (less than 2 weeks) and only surface data are presented.
2.2. Absorption Measurements
The absorption of all dissolved and suspended components minus water was measured using the HZG PSICAM [R€ottgers et al., 2005, 2007;R€ottgers and Doerffer, 2007]. This instrument has previously been extensively validated and has been shown to provide very high accuracy (62%) absorption coefficients across a wide range of water condi-tions. In common with many other IOP measure-ment methodologies, a current limitation of the PSICAM approach is the difficulty in separating the contributions to particulate absorption of phyto-plankton and of nonphytophyto-plankton components. While it is possible to measure the absorption by colored dissolved organic materials (CDOM) using the PSICAM with 0.2mm filtered seawater, a 1 m liquid waveguide capillary cell (LWCC) with an Ocean Optics USB2000 minispectrometer was used for the measurements presented here. This instrument is somewhat faster to operate than the PSICAM and provides noise range of60.0001 m21
(95% Prediction Interval) at 532 nm. In both cases, measurements were made against fresh Milli-Q references and all samples were corrected for the effects of salinity and temperature on water absorption [R€ottgers and Doerffer, 2007]. From this pair of measurements particulate absorption,ap(k), was derived by subtraction of CDOM absorption, aCDOM, from PSICAM nonwater absorption,aPSICAM.
[image:4.630.188.371.98.646.2]In order to estimate chlorophyll-specific absorp-tion coefficient,aph*Chl(k), a measurement of phy-toplankton absorption,aph(k), is required. This can be obtained by measuring the absorption of all particulate materials retained on a GF/F filter pad, ap(k), followed by measurement of the residual absorbing component after algal pigments have been eliminated by oxidation with sodium hypo-chlorite solution [Ferrari and Tassan, 1999]. The absorption measured after bleaching is commonly termed either detrital absorption,adet(k)[Wozniak et al., 2010], or nonalgal absorption,aNAP(k)[Babin et al., 2003]. The termadet(k)is adopted here, even though it is noted that this absorption term con-tains a potentially broad range of subcomponents. Subtracting the detrital absorption signal from the particulate absorption coefficient gives the absorption associated with extracted phytoplank-ton pigments, which we shall refer to here as phy-toplankton absorption,aph(k). It should be noted that the true phytoplankton absorption signal may
well differ from this value for a variety of reasons including: imperfect bleaching, absorption of the bleach-ing agent, presence of pigments in other particulate materials, and absorption by other, nonextractable algal materials. It is expected that phytoplankton pigments would represent the greatest fraction of algal absorption in the visible spectrum. The bleaching process may affect absorption by other organic material and could result in a tendency to underestimate detrital absorption and therefore overestimate algal absorption. This remains an area of considerable doubt and the effect, if present, would naturally vary from sample to sample. Particulate optical density (ODp) was measured on freshly filtered samples using a Shi-madzu UV-2501 PC dual-beam spectrophotometer. Between 1 and 2 L of sample were filtered through a 25 mm GF/F filter with nominal 0.7mm retention limit which was mounted directly against the exit port of the spectrophotometer sample chamber. An unused GF/F filter, wetted with 0.2mm filtered seawater from the same station, was used as a reference sample and mounted on the reference port of the spectropho-tometer. After measuring particulate optical density, the sample filter was exposed to a dilute sodium hypo-chlorite solution until visual loss of pigmentation occurred. The bleached filter pad was rinsed with 0.2mm filtered seawater before being returned to the sample detector and a further scan for detrital optical density (ODdet) was completed. Detrital absorption spectra were visually examined to ensure that all pigment fea-tures, including phycobiliproteins, were removed. The sample was rebleached and rescanned if necessary. The absorption coefficient is obtained from
apð Þk52:303
AfpODpð Þk
Vfb
(1)
whereAfpis the exposed area of the filter pad,Vfis the volume of sample filtered, andbis the path length amplification factor. Filter pad absorption spectra were initially baseline corrected at 750 nm [Cleveland and Weidemann, 1993]. Equation (1) can be rewritten foradetby replacingODpwithODdet.
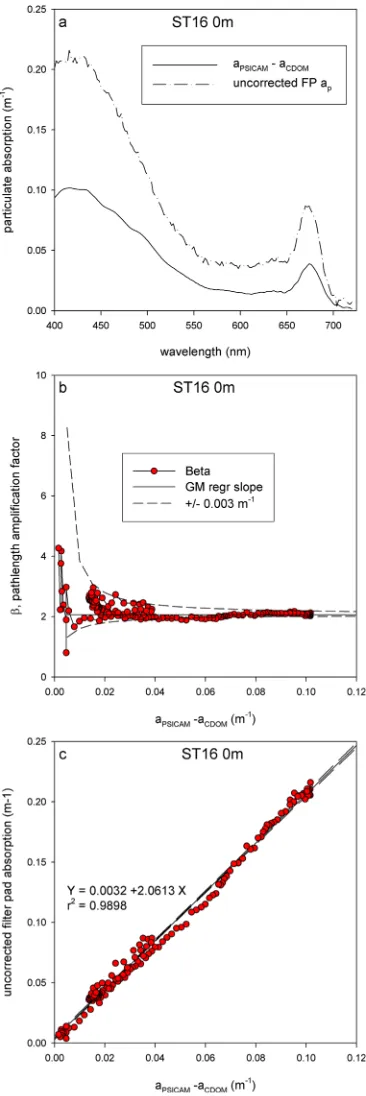
One of the greatest limitations of the quantitative filter pad absorption method is determining an appropri-ate path length amplification factor,b. This study has the unusual benefit of having access to high-quality particulate absorption values from the combination of PSICAM and LWCC which can be used as validation data for theapvalues obtained from filter pads. Figure 2a shows a randomly selected example of an uncor-rected (b51) filter pad particulate absorption spectrum and a corresponding PSICAM-LWCC measurement ofap. The path length amplification factor would traditionally be calculated as the ratio of each wavelength pair of filter pad and suspension absorption coefficients,afp(k)/ap(k).bvalues calculated in this manner for each wavelength are plotted against PSICAM-LWCCapin Figure 2b (for the same data set as Figure 2a), which shows increased apparent variability inbfor low signal levels and is consistent with previous analyses such asBricaud and Stramski[1990, their Figure 1]. Figure 2c shows a geometric mean (GM) regression [Ricker, 1973] applied to uncorrected filter pad absorption coefficients versus PSICAM-LWCCap(k). The regression accounts for 99% of the observed variability between these estimates of absorption and the slope provides a best-fit estimate of the path length amplification factor for the sample across all wave-lengths. The uncertainty in this best-fit slope is given by 95% confidence bounds (dashed lines in figure 2c). The numerical value of this slope is plotted as a horizontal line on Figure 2b where it can be seen thatb val-ues calculated using wavelength pairs ofafp(k)/ap(k)tend toward this best-fit slope value at high signal lev-els. The distribution of points around the best-fit slope value in Figure 2b is not random, but rather exhibits a systematic fluctuation in residuals about the fitted line. This was previously referred to as a ‘‘hysteresis effect’’ byBricaud and Stramski[1990]. Residuals are higher for low signal levels
(aPSICAM2aCDOM<0.04 m21) because of higher relative uncertainty on the absorption measurement for
low signal levels. Figure 2b shows that a hypothetical error bound of60.003 m21for absorption
measure-ments would be sufficient, in this case, to account for the vast majority of observed apparent variability in ratioed pairsbvalues. The boundaries for effects of measurement uncertainties were calculated using maxi-mum and minimaxi-mum values of
bboundary5 a
0
fp6ea
aPSICAM2aCDOM6ea
(2)
wherea0fpis obtained by applying the regression equation from Figure 2c to the range of particulate absorption values, andeais the hypothetical uncertainty in absorption values.
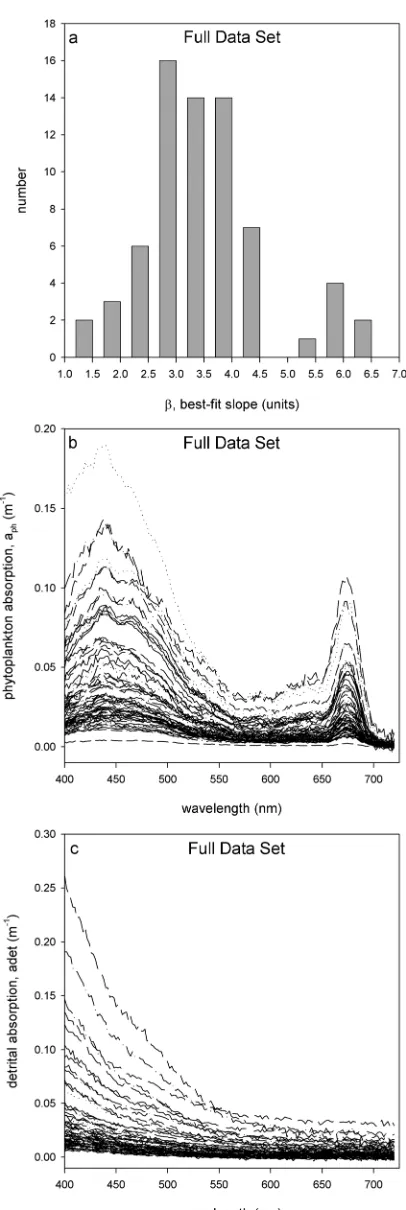
of cases. This approach provides a single, wave-length independentbvalue for each sample. An extremely wide range (1–6.5) of best-fit slope
bvalues was observed, as shown in Figure 3a. The median of 3.3, is considerably greater than the value of 2 predicted byRoesler[1998] from theoretical considerations, and the spread is well outside the range predicted by any of the previously proposed correction schemes. Best-fit GM regressions (slopes and offsets) were applied to particulate and detrital spectra, effec-tively assuming that thebfactor is unaffected by the bleaching process. This is a necessary step that is common to all such procedures. Finally,aphwas obtained by subtracting cor-rectedadetfrom correctedap. Figures 3b and 3c show resulting phytoplankton (pigment) and detrital (nonalgal particulate) absorption spectra for the entire data set. This approach (using GM offset) allows reproduction of the nonzero NIR absorption observed in PSICAMapspectra and attributes this to the detrital component. The fil-ter pad absorption method we present here is conceptually similar to the traditional Transmit-tance (T) filter pad method, but has the distinct advantage of improved estimation of the path length amplification factor and correction for nonzero NIR absorption. It is a new method that effectively uses semiquantitative filter pad absorption measurements to partition highly accurate PSICAM particle absorption data into algal and detrital components.
2.3. Chlorophyll Measurements
[image:6.630.182.385.91.696.2]Chlorophyll concentration was measured using standard HPLC measurements on samples fil-tered through GF/F filters, stored in liquid nitro-gen, and transported to laboratories for later analysis. Two sets of data are presented here: one collected by colleagues from the Manage-ment Unit of the North Sea Mathematical Mod-els (MUMM) and analyzed in their laboratory, and a second set collected by colleagues from NURC and analyzed by Horn Point Laboratory (HPL). Replicates for each sample were averaged by both laboratories. Samples for both labs were collected from a single CTD cast to minimize sampling error. The methodology used by HPL is given inHooker et al. [2005, Chapter 5]. The HPL HPLC method uses a C8 column and a reversed phase, methanol-based, binary gradi-ent, solvent system. The detector signal at 665 nm is used to quantify chlorophylla, divinyl chlorophylla, chlorophyllidea, pheophorbidea,
and pheophytina. MUMM HPLC samples were analyzed by the Marine Chemistry Laboratory of the MUMM using a reversed phase, acetone-based method with a C18 column and a Jasco FP-1520 fluorescence detec-tor. TotalChl atypically contributes50% of the total concentration of pigments for this data set.
3. Results
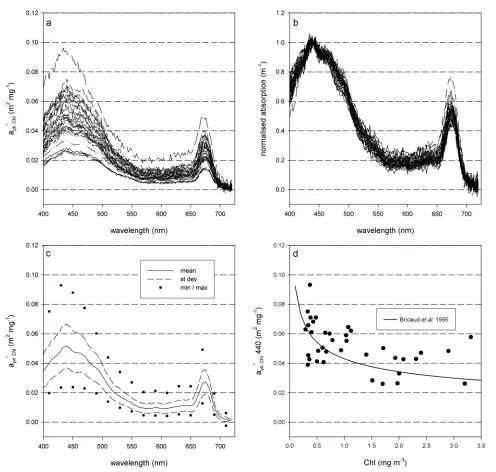
[image:7.630.70.566.90.562.2]Figure 4a shows chlorophyll-specific phytoplankton absorption spectra for the entire Ligurian Sea data set (offshore and onshore) calculated by dividing each optical measurement by the corresponding chlorophyll concentration. There is an apparent order of magnitude variability inaph*chlvalues at 440 nm, but little dif-ference in spectral shape for spectra normalized to 440 nm (Figure 4b). Mean, standard deviation, and range
values for this population of spectra (Figure 4c) are consistent with other studies of this parameter [e.g., Bri-caud et al., 1995]. Plottingaph*chl(440)versusChl(Figure 4d) shows a general decrease toward higher con-centrations that is consistent with the empirical relationship derived byBricaud et al. [1995]. The data presented in Figure 4 point to a common problem: how should we interpret an apparent order of magni-tude variability inaph*Chl(k)? Is this real variability associated with physiological and taxonomic changes in phytoplankton populations? How much of this apparent variability inaph*Chl(k)is associated with measure-ment uncertainties? In order to answer these questions, it is necessary to estimate the uncertainty inaph(k), the uncertainty inChl, and to establish how these measurement uncertainties propagate in order to quan-tify uncertainties inaph*Chl(k).
3.1. Uncertainty inaph(440)
The uncertainty inaph(440)can be estimated analytically using the formula for first-order error propagation. Here it is assumed that: (a) the main sources of error are instrument noise (DOD) and the uncertainty in path length amplification (Db), (b) these uncertainties are independent of one another, and (c) uncertainties inVfandAfpare negligible. Since
aph5ap2adet (3)
the uncertaintyDaphcan be estimated using
Daph5 Da2p1Da2det
1 2=
(4)
where
Dap5
@ap
@ODp
DODp
2
1 @ap
@b Db
2!1=2
(5)
Substituting equation (1) into equation (5) and differentiating gives
Dap5
2:303Afp
Vfb
DODp
2
1 2:303ODpAfp
Vfb2
Db
2!1=2
(6)
which can be rewritten as
Dap5
2:303Afp
Vfb
DODp
2
1 ODp
b Db
2!1=2
(7)
Dadetcan be derived analogously by replacingODpbyODdetin equation (7). Assuming thatDbis the same for the bleached and unbleached filters, then equation (4) becomes
Daph5
2:303Afp
Vfb
DOD2p1DOD2det1 Db
b
2
OD2p1OD2det
" #1 2=
(8)
Equation (8) was used to estimate uncertainties inaph(440)for each sample in the Ligurian Sea data set using recorded filtered volumes,Vf(m3), clear filter areaAfp54.531024m2,bvalues obtained from GM regressions for each filter andDbobtained from 95% confidence intervals on best-fit estimates ofb.DODp andDODdetwere estimated as 95% prediction intervals (51.96r) forODpandODdetvalues between 750 and 800 nm after null correction, where it is assumed that the absorption signal is flat in this spectral region. Substituting these values into equation (8) gave a mean phytoplankton measurement uncertainty of Daph(440)55.831023m21(65.731023m21, 95 % Prediction Interval), which is broadly consistent with visual inspection of measured spectra. Dividing by corresponding measured values ofaph(440)gives a per-centage error distribution that has a mean value of 13%, with a prediction interval of69%.
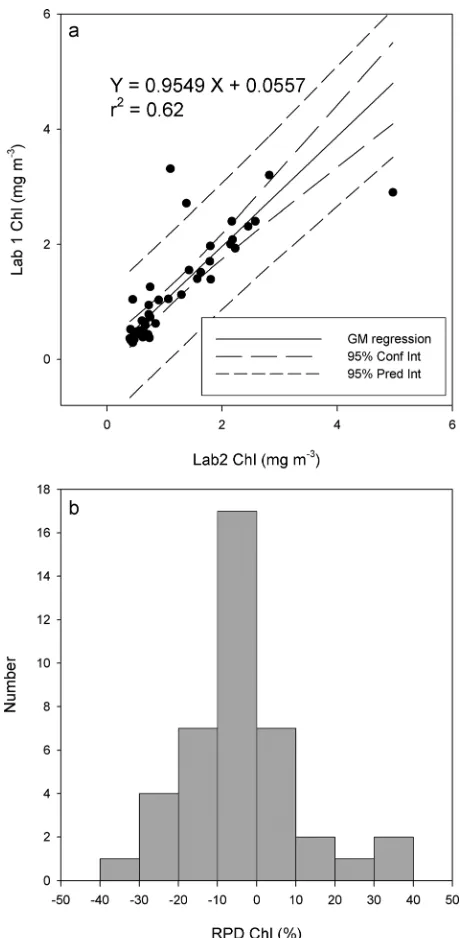
3.2. Uncertainty in Chl
are well-correlated, with a correlation coefficient of 0.79 (r2
50.62). The offset is not significantly different from zero, 0.0660.30 (95% CI). To quantify the agreement betweenChlmeasurements obtained from the two laboratories, the approach ofClaustre et al. [2004] is fol-lowed to establishRPDvalues using
RPD5100Chl
j i2hChlii hChlii
(9)
whereirepresents sample number,j rep-resents laboratory, and the term inside the angled brackets is the mean value of Chlfor samplei. Figure 5b shows the dis-tribution ofRPDvalues for this set ofChl data. Using the 95% Prediction Interval to estimate the range of measurement uncertainty gives628%. This is somewhat higher than the range (620%) found by Claustre et al. [2004], but is well within the ranges of uncertainty found in other stud-ies [e.g.,Sørensen et al., 2007;Tilstone et al., 2012].
3.3. Uncertainty in aph*Chl
The uncertainty inaph*Chlcan be expressed analytically as
DaphChl5aphChl
Daph
a0ph
2
1 DChl
Chl
2!1 2=
(10)
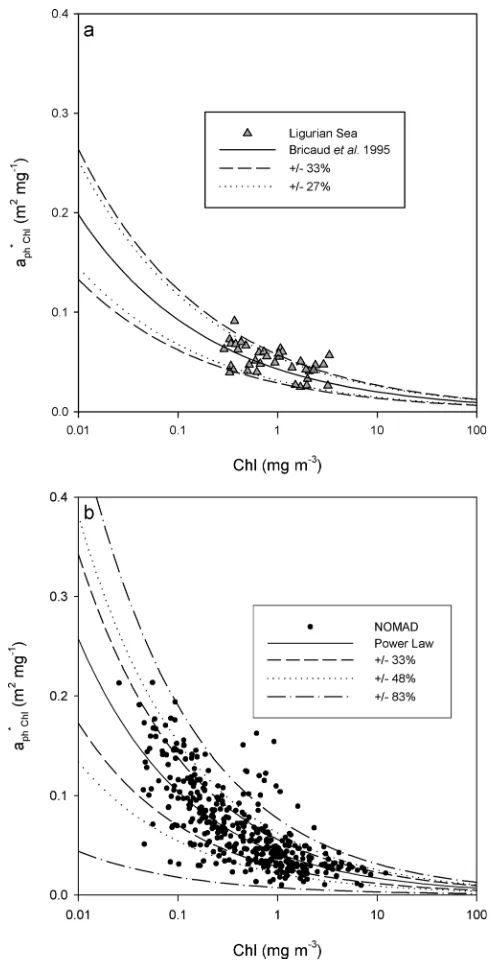
where it is assumed that the uncertainties inaphandChlare not correlated. Incorpo-rating previously derived uncertainty esti-mates of 21% and 28% foraphandChl, respectively, into equation (10) gives an uncertainty of633% foraph*Chl. Figure 6a shows determinations ofaph*Chl(440) replotted againstChlfor the Ligurian Sea data set. The solid line is theBricaud et al. [1995] empirical best-fit for 440 nm. This has been used, together with the estimate of uncertainty inaph*Chl, to define boun-daries that reflect measurement uncertainties (dashed lines). Substituting anRPDrange of620% forChl [Claustre et al., 2004] into equation (10) gives only slightly narrower uncertainty boundaries (627% - dotted lines). Approximately 80% of our Ligurian Sea data set falls within the boundaries formed by these measure-ment uncertainty estimates.
[image:9.630.179.409.96.565.2]Figure 6b showsaph*Chl(440)values derived from the NOMAD data set [Werdell and Bailey, 2005] which includes observations from an extremely broad range of geographical locations. Following the approach of Bricaud et al. [1995], the least squares best-fit power law has been found for this data and estimates of uncertainty inaph*Chlhave been used to define boundaries that can be accounted for by measurement uncertainties. Sixty-three percent of NOMAD observations lie within the boundaries formed by
measurement uncertainty esti-mates based on Ligurian Sea obser-vations presented in this paper (6
33%). The uncertainty ranges for Chlmeasurements provided by Sørensen et al. [2007] andTilstone et al. [2012] further increase mea-surement uncertainty boundaries foraph*Chl(648% and 83%, respec-tively) thereby increasing the frac-tion of NOMAD observafrac-tions (82% and 95%, respectively) located within measurement uncertainty limits. Very similar results (not shown) were found foraph*Chl(676) where it is anticipated that the con-tribution of pigments other than Chlwould be less than at 440 nm.
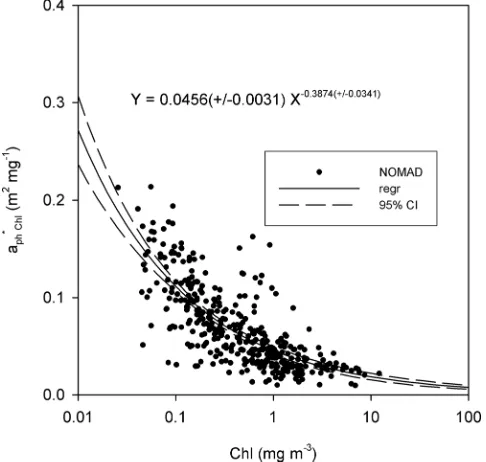
Given the very large fractions of the NOMADaph*ChlversusChldata set that fall within measurement uncertainty bounds, the question arises as to how best to express uncertainty in the variability between these two parameters. If the power-law fit proposed by Bri-caud et al. [1995] is accepted as a reasonable model for this data set (other models might also be viable e.g.,Clauset et al. 2009], and spread around this relationship is attrib-uted to measurement uncertainty, then the remaining uncertainty in the model can be expressed as 95% confidence intervals on the best-fit power law. Applying this to the NOMAD data set (Figure 7) gives best-fit values of 0.045660.0031 and
20.387460.0341 for the slope and exponent of the power law, respectively.
4. Discussion
[image:10.630.184.431.96.578.2]Material-specific IOPs are the cru-cial link between optical measure-ments and concentrations of optically significant constituents that are essential for many ecosys-tem modelling approaches. Uncertainties in the measurement of concentrations of constituents and IOPs propagate into concentration-specific IOPs and may obscure natural variability or introduce artificial vari-ability. It is therefore essential that these uncertainties be assessed and taken into account when discussing potential natural variability.
Figure 6.(a) The observed uncertainty range (633%) foraph*Chl(440)for the Ligurian
Sea data set (dashed lines) accounts for a large portion of the observed variability in chlorophyll-specific absorption. Reducing the uncertainty range to627% (dotted lines), consistent withClaustre et al. [2004] uncertainties inChl, provides a marginally reduced range of accounted variability inaph*Chl(440). (b) The Ligurian Sea
In this study, both systematic and ran-dom measurement uncertainties for chlorophyll-specific phytoplankton absorption coefficients have been quantified. Systematic uncertainties in the path length amplification factor,b, are a major source of uncertainty in the measurement of the phytoplankton absorption coefficient. Access to con-current PSICAM - LWCC derived partic-ulate absorption data makes it possible to determine appropriate path length amplification factors for filter pad absorption data. It has been shown thatbvalues vary widely between sam-ples. Doubtless some of this variability will reflect the very simplistic approach of the filter pad absorption methodol-ogy used, e.g., in comparison with the Tassan and Ferrari[1995] approach. The excellent fit of a single regression for each set of spectral data suggests there may be artifacts associated with individual filter papers, a feature that, if true, would render prior prediction ofb
values impracticable. Further work is required to establish this. Of greater potential concern for this paper is the enforced assumption that the bleaching process does not impact on thebfactor. While this may be a reasonable first approximation, we currently have no means of validating this approach and there must remain some associated uncertainty. This is an outstanding issue for all bleached filter pad approaches. Overall, it is reasonable to believe that this approach has eliminated potentially significant systematic errors in our filter pad particulate absorption, and that derived phytoplankton absorption coefficients will have benefited from this as well. The final value for filter pad absorption uncertainty range (621%) was derived using an analytical approach to error propagation, and accounts for both random and systematic measure-ment uncertainties.
The availability of two independent sets ofChldata for this cruise permits analysis of dataconsistencyrather than absolute accuracy. TheRPDrange forChlis a little greater than the maximum relative percentage dif-ference reported byClaustre et al. [2004], but is less than the uncertainty ranges presented by two other studies [Sørensen et al., 2007;Tilstone et al., 2012].Claustre et al. [2004] andHooker et al. [2005] gathered leading experts in the field to determine the highest possible quality of HPLC data, whereasTilstone et al. [2012] andSørensen et al. [2007] might be better characterized as attempts to establish de facto standards across the broader community. In this case, the latter two sets of data are possibly more representative of the range ofChluncertainties that might affect a community-sourced data set such as NOMAD.
Understanding the potential impact of measurement uncertainties on derived products such as the chlorophyll-specific absorption is essential for data interpretation. In the case of the Ligurian Sea data set examined here, a simplistic analysis of variability inaph*Chl(k)using standard descriptive statistics would suggest almost an order of magnitude variability. However, consideration of measurement uncertainties strongly suggests that the true variability in this data set is considerably less. Analysis of measurement uncertainties for the NOMAD data set suggests that much of the apparent variability inaph*Chlfor a given Chlconcentration is also potentially attributable to measurement uncertainties.
[image:11.630.180.423.101.332.2]The combination of aBricaud-type curve with the error estimates from this paper is sufficient to explain the distribution of results found not only in the Ligurian Sea (Figure 6a) but also in the much wider geographi-cal context of the NOMAD data set (Figure 6b). Our main conclusion is that published observations of aph*Chl(k)convolve an unknown degree of real variability in this parameter with a significant but
quantifiable degree of measurement uncertainty. While it would obviously be desirable to devise a means of reducing errors in measurements ofaph(k)andChl, it is essential that greater effort is made to account for the impact of measurement uncertainties on apparent variability in material-specific IOPs. Ideally, all measurements should be presented with associated estimates of uncertainty, and the analytic error propa-gation method described above may be used to determine uncertainties in derived products such as concentration-specific IOPs. Duplication of measurement systems on research cruises, while expensive and most often requiring close collaboration between research groups, provides vital information for uncer-tainty estimation rather than information redundancy.
The focus of this analysis is on the spread of data around the underlying power-law relationship thatBricaud et al. [1995] and others have used to describe the effect of pigment packaging on algal absorption. It seems very likely that a large fraction of this spread is associated with the propagation of measurement errors. One implication of this, is that it can therefore be assumed that there is, in fact, less natural variability in aph*Chlthan these measurements would previously have suggested. Understanding that there is less real variability inaph*Chlthan was previously thought could have implications for primary productivity modelling and development of algorithms to retrieveChlfrom remote sensing, where adoption of reduced levels of variability around the package effect power-law relationship will significantly improve the predictive power of modeled data. For example, previously one might have taken every point in the NOMAD data set at face value and assumed that each point represents an observation of natural variability. This would have implied a massive range of variability at lowChlconcentrations. Analysis of measurement uncertainties, however, suggests that the majority of this spread is, in fact, due to the propagation of measurement uncertainties. Given the magnitude of these uncertainty bounds, it is not possible to reliably observe variability inaph*Chl beyond the power-law distribution that is attributed to the package effect. For further modeling activities, it is therefore reasonable to restrict variability inaph*ChlversusChlto the bounds set by the 95% confidence intervals on the power-law regression, which are much tighter than the original spread would have sug-gested. Of course, this must be expressed with the caveat that further natural variability might be observ-able if the data set is constrained to include e.g., only dark-adapted samples or samples from a single taxonomic class such as might occur in a laboratory experiment or in a carefully controlled field data set.
5. Conclusions
This study found that chlorophyll-specific absorption coefficients are significantly influenced by associated uncertainties inChlandaph(k)measurements. While it is undoubtedly true that natural phytoplankton pop-ulations will express some degree of variability inaph*Chl(k), considerable caution should be exercised before attributing apparent variability inaph*Chl(k)to natural factors before the impact of measurement errors has been determined. The object of this paper is not to deny the existence of real variability in aph*Chl(k), but to explore the degree to which this variability can be obscured by measurement uncertain-ties. The fact that this analysis can be successfully applied to the NOMAD data set strongly suggests that our result is relevant on a global scale.
References
Arbones, B., F. G. Figueiras, and M. Zapata (1996), Determination of phytoplankton absorption coefficient in natural seawater samples: Evi-dence of a unique equation to correct the path-length amplification on glass-fiber filters,Mar. Ecol. Prog. Ser.,137, 293–304.
Babin, M., J.-C. Therriault, L. Legendre, and A. Condal (1993), Variations in the specific absorption coefficient for natural phytoplankton assemblages: Impact on estimates of primary production,Limnol. Oceanogr.,38, 154–177.
Babin, M., D. Stramski, G.M. Ferrari, H. Claustre, A. Bricaud, G. Obolensky, and N. Hoepffner (2003), Variations in the light absorption coeffi-cients of phytoplankton, non-algal particles, and dissolved organic matter in coastal waters around Europe,J. Geophys. Res.,108(C7), 3211, doi:10.1029/2001JC000882.
Behrenfeld, M. J., and P. G. Falkowski (1997), A consumer’s guide to phytoplankton primary productivity models,Limnol. Oceanogr.,42, 1479–1491.
Bricaud, A., and D. Stramski (1990), Spectral absorption coefficients of living phytoplankton and nonalgal biogenous matter: A comparison between the Peru upwelling area and the Sargasso Sea,Limnol. Oceanogr.,35, 562–582.
Bricaud, A., M. Babin, A. Morel, and H. Claustre (1995), Variability in the chlorophyll-specific absorption coefficient of natural phytoplankton: Analysis and parameterization,J. Geophys. Res.,100(C7), 13,321–13,332.
Ciotti, A. M., M. R. Lewis, and J. J. Cullen (2002), Assessment of the relationships between dominant cell size in natural phytoplankton com-munities and the spectral shape of the absorption coefficient,Limnol. Oceanogr.,47, 404–417.
Clauset, A., C. R. Shalizi, and M. E. J. Newman (2009), Power-law distributions in empirical data,SIAM Rev.,51(4), 661–703, arXiv:0706.1062 [physics.data-an], doi:10.1137/070710111.
Acknowledgments
Claustre, H., et al. (2004), An intercomparison of HPLC phytoplankton pigment methods using in situ samples: Application to remote sens-ing and database activities,Mar. Chem.,85, 41–61.
Cleveland, C. S., and A. D. Weidemann (1993), Quantifying absorption by aquatic particles: A multiple scattering correction for glass-fiber filters,Limnol. Oceanogr.,38, 1321–1327.
Ferrari, G. M., and S. Tassan (1999), A method using chemical oxidation to remove light absorption by phytoplankton pigments,J. Phycol., 35, 1090–1098.
Finkel, Z. V., and A. J. Irwin (2001), Light absorption by phytoplankton and the filter amplification correction: Cell size and species effects,J. Exp. Mar. Biol. Ecol.,259, 51–61.
Fujiki, T., and S. Taguchi (2002), Variability in chlorophyll a specific absorption coefficient in marine phytoplankton as a function of cell size and irradiance,J. Plankton Res.,24(9), 859–874.
Hooker, S., et al. (2005), The Second SeaWiFS HPLC Analysis Round-Robin Experiment (SeaHARRE-2),NASA Tech. Memo. NASA/TM-2005– 212785, 112 pp., NASA Goddard Space Flight Center, Greenbelt, Md.
Jeffrey, S. W., R. F. C. Mantoura, and S. W. Wright (1997),Phytoplankton Pigments in Oceanography: Guidelines to Modern Methods, 661 pp., UNESCO Publ., Paris.
Kirk, J. T. O. (1997), Point-source integrating-cavity absorption meter: Theoretical principles and numerical modeling,Appl. Opt.,36, 6123–6128.
Lee, Z. P., K. L. Carder, J. Marra, R. G. Steward, and M. J. Perry (1996), Estimating primary production at depth from remote sensing,Appl. Opt.,35, 463–474.
Leymarie, E., D. Doxaran, and M. Babin (2010), Uncertainties associated to measurements of inherent optical properties in natural waters, Appl. Opt.,49, 5415–5436.
McKee D., J. Piskozub, and I. Brown (2008), Scattering error corrections for in situ absorption and attenuation measurements,Opt. Express. 16, 19,480–19,492.
McKee, D., J. Piskozub, R. Rottgers, and R. Reynolds (2013), Evaluation and improvement of an iterative scattering correction scheme for in€
situ absorption and attenuation measurements,J. Atmos. Oceanic Tech.,30, 1527–1541.
Mitchell, B. G. (1990), Algorithms for determining the absorption coefficient for aquatic particulates using the quantitative filter technique, Proc. SPIE Int. Soc. Opt. Eng.,1302, 137–148.
Morel, A., and A. Bricaud (1981), Theoretical results concerning light absorption in a discrete medium, and application to specific absorp-tion of phytoplankton,Deep Sea Res., Part A,28, 1375–1393.
Mobley, C. D. (1994),Light and Water, Radiative Transfer in Natural Waters, Academic, San Diego, Calif.
Pope, R., and E. Fry (1997), Absorption spectrum (380–700 nm) of pure water. II. Integrating cavity measurements,Appl. Opt.,36, 8710– 8723.
Prieur, L., and S. Sathyendranath (1981), An optical classification of coastal and oceanic waters based on the specific spectral absorption curves of phytoplankton pigments, dissolved organic matter, and other particulate materials,Limnol. Oceanogr. 26, 671–689. Ricker, W. E. (1973), Linear regressions in fishery research,J. Fish. Res. Board Can.,30, 409–434.
Roesler, C. S. (1998), Theoretical and experimental approaches to improve the accuracy of particulate absorption coefficients derived from the quantitative filter technique,Limnol. Oceanogr.,43, 1649–1660.
R€ottgers, R., and R. Doerffer (2007), Measurements of optical absorption by chromophoric dissolved organic matter using a point-source integrating-cavity absorption meter,Limnol. Oceanogr. Methods,5, 126–135.
R€ottgers, R., and S. Gehnke (2012), Measurement of light absorption by aquatic particles: Improvement of the quantitative filter technique by use of an integrating sphere approach,Appl. Opt.,51, 1336–1351.
R€ottgers, R., W. Sch€onfeld, P.-R. Kipp, and R. Doerffer (2005), Practical test of a point-source integrating cavity absorption meter: The per-formance of different collector assemblies,Appl. Opt.,44, 5549–5560.
R€ottgers, R., C. H€ase, and R. Doerffer (2007), Determination of the particulate absorption of microalgae using a point-source integrating-cavity absorption meter: Verification with a photometric technique, improvements for pigment bleaching and correction for chlorophyll fluorescence,Limnol. Oceanogr. Methods,5, 1–12.
Sørensen, K., M. Grung, and R. R€ottgers (2007), An intercomparison ofin vitrochlorophylladeterminations for MERIS level 2 data valida-tion,Int. J. Remote Sens.,28, 537–554.
Stramski, D. (1990), Artifacts in measuring absorption spectra of phytoplankton collected on a filter,Limnol. Oceanogr.,35, 1804–1809. Tassan, S., and G. M. Ferrari (1995), An alternative approach to absorption measurements of aquatic particles retained on filters,Limnol.
Oceanogr.,40, 1358–1368.
Tilstone, G. H., et al. (2012), Variability in specific-absorption properties and their use in a semi-analytical ocean colour algorithm for MERIS in North Sea and Western English Channel Coastal Waters,Remote Sens. Environ.,118, 320–338.
Werdell, P. J., and S. W. Bailey (2005), An improved in-situ bio-optical data set for ocean color algorithm development and satellite data product validation,Remote Sens. Environ.,98, 122–140.