Rochester Institute of Technology
RIT Scholar Works
Theses
Thesis/Dissertation Collections
7-1-1992
Substituted aromatic polyesters: Degradation
studies
Scott Lee
Follow this and additional works at:
http://scholarworks.rit.edu/theses
This Thesis is brought to you for free and open access by the Thesis/Dissertation Collections at RIT Scholar Works. It has been accepted for inclusion in Theses by an authorized administrator of RIT Scholar Works. For more information, please [email protected].
Recommended Citation
SUBSTITUTED AROMATIC POLYESTERS:
DEGRADATION STUDIES
SCOTILEE
JULY, 1992
SUBMITIED IN PARTIAL FULFILLMENT OF THE
REQUIREMENT FOR THE DEGREE OF MASTER OF SCIENCE
APPROVED:
Jerry Adduci
Project Advisor
Department Head
Library
Rochester Institute of Technology
Rochester, New York 14623
I, Scott Lee, hereby grant permission to the Wallace Memorial
Library, of R.I.T., to reproduce my thesis in whole or in part. Any
reproduction will not be for commercial use or profit.
TABLE OF CONTENTS
List
ofFigures
ii
List
ofTables
vAcknowledgements
viAbstract
vii1
.0Introduction
1
1
.1History
1
1.2 Classification
ofLiquid Crystal
2
1.3
Example
ofLiquid Crystal Polymers
4
1
.4Stability
ofLCPs
5
1.5 Thermal
andThermooxidative
Stability
ofLCPs
6
1.6
Thermogravimetry
Study
ofPolymers
7
1
.7Thermogravimetric Analysis Kinetics
10
2.0
Objective
1 2
3.0
Results
andDiscussion
14
4.0
Conclusions
52
5.0
Experimental
55
5.1 General Information
55
5.2 TGA Sample Preparation
55
5.3
Instrumental
55
5.4
Viscosity
Measurement
55
5.5 TGA Measurements
56
5.6
Decomposition
Product Analysis
Using
GC/MS
56
5.7
Preparation
ofPolyester
8
57
5.8
Preparation
ofPolyester 9
58
5.9
Preparation
ofSolution
Polymerized Polyester
7
61
List
ofFigures
1.
Molecular
orientation of smectic and nematicmesogenicphases
1
2.
Molecular
orientation of cholesteric mesogenic phase2
3.
Schematic
diagram
of ahang-down balance
9
4.
Schematic
diagram
of ahorizontal beam
balance
9
5.
Styryl
and aryl side chain1 4
6.
Proposed
reactionpathway
for the formation
ofdegradation
productsfor
polyester6
underair16
7.
Proposed
reactionpathway
for the formation
ofdegradation
productsfor
polyester7
under nitrogen17
8.
Proposed
reactionpathway for
the
formation
ofdegradation
productsfor
polyester7
underair20
9.
Isothermogram
oftrial #1
for
polyester6
24
10.
Isothermogram
oftrial
#1
for
polyester7
25
11.
Isothermogram
oftrial
#1 for
polyester8
26
12.
Isothermogram
oftrial
#1
for
polyester9
27
13.
Isothermogram
oftrial
#1
for
solutionpolymerized polyester
7
28
14.
Arrhenius
plotfor
polyester6
under nitrogen(Perkin-Elmer)
31
15.
Arrhenius
plotfor
polyester6
under air16.
Rate
constant plotfor
polyester6
(unseparated)
33
17.
Rate
constant plotfor
polyester6
34
18.
Rate
constant plotfor
polyester7
35
19.
Rate
constant plotfor
polyester8
36
20.
Rate
constant plotfor
polyester9
37
21.
Rate
constant plotfor
solution polymerizedpolyester
7
38
22.
Arrhenius
plotfor
polyester6
40
23.
Arrhenius
plotfor
polyester7
41
24.
Arrhenius
plotfor
solution polymerize polyester7
42
25.
Dynamic TG
thermogramfor
polyester6
44
26.
Dynamic TG
thermogram
for
polyester7
45
27.
Dynamic TG
thermogramfor
solutionpolymerized polyester
7
46
28.
Arrhenius
plotfor
polyester8
47
29.
Dynamic
TG
thermogramfor
polyester8
48
30.
Arrhenius
plotfor
polyester9
50
31.
Dynamic
TG
thermogramfor
polyester9
51
32.
Overlay
ofdynamic
TG
thermogram for
polyester
8
underboth
nitrogen and air54
33.
Schematic
diagram
ofisothermal degradation
setup
57
34.
Infrared
spectrum of polyester8
59
35.
DSC
endotherm of polyester8
60
36.
Infrared
spectrum of polyester9
62
37.
DSC
endotherm of polyester9
63
38.
Infrared
spectrum of solution polymerizedpolyester
7
64
39.
DSC
endotherm of solution polymerized polyester7
65
List
ofTables
I.
Bond dissociation
energiesfor
various chemicalbonds
14
II.
GC/MS
analysissummary
oftrap
#1
for
polyester6
underairatmosphere
15
III.
GC/MS
analysissummary
oftrap
#1
for
polyester6
under nitrogen atmosphere
18
IV.
GC/MS
analysissummary
oftrap
#1 for
polyester7
underairatmosphere
19
V.
GC/MS
analysissummary
oftrap
#1
for
polyester7
under nitrogenatmosphere
21
VI.
GC/MS
analysissummary
oftrap
#1
for
polyester9
underairatmosphere
22
ACKNOWLEDGEMENT
I
wouldlike
to
thank
Dr.
Jerry
M. Adduci for
his
guidance andsupport
towards the
completion ofthis thesis
project.I
wouldalso
like
to say thanks
to
Drs.
Thomas
Gennett,
Andreas
Langner,
and
Kay
Turner,
members ofmy
oral committeefor
their
recommendations on
the
preparation ofthis thesis
report.Additionally,
I
wouldlike
to thank the
faculty
and staff ofthe
Chemistry
Department
for
their
general andfinancial
support.Abstract
Two liquid
crystalline aromatic polyesters were studiedby
isothermal degradation
techniques.
Both
polymers contain acommon phenyl side chain group.
However,
one contains a styrylside chain and
the
other contains an a-methylstyryl side chain.Isothermal
degradations
under nitrogen and air were carried onboth
polymers.From the
GC/MS
analysis ofthe
coldtraps, it
showed
that
both
polymers gave offbenzene
or oxygenatedbenzene
related products.Homopolymers containing only
phenylor a-methylstyryl side chain were prepared
by
solutionpolymerization
techniques.
Then isothermal degradation
under airwere also carried out on
both homopolymers.
The
GC/MS
analysisshowed
that the
a-methylstyryl side chain was responsiblefor
the formation
ofthe
oxygenatedbenzene
products.The
activation energiesdetermined for
the
polyestersdid
not show
the
relativestability
ofthe
polyesters as expected.Solution
polymerized polyester6
was studiedinitially
underboth
air and nitrogen atmospheres
using
the
Perkin-Elmer
TGS-2 TGA.
For
polyester6
undernitrogen, the
activationenergy
(Eg)
wasdetermined to be 43 kcal/mole.
Polyester
6
underair,
the
Ea
determined
were31
kcal/mole for
the
initial
rate and28
kcal/mole for
the
final
rate.Then using the Seiko
thermal
instrumentation,
all ofthe
polyesters were studied underflowing
air.The Eafor
polyester6
was
determined
to be 22
kcal/mole
for
the
initial
rate and12
kcal/mole
for
the
final
rate.Solution
polymerized polyester7
had
calculatedEaof 36
kcal/mole.
Melt
polymerized polyester7
had
calculatedEaof 14
kcal/mole
for the initial
rate and11
kcal/mole
for
the
final
rate.Solution
polymerized polyester8
had
calculatedEaof 16 kcal/mole for the initial
rate and12
kcal/mole
for the final
rate.Solution
polymerized polyester9
had
calculatedEaof 20 kcal/mole for the initial
rate and16
INTRODUCTION
The behavior
ofliquid
crystalline materialshave
been
known
since1888
when Reinitzer1 observedthat
cholesterylbenzoate
meltedto
form
aturbid
meltthat
eventually
cleared athigh temperatures.
The
term
liquid
crystal was coinedby
Lehmann2
to
describe
this type
of material.Liquid
crystal3is
a
term
usedto
describe
materialsthat
exhibit
partially
orderedfluid
phasesthat
areintermediate
between the three
dimensionally
ordered crystalline state andthe
disordered
orisotropic
liquid
state.They
are considered neither pureliquid
nortrue
solids sothey
have
been
referredto
as afourth
state of matter.Pure
liquids
areisotropic
molecules,
meaning
that the
moleculeslack
order and solid or crystalline materials areanisotropic, meaning
that the
molecules areordered.
Liquid
crystals occur when moleculesbecome
alignedin
a crystallinearray
while stillin
the
liquid
state and theirappearance are often
turbid
or opalescent.The liquid
crystalline stateis
recognizedby long
or short rangeorientationally
ordered molecules.There
arethree types
of molecular orientations, nematic,smectic,
and cholesteric.The
nematic phase permitsfor
translationalmobility
ofthe
molecule whilein
the
smectic phasethe translational
mobility is
minimized.
Molecular
orientation ofthe two
phases are shownin
Figure 1 below:
00000000
QQ000OO 00
.00ft0.fi.
OOOOOOOOOOtlQOOOOQ
OWOft
0000
90
90000 09
mOO
0IO0OOO.no
a a . i aI
W
999 99
9
099
0990
000
00
0
0 0 0 00
0
M 0 0
oVl
0
09000000
000000000
000
00
00
00
0
00
00
0
nematic smectic
The
mosthighly
ordered phaseis
the
smectic phase.The
smectic phase
has
atwo
dimensional
order.The
nematic phasemesogens are aligned with adjacent mesogens
(rigid backbone
groups).
The
cholesteric phaseis
a specialtype
oftwist
nematicphase.
The
constituent molecules are chiralthus giving
riseto
anasymmetrical
helical
orientation of"sheets"
because
the
spontaneous
twist
resulting
form
the
chirality
ofthe
molecule.the
cholesteric mesophaseis
viewed aslayers
of nematics witheach consecutive
layer
being
rotatedby
a specific angle.A
schematic of cholesteric molecular orientation
is
shownin Figure
2.
\\\
V/.o
m
WW
I
j!
to
n
iWii&
li
Figure 2.
Molecular
orientation of cholesteric mesogenic phaseClassification
ofLiquid
Crystals:
Two
classifications ofliquid
crystals arelyotropic
andthermotropic.
Lyotropic
liquid
crystals areformed
under criticalconcentration
in
solution whilethermotropic
liquid
crystalsform
under melting.
Liquid
crystalline phases are not observedfor
lyotropic liquid
crystal polymers,primarily
because
the
melting
points of these materials are
generally
sohigh
that
they
willdegrade before
melting.4The first
thermotropic
liquid
crystal polymers werereported
in
the
mid1970's
by
Sirigu5 et. al. and Kuhfuss.6 et. al..Sirigu
et. al., prepared new polyalkanoatesfrom
p.p'-dihydroxy-a.a'-dimethylbenzalazine and appropriate acyl chlorides
to
giveCH,
J
"n =
6, 8,
10
1
All
ofthe
above polymersexamined,
meltedto
givefluid
anistropic phases whose properties appear
to
be
similarto those
observed with conventional
liquid
crystals.Thermotropic liquid
crystalsusually have
the
following
structure
features:
1)
high length
:breadth
(axial)
ratio,
2)
rigidunits such as
1,4-phenylene, 1,4-cyclohexyl,
etc.,
3)
rigid centrallinkages
such as -COO-, -CH=CH-, -N=N-, and etc.between
the
rings.
Included in
the
thermotropic
polymers are side chain andmain chain polymers.
The
nameimplies
the
location
ofthe
mesogenic
(liquid crystalline)
group.In
side chainpolymers, the
pendant
liquid
crystalline unitis
connectedto
the
polymer mainchain
by
aflexible
spacergroup
such as methylene units.This
flexible
connection maintainsthe
delicate interactions between
the
pendantliquid
crystalline unitsby dampening
the
main chainmotion
from
that
ofthe
pendant group.An
example of a sidechain polymer
is
shownin
structure2 below:
CH3
CH2-CCOO(CH2)n-0-Q^COO-Q
directly
connectedinto
the
main polymer chain.An
example of amain chain polymer
is
the
copolyester3
withthe
structure shownon page 4:7
oc
II
o
l>-COOCH2CH2-
OC
-Oo-With
their
uniquehybrid
characteristic,
liquid
crystalsexhibit properties
that
are notfound
in liquid
or crystallinestates alone.
Their
morphology
may be
alteredby
externalmagnetic or electric
fields,
they
sometimes change color withtemperature,
and some exhibitvery high
optical rotation.Liquid Crystal Polymers (LCPs):
Liquid
crystalshave been
usedin
widespread commercialapplications
because
of their unique properties.Low
molecularweight
liquid
crystals are often used as videodisplay
screenfor
calculators and
televisions.
Whereas high
molecular weightliquid
crystals are used asengineering
plastics orhigh
strengthfibers.
Liquid
crystalline polymers arethermally
stable,
flame
resistant and
have
excellent mechanical properties.A
commonexample of
high
molecularweight,
aromaticlyotropic
liquid
crystalline polymer
is Du Pont's Kevlar
,
o
II
y-so
A
sulfuric acid solution ofthe
polymer showsthe
liquid
crystalline phase.
Extrusion
ofKevlar into
afiber
resultsin
the
alignment ofthe
molecules.This
uniform alignment givesKevlar
the tensile
strength whichis
much greaterthan that
of steelbut
with a much
lower
density.8Kevlar's
common uses arein bullet
proofvests,
automobile exteriorpanels,
brake
linings,
andmany
otherhigh
strength applications.An
example of a thermotropicliquid
crystal polyesteris the
Celanese
Vectraresins with
the
structure shownbelow:
o
-o-
J-O-o
"IT
/=-c
\
J
o
II
c-This
polyesteris
athermoplastic
which canbe formed into
molded parts with application of
heat
and pressure.Stability
ofLCPs:
Major
concerns of rigidliquid
crystalline aromaticpolymers are
that
they
have high melting
points and aredifficult
to
dissolve in
common organic solvents.Since
they
have
avery
high melting
points(Tm),
theircorresponding
glasstransition
(Tg)
temperatures anddecomposition temperatures
will alsobe
high.
Stability
of polymersis
of criticalinterest
to
both the
manufacturer andthe
researcher.The degree
ofstability
ofthe
polymer
depends
onthe
application andthe
environment at whichthe
polymer performits
task.
Stability
is
a measure ofthe
polymer's
ability to
withstandthermal
andthermo-oxidative
forces
that
make polymersdecompose.
The
main reasonwhy
physical properties at
high
temperatures.9There
arethree
principal methods of polymerdegradation;
chemical,
thermal,
and radiative.The
chemical methodis limited
to
only
reactionsinvolving
the
breakdown
ofthe
polymer'sbackbone
by
chemical reactions.The
thermal
methodis based
onthe
reactionsinvolving
only
the
pendant groups anddoes
notusually break the
polymer'sbackbone
if
the
degradation
is
anon-chain scission
type
of reaction.This
type
ofdegradation
normally
occursin
aromatic polymers wherethe
backbone is
stable and rigid.
Thermal degradation normally
involves
pyrolysisor
heat induced breakdown
ofthe
polymer andits
mechanismnormally
takes
placethrough
afree
radical mechanism.10Radiative
polymerdegradation
onthe
otherhand
can occurby
both
main-chain and pendant
group
scission.The
proceduretakes
placeby
allowing
exposure of polymer samples underUV
light for
long
periods of
time
andthen
study
the
rate ofbreakdown
ofthe
polymer as a
function
oftime.
The breakdown normally
occursautocatalytically
atthe
weak points ofthe
polymer where radicalattacks are more susceptible.
Thermal
andThermooxidative
Stabilities
ofLCPs:
Ordinarily,
when organic compounds areheated
to
high
temperatures
they
have
atendency
to
form
aromatic compounds.Therefore,
aromatic polymers shouldbe
resistantto
high
temperatures.
Thermal
stability
is
primarily dependent
onthe
nature of
the
chemicalbond.
When temperature
risesto the
pointwhere
the
vibrationalenergy
causesbond
rupture,
the
polymerdegrades.
The
atmosphereto
whichthe
polymeris
exposedduring
degradation
affectsthe
polymer'sdecomposition
temperature
aswell as the
degradation
productsthat
are produced.A
polymerdecomposed under an
inert
atmosphere such as nitrogen willhave
a
higher stability than
under air or oxygen.Oxidation
ofthe
polymer
is
the
mostimportant
type
ofthermal
analysisbecause
stability.
The
presence of air or oxygenhas little
effect on theinitial decomposition
temperature,
sobond
ruptureis
dependent
on
thermal
ratherthan
oxidative process.Thermoaravimetrv Study
ofPolymers-Thermogravimetry
(TG)
is
athermal
analysis techniquethat
measuresthe
changein
weight of a substance as afunction
oftemperature
and/ortime.
It's
widely
usedfor obtaining
information
onthe thermal
stability
of a polymer system.TG
canbe
usedto
determine
samplepurity,
identification,
solventretention,
reactionrate,
and activation energy.Two
types
ofTG
analysis canbe
performedto
study
the
stability
ofthe polymer,
dynamic
andisothermal
techniques.The
isothermal
technique
follows
weight change as afunction
oftime.
This
technique
monitors at a specifiedtemperature
wherebond
scission reactionis
taking
place.Thus,
bond
scissionreaction rate parameters can
be
obtaineddirectly.
This
methodis
time
consuming because
afresh
sampleis
neededfor
eachtemperature.
However,
the
activationenergy
values obtained aremore accurate than
the
dynamic
technique.
The dynamic
method studiesthe
weight change as afunction
of temperature.
Fewer
weightloss
curve obtainedfrom
a set ofdifferent
heating
rate are usedto
provideinformation
equivalentto
afamily
ofisothermal
weightloss
curves.This
time
saving
approach covers a wide range of
temperatures
continuously.However,
the
precisionis
dependent
onthe
equationin
use whichare
derived
by
mathematicaltreatments
and simplifiedassumptions.11
The validity
ofthe
dynamic
or non-isothermalmethod
has been
much criticized.12'13The
data
obtainedfrom
the
thermograms are analyzedthrough
the
entiretemperature
range.
If
simultaneous reactions occur withinthat
temperature
range,
the
activationenergy
obtained wouldbe
inaccurate.
Factors that
effectthe
weightloss TG
curve of a sampleare
furnace
heating
rates,
furnace atmosphere,
amount ofsample,
is
adiffusion
controlled process.The
furnace
heating
rateaffects
the
TG
curveby
shifting
the decomposition
temperatureto
ahigher temperature if
afaster
heating
rateis
used.The
shifting is
due
to
the
slow equilibration ofthe
sample with thefurnace
temperature,
thus, causing
alag
behind
the
furnace
temperature.
The decomposition
curveis
more accurate at alow
rate of
heating
than
at afaster
ratefor identical
samples.14This is due
to the
better
equilibration ofthe
sample withthe
furnace temperature.
The
reactiontype,
the
decomposition
products,
andthe
type
of atmosphere used will
have
a profound effect onthe
shape ofthe
TG
curve.An inert
atmosphere such as nitrogen or argonis
used when gaseous
decomposition
products needto
be
removed.Nitrogen
is
also usedto
preventthe
samplefrom reacting
withoxygen or other reactive atmospheres.15
The
sample amount used
is
ofthe
mostimportant factors
that
can cause aTG
curvechange.
When
alarge
sampleis
used,the
samplemay
notequilibrate with
the
furnace
temperaturefast
enoughto
give atrue decomposition
profile.When
too
much sampleis
used,the
volatile
decomposition
products can notdiffuse
through the
sample matrix readily.
This
will resultin
aninaccurate
percentconversion at a specific
time
ortemperature.
The
design
andplacement of
the
thermobalance used will also affectthe
TG
curve results.
There
aretwo
types
ofthermobalances
commercially
available,hang-down
andhorizontal beam.
The
hang-down
balance has the
samplebucket
suspendedby
aplatinum wire
from
the
balance beam.
Balances
ofthis type
arenoted
for
theirsensitivity
.Their
maindisadvantage
is
that
they
are sensitive
to
gaseousturbulence
andthe
inconvenience
ofthe
placement of
the temperature
sensorin
contact withthe
sample.The
temperature thermocoupleis located just below the
samplepan
but
notin
touch
withthe
pan.A
schematic ofthis type
ofMITOKIX FOKCICUHaiDT
IUU SIGl
null susPtNSion
COUHTCKWEIiMT
-coMfimaevissn
Figure
3.
Hang-Down Balance (Perkin-Elmer TGS-2
TGA)
The
horizontal beam balance
onthe
otherhand does have
the
floating
thermocouple in
contact withthe
sample.This
type
ofbalance
is designed
for high
temperature
ceramic applicationsand can
be
used withlarger
samples.LIT IALANCS HAM
7tT
\ "/,
| lentil ..|
rm<tuviioff lC! HOUSKG
Figure 4. Horizontal Beam
Balance (Seiko TG/DTA
220)
One
ofthe
leading
source of errorsin
thermogravimetry
is
temperature measurement.
If
the
sampletemperature
is taken
asthe
temperature measuredby
the
thermocouple
located
eitherjust
above orjust below
the
samplecontainer,
the
true
sampletemperature will either
lead
orlag
behind
the
furnace
Thermoaravimetric
Analysis
KinRtins-Activation
energies ofPolyethylene
terephthalate)
orPET,
a
commonly
usedpolyester,
have
been
calculatedby
means ofthe
Arrhenius
equation onthe
basis
of rate constantsusing both
dynamic
heating
rates17'18and
isothermal
methods.19'20Other
methods
have been
usedto
determine
the
activation energies ofPET
such asintrinsic
viscosity,
carboxylic end pointtitration,
and
hydronium
end point.21Hay
and Kemmish22 also studied poly(aryl etherketone)s
orPEEK,
and poly(aryl etherketone)s
orPEK
by
isothermal
conditions
to
determine
their
decomposition kinetics.
In
their
experiment, the
volatile products evolvedfrom
the tube
furnace
were condensed
in
liquid
nitrogentraps
and were analyzedby
mass spectroscopy.
The isothermal
weightloss
method was usedfor
this
degradation kinetics
study.Separate
tests
were conducted at anumber of
temperatures
in
orderto
determine
activationenergies.
The
advantage ofthis
methodis
that
a virgin polymersample
is
tested
at eachtemperature.
Samples
ofthe
dynamic
heating
ofthe
Flynn-Wall23,24 or Ozawa25 method present athigh
temperatures
may have been
modifiedby
reactions atlower
temperatures.
The
maximum rateloss
which occurs at a specificisothermal
temperature
is
taken
asthe
rate constantfor that
temperature.
The
weightloss
recordedin
TG
thermograms
underisothermal
conditions canbe strictly
described
by
the
equation19,20
In
(m-nif/m0-mf)
- -kt(1)
or
ln(1-W)--kt
(2)
where m - weight of
the
samplemf
=final
weightk
=velocity
constantt
=time
w =
(m0-m)/(m0-mf)
For the
case offirst
orderkinetics,
the
rate ofthe
reationis
r =
dw/dt
=k(1-w)
(3)
where
the
rateconstant,
k,
depends
onthe
absolute temperatureof
the
system.k
= kexp(AH/RT)
(4)
Combining
equations3
and4,
the
resulting
equationis
In
[(dw/dt)/(1-w)]
=In
[(dm/dt)/(m-mf)]
(5)
or
In
k-(AH/RT)
(6)
where k
is
the
pre-exponentialfactor
andR is
the
universal gasconstant.
By
plotting
the
left
side of equation2
versustime,
a straightline
with a slope of
k is
obtained.Then
using
the
rateconstants,
k,
the
activationenergy
canbe
determined
from
the
following
Arrhenius
equation:k
=A [exp(Ea/RT)].
(7)
Taking
naturallog
ofboth
sides gives equation4,
In
k
-In A
+Ea/RT
(8)
plotting the
left hand
side of equation8
versusthe
reciprocal ofthe
absolutetemperature,
the
activationenergy
canbe
determined
from the
slope ofthe
curve.Objective
The
objective ofthis
projectis
to
determine
the
reactionactivation
energy
andkinetics
for
the thermal
decomposition
oftwo
aromaticthermotropic
liquid
crystalline polyesters shownin
structures
6
and7
below:
1.0
I
o
o
II
/=\
II
-o-c-d
Vc-o-\J
1.0
IEnergies
of Activation andReaction Kinetics:
By
assuming the
main chain ofthe
polymerdoes
notbreak
and also
the
fact
that
side chain scission processfollows first
order
kinetics.
The
activationenergy
ofthe
broken bond
willbe
determined
from isothermal
TG
method.The
corresponding
sidechain
causing the
formation
ofthe
decomposition
products canalso
be
determined.The
thermal
decomposition
products ofthe
two
polymers willbe
studied afterisothermal
heating
underboth
air and nitrogen atmosphere
using
the
HP 5995
GC/MS.
One
ofthe
mostcommonly
used methodsfor
determining
the
stability
of a polymeris
to
find
its
activationenergy
for the
activation
energy
ofthe
decomposition
reaction ofthe
polymer'sside chain
is
consideredto
be
a measure ofthe
stability
ofthe
polymer.26
Polyesters
8
and9
will alsobe
synthesizedusing
eitherinterfacial
polymerization or solution polymerization.Their
isothermal decomposition
products and activation energies willalso
be
determined.
8
n
ft
\j
The
results obtainedfor
these two
polymers will explainif the
benzene
and oxygenatedbenzene decomposition
products obtainedfrom
polyester6
and7
comesfrom
the phenyl,
styryl ora-methylstyryl side chain.
The
corresponding
activationenergy
for
bond
scission will also supportthe
findings.
Results
andDiscussion
The
thermal
degradation
reactionis
ahomolytic
orfree
radical reaction caused
by
the
rupture of chemicalbonds
withthe
formation
of radicals.The
specific radicalsformed
aredependant
upontheir
thermodynamic
stability.A less
stablebond
will
be
easierto
break
than
a more stable one.Aliphatic
bonds
found
in the
styryl side chainfor
example are weakerthan the
aromaticbonds found
in the
phenyl side chain.CH-CH3
Figure 5.
Styryl
and aryl side chainTable
I lists
the
respectivebond dissociation
energies of various chemicalbonds.
Ea(kcal/mol)
1. C6H5-H ? C6H5- + H 104
2.
C6H5-C6H5
> C6H5. ?.C6H5 100.5
3.
C6H5-CH3
C6H5. ? .CH3 944.
C6H5-CH2-CH3
>C6H5-CH-CH3
? H 81.6 5.C6H5-CH-(CH3)2
*C6H5-CH-CH3
? .CH3
68.7Table I.
Bond dissociation
energiesfor
various chemicalbonds.
Polyester
6 is
an aromatic polyester whichis
preparedfrom
the
solution polymerizationofterephthaloyl
chloride withequal amounts of
2-phenyldroquinone
and2-styrylhydroquinone.
degradation
studies under air wereidentified
asbenzene,
styrene,benzaldehyde,
phenol;
and acetophenone.Most
ofthe
products were collectedin the
first
trap
withthe
spill-over productscollected
in
traps
2
and3.
GC/MS
was usedto
analyzethe
contents of
the
traps.
The
observed products canbe
attributedto
the
lability
ofthe
carbonbonds found
in
the
phenyl orthe
styrylside chain substitutents
in
polyester6.
CH-CH3
The
results ofthe
GC/MS
analysis of coldtrap
#1
is
shownin
Table
II.
Temperature
(C)
0H
Products
Styrene
0CHO 0OH
0COCH3
260
270
290 *
*_
310 #
330 *
350 **
Relativeabundancesbaseduponionpeakheights t =trace
Table II. GC/MS
analysissummary
oftrap
#1
for
polyster6
underair atmosphere.
From Table II
it
seemsthat
atthe lower
temperature
of260C,
the primary
products werebenzaldehyde,
phenol,
andacetophenone.
The
criticaltemperature
for the thermal
stability
of polyester
6
seemsto
be between 260
-270C.
At
270C,
the
polymer
decomposes
to
givebenzene
and styrenealong
withbenzaldehyde,
phenol,
and acetophenonein larger
amounts.The
identity
ofthe
products were confirmedby
matching
their retentiontimes
and massfragmentation
patterns withknown
compounds.
Possible
reactionpathway
for
the decomposition
product
formation
is
shownin
Figure
6.
H-C-CHj
i.o,
CH-0
R-H
O-H
1.R-H
OCfr
a
CH-CH,
Q.CO.CH,
Figure 6.
Proposed
reactionpathway
for formation
ofdegradation
products
for
polyester6
under air.By
comparison ofthe
two
side chainsubstitutents,
the
styryl pendantgroup
should give a more stable radicalthan
the
phenylradical.
Therefore,
allthe
degradation
products shouldbe
derivative of
the
styryl side chain.From
the pathway, the
degradation
products canbe derived
results
in
a styrene molecule.Homolysis
of1-phenylethyl
radicalto
a phenyl radical proceededby
ahydrogen
abstraction yieldsbenzene.
The
decomposition
ofthe
hydroperoxide
of1-phenylethane,
formed
by
the
reaction of1-phenylethyl
radicalwith oxygen accounts
for the
oxygencontaining
product ofbenzaldehyde,
phenol and acetophenone.It
also shouldbe
notedthat
alllow
boiling
gases such asmethane, ethane,
carbondioxide,
and carbon monoxide are expected productsbut
are notmonitored.
Polyester
6,
studiedisothermally
under nitrogenatmosphere resulted
in
non-oxygenated aromatic products.The
primary
products observed werebenzene,
toluene,
ethylbenzene,styrene,
and xylenes.The
mechanismfor
the
formation
ofthe
degradation
productsis
showin Figure
7.
C6H5- + R-H CgHyH ?
R-C6H5- ? CH3- *
CeHsOH;,
CH3-C6H4-? CH3
C6H4-{CH3)2
C6H5-CH-CH3
C6HrCH2-CH3
C6HrCHsCH2
Figure 7. Proposed
reactionpathway
for the formation
ofdecomposition
productfor
polyester6
under nitrogen.The
predominant products were ethylbenzene and styreneand
they
arederived from
a1-phenylethyl
radical.A
hydrogen
abstraction yields
ethylbenzene,
while ahydrogen
eliminationgives styrene.
Homolysis
ofthe
1-phenylethyl
radical givesthe
phenyl radical.
Abstracting
ahydrogen
givesbenzene,
while tolueneis
a combination product of a phenyl and methyl radical.Xylene
is
the
result of a combination reaction of atolyl
radicalwith a methyl radical.
The GC/MS
product analysis oftrap
#1
is
summarized
in
Table
III.
Temperature
(C)
ProductsBenzene Toluene Ethylbenzene Styrene Xylenes
270 290
300
310
320 330
340 / t f
350 t *
f
360 t f
370 ?# #*# #*
t
*
Abundancebaseduponionpeakheights t - trace
Table III.
GC/MS
analysissummary
oftrap
#1
for
polyster6
undernitrogen atmosphere.
o
o
II
/=\
II
\s
1.0
lp
(CH
A
Polyester
7,
like
polyester6 has
the
phenyl side chainbut
instead
of a styryl sidechain,
it has
an a-methylstyryl sidechain.
The
a-methylstyryl groups arelabile
andis
mostlikely
to
undergo thermal or
thermo-oxidative
decomposition.
The
aliphatic
bonds
presentin
the
a-methylstyryl side chain are alsoweaker than
the
phenyl side chain and are susceptibleto
homolysis
or oxygen attack.Polyester 7
was providedby
Granmont
Inc.
and was preparedby
a melt polymerization ofterephthalic acid with equal amounts of
the
diacetate
esters of2-phenylhydroquinone and
2-methylstyrylhydroquinone.
The
air are
listed in Table IV.
Temp. (
C)
ProductsHAc (J>H
0CH3
0EtSty
Cumene0O-D
-MeSty220
240
260
280
300
320
340
360
380
400
*
Relativeabundancesbaseduponionpeakheights t = trace
Table IV. GC/MS
analysissummary
oftrap
#1
for
polyester7
under air atmosphere.
The
major products werebenzaldehyde,
acetic acid anda-methylstyrene.
The
products werefirst
observedforming
atthe
low
temperature of220C.
The
acetic acidmay have been
produced
by
a chain extension reactioninvolving
acetate esterand carboxylic acid end groups shown
below,
^=\
ll0-C-CH3
+HOC
Heat
HI)
o-c
\
/A
+ch3cooh
At
the
criticaltemperatures
ranging
from
360-380C,
productssuch as
benzene,
toluene,
ethylbenzene,
styrene and cumene wereobserved.
The only
oxygenated product observed wasbenzaldehyde.
Unlike
polyester6,
phenol was not observed as adegradation
product.The
probablepathway
for
the formation
ofthe
decomposition
productsis illustrated
in
Figure 8.
C
(CH3)2
\JH
CH3.
/
RH
a/CH3
C<CH3
1.
RH
2P-H
pH3
CH3
O**
O
OjrO-&H3
Figure 8.
Proposed
reactionpathway for
the
formation
ofdegradation
productsfor
polyester7
under air.The
decomposition products arederived from
the
a-methylstyrylside chain.
Homolysis
ofthe
side chain yieldsphenyl, methyl,
and1-methyl-1-phenylethyl radicals.
Phenyl
radical abstraction of ahydrogen atom yields
benzene.
Combination
of methyl and phenylradicals
to
givetoluene
and xylene.The
1-methyl-1-phenylethyl
radical can either abstract or eliminate a
hydrogen
atomto
yieldcumene and a-methylstyrene respectively.
Benzaldehyde
formation
is
a probable result of asecondary
reactionby
the
When
polyester7
was studied underflowing
nitrogen, the
primary
products observed were all non-oxygenatedbenzene
products.
The degradation
products arelisted in Table V.
Temp <C)
HA: 0H
0CH3
Products
Curone (-MeSty
270
310
330
350
370
390
410
*
Relativeabundancesbasedupontonpeakheights t = trace
Table V.
GC/MS
analysissummary
oftrap
#1
for
polyester7
under nitrogen atmosphere.
The primary
products were acetic acid, cumene, anda-methylstyrene.
Benzene
and toluene were observed atthe
criticaltemperatures
ranging from 350
to
370C.
The
reactionpathway
are
identical
to the
one shownin
Figure
7.
Polyester
8
was preparedfrom the
reaction of equal partsof terephthaloyl chloride and
2-phenylhydroquinone using
solutionpolymerization techniques.
It
wasdecomposed
isothermally
under
flowing
airfrom 260 to
340C in 20C increments.
A
study
of
the
decomposition productsby
GC/MS
showedthe
absence ofbenzene and oxygenated
benzene
products.This
suggeststhat the
formation
ofbenzene
and oxygenatedbenzene
products observedin the
decomposition
of polyesters6
and7
areformed
by
the
decomposition
ofthe
styryl and a-methylstyryl pendant groupswhich are present
in these
polymers.o
_
o
ac-^Yc-o-Polyester 9
was madefrom
reaction of equal parts ofterephthaloyl chloride and a-methylstyrylhydroquinone.
It
wasalso
decomposed
under air atthe
sametemperature
range.The
decomposition
products arelisted in Table VI.
Temp.
(C)
Products0H
0CH3
0CHO
a-MeSty0CH2OH
Cumene0COOH
260 t t
280 t t
300 t
320 t _
340 t **
'Relative Abundance based upon ion peak heights t= trace
Table VI. GC/MS
analysissummary
oftrap
#1
for
polyester9
under air atmosphere.
The
degradation products of polyester9
areidentical to the
degradation products observed
for
polyester7
withthe
exceptionthat
benzoic
acid andbenzyl
alcohol were also observed.These
The
activation energies ofthe
polyesters were calculatedby finding
the
rateConstants k
for
specifictimes
during
the two
hour isothermal study
period.The
rateconstant,
k,
is determined
by
using
equation2
found
on page11.
The
slope ofthe
curve ofIn
(1-w)
versustime
givesthe
rate constantk.
The
variable w canbe
determined
from
the
isothermograms
ofthe
variuos polymers.w
is
the
difference between
the
initial
sampleweight,
M0>
andsample
weight,
M,
at a specifictime
divided
by
the
difference
between
initial
weight,
M0i
andfinal
weight,
Mf.
W-(M0-M)
/(M0-Mf)
(9)
The
variablemf
(an
assumedtheoretical
value)
wastaken
asthe
weight ofthe
polymerrepeating
unit after elimination ofthe
pendant side chains.
Mf
=M0-[M0x
(side
chain percent
composition)]
(10)
The
side chain percent weight compositionfor
polyesters6,7,8,
and
9
are37, 38,
24,
and33%
respectively.Isothermogram
oftrial
#1
for
polyesters6, 7,
8,
9,
andsolution polymerized polyester
7
are shownin
Figures
9-13
respectively.
From
The
Arrhenius
plot ofIn k
versusthe
reciprocal of
the
absolutetemperature,
1/T,
givesthe
curvewhose slope
is
Ej/R
whereR is
the
universal gas constant.Polyester
6
wasinitially
studiedusing
the
Perkin-Elmer
TGS-2 TGA
underflowing
air and nitrogen attemperatures
ranging from
320
to
400C
atincrements
of10
degrees.
A
total
of sixteen runs were carried out
for
polyester6
undernitrogen,
two
trialsfor
eachtemperature
increment.
A
total
oftwenty-four
runs were carried outfor
polyester6
underair,
three trials
for
each temperatureincrement.
Polyesters
6, 7,
8,
and9
werethen
studiedusing
the
Seiko
TG/DTA
220
underflowing
air attemperatures
ranging from 260
%
91
o o
00 CO
ro
CD
CVJ cn
o>
o CJ
o o
o
CO
to
w 0)
o Q.
c , *
(fl
oe
CD
LU .,
s o
?-H t
E
nj
___
D>
O
E
___ o_=
o **
CO o
CO
CO
as
91
o
o cn en cn
co co
o
o cn
o
__
"co
CT)
CD
->H
CO
CO
o Q.
*
c ,
^
(0
e CO
LU .,
_
o
I
1
E
co_.
O)
o
E
_.CD
-C
o _>-*
CO o
to
CO
_. _J
Ll
*
91
o o
cn co
cn cn
co
o
CNJ
O
CD
o __ CD
CO
CO
_. CD
->*
to CD
O a.
c *fc -f -_->
oe co
CO _.
LU +-* _
*_-i o
t
E
CO
-_
O) o
E
_. CD
O -C
CO O
to
CD _. _J O)
*
91
00
r-.
cn
in
-j*
cn
co
cn
co co
o
CJ
o cn
o
'cd
CO
o _.
CD
*-< CO
CD
o a.
*
c
oe CO
CO _.
LU
_. t( o
t
E
co
__,
O)
o
E
L-CD
o -C
CO o
to
CM
CD
ZJ
*
91
o o
un cn
o
cn CD
o CO
o CJ
o cn
CD
O CO
CD
to
CD
o a.
x>
CD N
'_. CD
E
o a.
c
o
o
CO
C
T-"co
E
CO
_.
D)
O
E
CD
O
to
CO
0
.
3
to
340C
atincrements
of20
degrees.
A
total
oftwenty-five
runs were carried out
for
each polyester underair,
five
trials
for
each
temperature
increment.
Solution
polymerized polyester7
was studied under
flowing
airfrom 210
to
240C
at
increments
of
10
degrees.
A total
of20
runs were carried outfor
solutionpolymerized
polyester7
underair,
five
trials
for
eachtemperature
increment.
All
ofthe
polymers studied wereprepared
by
solutionpolymerizations
withthe
exception ofpolyester
7,
whichis
preparedby
a melt polymerization.The
activation energies of polyesters6, 7,
8.
9,
andsolution polymerized polyester
7
calculatedfrom both
the
Perkin-Elmer
andSeiko
instrumentations
arelisted
in
Table
VII.
Polymer
iEa
(kcal/mole)
Instrumentation
jPolyester
6
in N2
43
PE
[Polyester
6 in
air31
(init.),
28(final)
PE
jPolyester
6 in
air22(init.),
12(final)
Seiko
jSoln.
Poly. 7
in
air36
Seiko
Polyester 7 in
air14(init.),
1 1
(final)
Seiko
Polyester 8 in
air16(init.),
12(final)
Seiko
Polyester 9 in
air20(init.),
16(final)
Seiko
Table VII.
Summary
of calculated activation energies.Polyester
6
wasinitially
studiedusing
the
Perkin
-Elmer
TGS-2 TGA
underflowing
air and nitrogen attemperatures
ranging from 320 to 400C
atincrements
of10
degrees.
A
total
of sixteen runs were carried out
for
polyester6
undernitrogen,
two trials
for
eachtemperature
increment.
A total
oftwenty-four
runs were carried outfor
polyester6
underair,
three
trials
for
eachtemperature increment.
The
activation energies obtainedfor
polyester6
using the
Perkin-Elmer TGS-2
TGA
underboth
air and nitrogen were notcompared
to
the
data
obtainedfrom the
Seiko
instrumentation.
The
two
thermobalance
configurationsfound in
these instruments
are
completely different
anddo
not allow a valid comparison ofkinetic
data.
Under
nitrogen, the
activationenergy for
polyester6
wasdetermined
to
be
43 kcal/mole.
The linear Arrhenius
plotshowed
that
no simultaneousdecomposition
reactions weretaking
place.The Arrhenius
plotis
shownin Figure
14
on page31.
The
Arrhenius
plotfor
polyester6
under air was non-linearand showed
two
distinct linear
regions evident oftwo
reactionstaking
place.The
activation energiesfor
polyester6
under airwere
found
to
be 31 kcal/mole for
the
initial
reaction and28
kcal/mole for
the
final
reaction.The Arrhenius
plotfor
polyester6
under airis
shownin Figure 15
on page32.
The Perkin-Elmer
results showed
that
polyester6 is
morethermally
stablein
nitrogen than
in
air as wouldnormally be
expected.The
rate constantdata
plots ofIn
(1-w)
versustime
for
allof
the
polyesters withthe
exception of solution polymerizedpolyester
7
showedtwo
distinct linear
regions,it
was apparentthat
two decomposition
reactions weretaking
place andthe
activation energies obtained
from using
this
unseparateddata
would not
be
valid.An
example of a rate constant plotshowing
the two linear
regionsfor
polyester6
is
shownin Figure 16
onpage
33.
In
orderto
obatin validdata,
the
rate constant curveswere
divided
into
two regions,
corresponding
to the
initial
andfinal
decomposition rate.New
rate constant plots wereconstructed
for
the
initial
andfinal
rates andthey
were usedto
determine
activation energiesfor
the
polyesters.The newly
constructed rate constant plots
for
polyesters6,7,8,9,
andsolution polymerized polyester
7
are shownin
Figures
17
-21
respectively.
The
activationenergy
for
polyester6
(containing
phenyl and00 OS
u
<
c_
I
o
a
II >1
*"I
CD
E
LU
c
__ CO
c CD D)
O
CO
c 3
to
. CD ->H< to CO
o a.
o.
to
"c
CO
<
CO _. 3
ON
ON
o o n II
< <
** c C
F
b o
o CD
6 C\J
6
5
9 <B
2 2
C8 T3
H, c
c u.
CO
E
LU
i
c
j_
CO
CL
CO
CO D c 3
to o
o _.
(0 CD
^
^_-CO
fc
CDO D.
o.
w
*C
CD
LO
CO
i_
3 D>
Ll
o o o o o
8 oo
8
8
w w eo co eo
?
?
*
?
o
o o
o
o
b
CM
6 6
CO
_.
<0 "O c 3
to
CO
CO
CD >N
o Ql
_.
o . ^~^k
o
o ._:
Q. CO
CO +-*
c CO
*-> CD
to CO
o co o O.
CD CD
CO
co c rr 3
CO
CD
_>
3
(M'I)UI
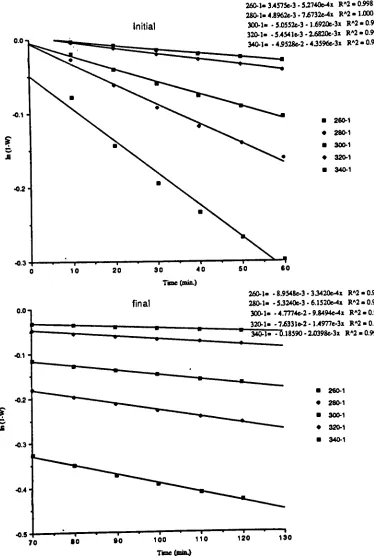
260-1-Z3857e-3-4.0714e-3x R*2-0.987
280-1- 2_5000e-3-3.5179e-3x RA2-0.994
300-1-9.3429e-3-8_250e-3x R*2-1.000
320-1-2.1171e-2-2-714e-2x RA2-0.994 340-1-1.19576-2-1261 le-2x R*2-0.972
- 260C
280C
300C
320C
34CC
final
260-1--7.1368e-3-3.0674e-4x R*20.999 280-1- -2.9334e-3-3.1533e-4x R2-1.000
300-1- -7.7291e-3 -7.8420e-4x R*2-0.998
320-1- -9.8532e-2-1.1439e-3x RA2-0.991
340-1- -7.8690e-2-1.01276-3x R*2-0.998
260C-1
280C-1
3O0C-1
32CC-1
340C-1
100 110
Time(mm.)
130
260-1- -2-2699e-2-5.9539e-4x R*2-0.988
280-1- - 1.99J5e-2-93745e-4x R*2-0.996
300-1- -1.4074e-2 l-8796e-3x RA2-0.970
320-1--3.22786-2-2.0764e-3x RA2-0.972
2.6461e-3x R*2-0.962
260-1 280-1 300-1 320-1 340-1
Tune(min)
260-1- -3.3503e-2 -4.0359e-4x RA2-1.000
280- 1- -3.9589e-2-6.2254e-4x RA2-0.997
300-1- -7.58636-2 -8.1162e-4x R*2-0.996
320-1- -0.10235-8.64406-4x RA2-0.996
340-1- -0.16028- 1.2958e-3x R"2-0.997
260-1 280-1 300-1 320-1 340-1
I I I ' I
100 110 120 130 Time(mm.)
Figure 18.
Rate
constant plotfor
polyester7
under air(Seiko).
0.00-initial
260-1-- l_M25e-2-2.6252e-4x RA2-0.958 280-1- 1.4095e-2-2.0276e-4x RA2-0.965
300-1- -1.8092e-2-8.1855e-4x RA2-0.982
320-1- -2.61186-2-1.1132e-3x RA20.961
340-1- -3_367e-2-U242e-3x RA2-0.978
260-1
280-1
300-1
320-1
340-1
0.02 final
260-1- - 1.9970e-2
-1.3017e-4x R*2-0.997 280-1- - 1.93956-2-1.1439e-4x RA2-0.990
300-1--4. 1643e-2-4.1269e-4x R*2-0.990
320-1--7.1299e-2-3.2707e-4x
RA2-0.990
340-1--7.49856-2-5.9007e-4x R*2-0.996
260-1
280-1
300-1
? 320-1
340-1
130
Initial
260-1- 3.457Se-3-5_740e-4x RA2-0.998
280-1-4h89626-3-7-57326-4x RA2-1.000 300-1- -5.05526-3-1.6920e-3x R2-0.994 320-1--5.45416-3-2^820e-3x R2-0.991
-455286-2-4J596e-3x R*2-0.979
260-1
280-1
300-1
? 320-1
340-1
Tme(min.)
final
-260-1- -8.9548e-3-3_V420e-4x R"2-059
280-1- -532406-3-6.1520e-4x R*2-0.99
300-1- -4.77746-2 -9.8494e-4x R*2-0.9".
320-1- -7.63316-2-1.4977e-3x R*2-0.9!
"
340-1- -6.18590-2j0398e-3x RA2-0.99<
260-1
280-1
300-1
320-1
[image:47.545.89.463.62.618.2]340-1
Figure 20.
Rate
constant plotfor
polyester9
under air(Seiko).
-o CD N '.
CD
E
o Q.
C
o .
o
O CD to
CO
. ^B* o L_
*^-^J
'co
o .
Q. CO "O *H
c
C 3
CO ->
CO I"*
c i_
o CD o
CO
CD >>
"co
_c o Q.
_J
CM
CD .
3 O)
12
kcal/mole
for the
initial
andfinal decomposition
reactionsrespectively.
Polyester
7
was obtainedfrom
Granmont
Inc.,
was preparedby
a melt polymerizationtechnique
and as such containedcarboxylic acid and acetate end groups as well as pendant phenyl
and a-methylstyryl side chains.
The
major product observedin
the
GC/MS
decomposition
productstudy
was acetic acid,formed
by
a chain extension reaction.The
activation energiesdetermined
for
melt polymerized polyester7
were14
kcal/mole for
the
initial
reaction and11
kcal/mole
for
the
final
reaction.We
believe
that
these
low
results aredue
to
chain extensionliberation
of acetic acid and notthe
decomposition
ofthe
pendantside chain.
In
orderto
make a valid comparisonbetween
the
polymerstructures
in
polyesters6
and7,
polyester7
was preparedby
asolutiuon polymerization
technique.
Polyester
structures6,
and7
would thenhave
the
same carboxylic and phenolic endgroups,
but
differing
only in
their
side chain groupings.The
activationenergy
for
solution polymerized polyester7
wasdetermined
to
be 36 kcal/mole.
We
expectedthis
valueto
be
lower
than the
value
for
polyester6 because
the
a-methylstyryl sidegroup is
more
labile
than the
styryl.We have
noready
explanationfor this
anomalous result.The inherent viscosity for
this
material wasdetermined
to
be 0.7
dL/g,
whichis
evidencefor
ahigh
molecularweight polymer.
However,
polyester6 had lower
activationenergy
whencompared
to
solution polymerized polyester7
(containing
phenyland a-methylstyryl side chain
groups)
with36 kcal/mole.
Solution
polymerized polyester7
was expectedto
have
alower
activation
energy
than solution polymerized polyester6
but
the
results obtained were not consistent.
The Arrhenius
plots ofpolyester
6,7,
and solution polymerized polyester7
are shownin
Figures
22
-24
respectively.The
inconsistency
canbe
explainedby
comparing the
dynamic
TG
thermograms
ofthe
polymers.The
dynamic TG
s
VO ON dii ii
_ c
c E
F o
o
to
o CM
3
to
2
O
2
ra 73
; c c u.
II -3
O
'co
CO
co
CD
"D
c 3
0
to
CDo Q.
Q.
CO
3
'c
CD
CO
CJ
CO i 3
_?
Ll
*"l
CO et K !_
3
ll o to o CM CD O Q. T3 CD N "i_ CD o inE
o CM o Q. Cg
3 O O to o . oCM o ,_.
thermograms
for
polyesters
6, 7,
and solution polymerizedpolyester
7
are shownin
Figure
25
-27
respectively.
The
onset of polymerdecomposition
temperatures,
taken
from
the
thermograms
arehigher
for
polyesters6
and melt polymerizedpolyester
7,
446
and447C respectively,
than
for
solutionpolymerized polyester
7
whichhad
adecomposition
temperature
of
289C.
From
the
dynamic TG
thermograms,
polyesters6 had
aninital
weightloss